 Duplex
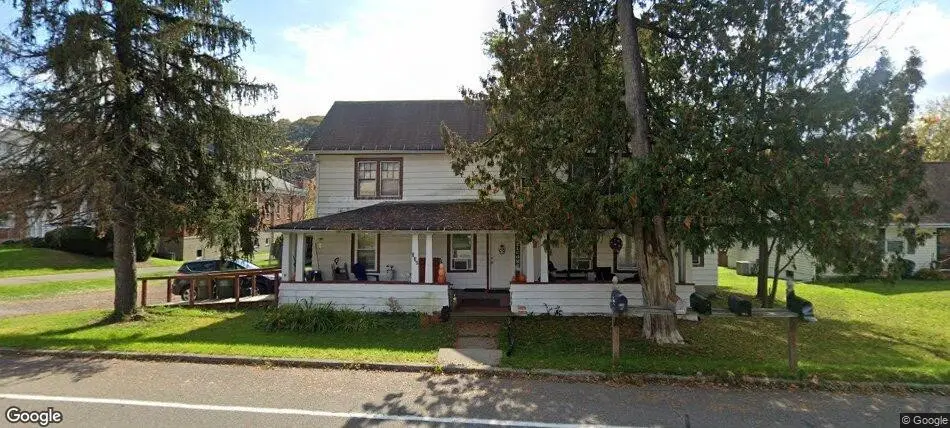
736 River Rd · Chenango Bridge, NY
Flood risk 1/10 · Minimal
- FEMA flood zone
- X
- Chance of flooding over 30 yrs
- 0.0%
- Est. flood insurance / yr
- $473 – $860
Fire risk 1/10 · Minimal
- Est. fire insurance / yr
- $691 – $1,283
Heat risk 3/10 · Minor
- Hot days now (above 92°F)
- 7 days/yr
- Hot days in 30 yrs
- 16 days/yr
Wind risk 2/10 · Minimal
- Chance of severe wind over 30 yrs
- 2.0%
Air-quality risk 2/10 · Minimal
- Unhealthy air days now
- 0 days/yr
- Unhealthy air days in 30 yrs
- 1 days/yr
Risk factors via First Street. Map © Google.
Why this score? — see what drove the B+ grade
The composite is a weighted blend of 9 inputs, each scored 0–100. Each bar is that input's sub-score; the figure is the points it added to the 100-point composite (weight × sub-score).
- Cash flow +30.0/30.0
- ARV discount +15.0/15.0
- 1% rule +10.0/10.0
- DSCR +10.0/10.0
- Schools +4.5/10.0
- Livability +3.5/5.0
- Rent growth +2.5/5.0
- Condition / age +2.5/5.0
- Appreciation +0.0/10.0
$194,500
🖨 Deal sheet (PDF) 📄 Offer letter ✓ Due diligence
Multi-family units
County records classify this as Multi-Family (2-4 Unit). Listing-text estimate: 2 units. confirmed
Listing remarks MLS
Side-by-side duplex on River Road across from Chenango Bridge Elementary. Left unit offers 2 bedrooms, 1.5 baths, living room, dining room, kitchen, and laundry in the half bath. Right unit features 3 bedrooms, 1 full bath, an eat-in kitchen, and separate laundry room. Convenient location close to schools, shopping, and major routes. Suitable for investors or owner-occupants. Tenants pay their own utilities.
Key facts
- Side-by-side duplex
- Convenient location
- 1.5 acre lot
Tags
Neighborhood map
What this means for you Summary
Snapshot
- This is a 1×2.0bd/1.5ba + 1×3.0bd/1.0ba units multifamily listed at $194k.
Deal economics
- At list price, monthly cash flow is $742 ($9k/yr) — positive. Per door: $371/mo.
- The deal already cash-flows at list — no discount required.
- Meets the 1% rule at list price ($3k rent vs $194k).
- Recommended offer: $183k (6.0% below list) — sets the bar for market timing.
- Cap rate 10.9% vs local median 4.0% in Chenango Bridge — top-decile yield for the area; either an underpriced asset or a hidden risk that comps aren't pricing in. Stress-test before assuming the spread holds.
Location & tenants
- Location reads 69/100 on livability (#505 in NY) — a middle-class / working-renter tenant base. Strengths: housing A+, crime A-, employment B+; Watch: amenities F, commute F, health & safety D-.
- Chenango Valley Central School District (suburban): math 47% / reading 57% proficiency, ranked #339 of 590 in NY (top 58%) — acceptable for families but not a draw, mixed tenant base, ~2y average lease.
- Zoned schools: Port Dickinson Elementary School (408 students, 39% FRL); Chenango Valley Middle School (math 26% / reading 58%, grade D-, #379 of 729 statewide, top 54%, 370 students, 41% FRL); Chenango Valley High School (math 92%, 499 students, 37% FRL).
- Market conditions: 92 active listings in the ZIP; 340 units permitted in Broome County in 2024 (269 in 5+ unit buildings).
- At $2,935/mo this rent would consume 63% of the median local household income ($56k/yr) (locally 1230% of renters already pay >50% of income on rent) — very limited rent-growth headroom before tenants either downsize or default.
Forward outlook
- Local home prices are declining (-3.0%/yr); year-one equity from $1k of loan paydown is wiped out by about $6k of value loss. Plan a longer hold.
- Broome County population projected at -13% by 2050 — secular population decline; favor cash flow + early exit over multi-decade hold.
- At projected returns (-3.0% appreciation + 3.0% rent growth), your $54k cash investment doubles in ~8 years — after that, you're playing with house money.
Negotiation context
- It's been on market 74 days — a 6% lower offer ($183k) is reasonable based on typical stale-listing flexibility.
- Current owner paid $80k; list at $194k implies a 143% gain — meaningful room to come down on a strong offer.
Risks & watch-outs
- Watch-outs: property tax is 2.9% of price; built in 1900 — expect roof / HVAC / electrical / plumbing capex.
Questions for the listing agent
- It's been on market 74 days. Have you received any prior offers? Is the seller open to a 6% concession, seller financing, or rate buy-down credit?
- Can we see the unit-by-unit rent roll, current vacancy, and any below-market leases? What's the average tenancy length?
- What capital expenditures (roof, boiler, parking lot, exteriors) have been made in the last 5 years, and what's planned in the next 2?
- Built in 1900 — when were the roof, HVAC, electrical panel, plumbing, and water heater last replaced?
- Property tax is high relative to price — has the assessment been appealed recently, and will the sale trigger a re-assessment?
- Why hasn't it sold? Are there any deal-killer items the seller is aware of (foundation, flood, title, zoning, code violations)?
- Is there a deadline driving the sale (1031 exchange, divorce, estate, relocation)? That informs how much negotiation room exists.
- Schools are D-rated, which usually means shorter tenancies and higher turnover. Who's the typical renter profile here, and what's been the actual vacancy rate?
- What's the average days-on-market for RENTAL listings here right now (not sales)? A rising rental-DOM trend means longer vacancies and softer asking-rent achievability than the comps imply.
- What's the recent tenant-quality profile in this submarket — average credit score on applications, eviction rate, late-payment / NSF rate, and stable-employment percentage? A property-management company in the area should have these aggregated.
- How much new apartment / multifamily construction is in the pipeline within 1–3 miles? Heavy new supply (>2% of stock underway) typically softens rents 12–24 months out; light construction supports rent growth.
Investment metrics
- 1% rule
- 1.51% ✓
- Cap rate
- 10.87%
- Cash-on-cash
- 16.35%
- DSCR
- 1.73
- GRM
- 5.5
CMA / ARV
- ARV (median comp)
- $259,476
- List price
- $194,500
- Delta
- -25.04%
- Verdict
- UNDERPRICED
- Comps
- 6 within 2.0 mi
Projected returns pro-forma
-3.0% appreciation · 3.0% rent growth · sell at horizon
- IRR
- 7.5%
- Equity multiple
- 1.29×
- Total profit
- $15,917
- Equity at exit
- $29,001
- IRR
- 16.8%
- Equity multiple
- 2.39×
- Total profit
- $75,459
- Equity at exit
- $16,817
Cash invested: $54,460 (down + closing). Projections, not guarantees.
Landlord ↔ Tenant lean methodology
- Overall (STATE)
- 15 Strongly Tenant-Friendly
- State New York
- 15 Strongly Tenant-Friendly · D+10
- County
- — inherits STATE
- City
- — inherits STATE
ZIP-level market 13901
- Home prices YoY
- -5.1%
- Active inventory
- 92
- Price-to-rent
- 12.0×
Monthly cashflow live
- Estimated rent
- $2,935 medium interval (Pro) →
- Mortgage (P&I)
- −$1,020
- Tax from tax record
- −$476 /mo · $5,710/yr
- Insurance
- −$81
- HOA
- −$0
- Vacancy / Maint / Mgmt
- −$616
- Net cashflow
- $742
Break-even live
Sensitivity live
| Price | -10% $852 | -5% $797 | +0% $742 | +5% $687 | +10% $632 |
|---|---|---|---|---|---|
| Rent | -10% $510 | -5% $626 | +0% $742 | +5% $858 | +10% $974 |
| Rate | -1.0pp $840 | -0.5pp $791 | base $742 | +0.5pp $691 | +1.0pp $640 |
2-unit breakdown (identical units grouped — click to expand)
| Units | Beds | Baths | Est. rent |
|---|---|---|---|
| 1× unit | 2.0 | 1.5 | $1,348 |
| 1× unit | 3.0 | 1 | $1,586 |
| Total (2 units) | $2,935 | ||
UW: 25.0% down · 7.5% · 30yr · 1.5% tax · 5.0% vac · 8.0% maint · 8.0% mgmt
Financing live
Cash to close
- Down payment
- $48,625
- Closing costs
- $5,835
- Reserves months
- —
- Total cash needed
- —
Loan-product check · same deal, 3 products live
Conventional
25% down · 7.5% · 30yr
- Down + closing
- —
- Monthly P&I
- —
- Monthly cashflow
- —
- DSCR
- —
- Eligible?
- —
Personal DTI + credit; lowest rate.
DSCR
20% down · 8.5% · 30yr
- Down + closing
- —
- Monthly P&I
- —
- Monthly cashflow
- —
- DSCR
- —
- Eligible?
- —
No personal income docs; deal must DSCR.
Hard money
10% down · 12.0% · 12mo
- Down + closing
- —
- Monthly P&I
- —
- Monthly cashflow
- —
- DSCR
- —
- Eligible?
- —
Short-term bridge; refi at stabilization.
Listing history 20 events
-
2026-06-21days on market $194,500 Active 74 DOM
-
2026-06-19days on market $194,500 Active 72 DOM
-
2026-06-18days on market $194,500 Active 71 DOM
-
2026-06-17days on market $194,500 Active 70 DOM
-
2026-06-16days on market $194,500 Active 69 DOM
-
2026-06-15days on market $194,500 Active 68 DOM
-
2026-06-14days on market $194,500 Active 66 DOM
-
2026-06-13days on market $194,500 Active 65 DOM
-
2026-06-10days on market $194,500 Active 63 DOM
-
2026-06-09days on market $194,500 Active 62 DOM
-
2026-06-08days on market $194,500 Active 61 DOM
-
2026-06-07days on market $194,500 Active 60 DOM
-
2026-06-03days on market $194,500 Active 56 DOM
-
2026-06-02days on market $194,500 Active 55 DOM
-
2026-06-01days on market $194,500 Active 54 DOM
-
2026-05-31days on market $194,500 Active 53 DOM
-
2026-05-30days on market $194,500 Active 52 DOM
-
2026-04-09$194,500 Active 411-char remark
Show marketing remark (411 chars)
Side-by-side duplex on River Road across from Chenango Bridge Elementary. Left unit offers 2 bedrooms, 1.5 baths, living room, dining room, kitchen, and laundry in the half bath. Right unit features 3 bedrooms, 1 full bath, an eat-in kitchen, and separate laundry room. Convenient location close to schools, shopping, and major routes. Suitable for investors or owner-occupants. Tenants pay their own utilities.
-
2006-07-05soldstatus $80,000
-
2005-03-15soldstatus $57,000
ⓘ Source: listings_history table (triggers on properties + properties_extension) + one-shot
backfill from property_details.listing_events for pre-trigger history.
Tax reassessment forecast NY · Partial reset (capped growth)
- Current annual tax
- $5,710 · $476/mo
- Projected year-2 tax
- $5,710 · $476/mo
- Expected delta
- $0/yr ($0/mo · 0.0%)
ⓘ Screening estimate from a state-policy table — verify with the county assessor before closing.
Climate risk First Street
- Flood 1/10 Low FEMA zone X · 0% chance over 30 yrs
- Wildfire 1/10 Low
- Heat 3/10 Moderate 7 d/yr ≥92°F today · 16 d/yr by 30 yrs out
- Wind 2/10 Low 2% chance of damaging wind over 30 yrs
- Air quality 2/10 Low 0 unhealthy d/yr today · 1 by 30 yrs out
Nearby sold comps map
Loading sold comps map…
Walkable amenities ~0.75 mi
Loading nearby amenities…
Taxation est. · year 1
- Rental income
- $35,220
- − Mortgage interest
- −$10,895
- − Property taxes
- −$5,710
- − Insurance
- −$972
- − Repairs & maintenance
- −$2,818
- − Management
- −$2,818
- − Depreciation
- −$5,658
- Taxable income
- $6,349
- Est. tax owed @ 24.0%
- −$1,524
- After-tax cash flow
- $7,378/yr
For passive investors: Depreciation is non-cash, so a rental often shows a tax loss while cash-flowing — sheltering income. Rental losses are passive: they offset passive income freely, and up to $25,000/yr can offset ordinary (W-2) income if you actively participate and your MAGI is under $100k (phasing out to $0 by $150k); unused losses carry forward. On sale, claimed depreciation is recaptured at up to 25%, and gains may owe capital-gains tax (a 1031 exchange can defer both). Figures are a year-1 estimate at your 24.0% rate — not tax advice; consult a CPA.
Schools (NCES district)
- District
- Chenango Valley Central School District
- NCES district ID
- 3607290
- Math proficiency
- 47% ▼ -11.00%
- Reading proficiency
- 57% ▲ 4.00%
- Median HH income
- $53,938
- Composite
- 44.78/100
- National rank
- #2745
- State rank
- #339 of 590 in NY
Livability — Chenango Bridge
- Score
- 69/100
- State rank
- #505
- US rank
- #8828
Category grades
Schools grade is shown separately in the Schools card above.
Census & demographics
- Census place
- Chenango Bridge, NY
- County
- Broome County · 126,805 people
- Metro
- Binghamton, NY
- Population (ZIP)
- 19,613
- Household income
- $55,523
- Rent vs Own
- Severe rent burden
- 1230.0
Population outlook (Broome County) Hauer SSP2
- Today (2025)
- 187,989 people
- By 2030
- 183,066 · -2.6%
- By 2040
- 172,228 · -8.4%
- By 2050
- 163,161 · -13.2%
- By 2075
- 153,641 · -18.3%
- By 2100
- 140,851 · -25.1%
Race, ethnicity, and origin ACS 2023
- Neighborhood character
- Predominantly White (80%)
- Race & ethnicity
- White 80% Two or more races 7% Hispanic / Latino 7% Black 5% Asian 2%
- Hispanic origin (detail)
- Puerto Rican 3%
- Common ancestry
- Romanian 6% Lithuanian 1% Italian 1%
- Foreign-born
- 5% · Canada, Jamaica
- Languages at home
- 93% English-only · Spanish 3% Russian/Polish/Slavic 1% Other Indo-European 1%
Political lean MEDSL · Broome
- 2024 margin
- Toss-up / Even · D 50.2% · R 49.8%
- 2008→2024 swing
- -7.6pp toward R · 2008: 8.0pp · 2024: 0.4pp
- All cycles
- 2024: D+0.4 2020: D+3.5 2016: R+3.7 2012: D+4.6 2008: D+8.0
Not yet ingested
- Civics
- —
Market trends
- HPI YoY
- ▼ -16.13%
- Current HPI
- 300.7692
- Rent YoY
- —
- Metro
- Binghamton, NY
- State GDP YoY
- ▲ 2.60%
- F500 in state
- 92
Industry mix (Fortune 500 HQ in NY)
| Industry | F500 HQs | Revenue |
|---|---|---|
| Financial Services | 10 | $950B |
|
||
| Consumer Goods | 9 | $162B |
|
||
| Insurance | 4 | $225B |
|
||
| Telecommunications | 2 | $144B |
|
||
| Pharmaceuticals | 2 | $112B |
|
||
| Media / Entertainment | 2 | $69B |
|
||
Price history
+241.2% since first listed3 events — show timeline
- 2026-04-09 Listed $194,500 GBAOR
- 2006-07-05 Sold (Public Records) $80,000 Public Records
- 2005-03-15 Sold (Public Records) $57,000 Public Records
Property tax history
+2.7%/yrLatest (2025): $5,710 · +17.2% YoY. Source: county tax records.
Cash-flow waterfall
monthlySold comps — $/sqft
last 12 mo · ≤1 miLoading sold comps…