118 Lude Rd · South Charleston, WV
Flood risk 1/10 · Minimal
- FEMA flood zone
- X (unshaded)
- Chance of flooding over 30 yrs
- 0.0%
- Est. flood insurance / yr
- $507 – $1,088
Fire risk 4/10 · Minor
- Est. fire insurance / yr
- $787 – $1,461
Heat risk 4/10 · Minor
- Hot days now (above 101°F)
- 7 days/yr
- Hot days in 30 yrs
- 19 days/yr
Wind risk 2/10 · Minimal
- Chance of severe wind over 30 yrs
- 1.0%
Air-quality risk 1/10 · Minimal
- Unhealthy air days now
- 0 days/yr
- Unhealthy air days in 30 yrs
- 0 days/yr
Risk factors via First Street. Map © Google.
Why this score? — see what drove the B- grade
The composite is a weighted blend of 9 inputs, each scored 0–100. Each bar is that input's sub-score; the figure is the points it added to the 100-point composite (weight × sub-score).
- Cash flow +30.0/30.0
- 1% rule +10.0/10.0
- DSCR +10.0/10.0
- ARV discount +7.5/15.0
- Livability +3.6/5.0
- Schools +2.9/10.0
- Rent growth +2.5/5.0
- Condition / age +2.2/5.0
- Appreciation +0.0/10.0
$56,900
🖨 Deal sheet (PDF) 📄 Offer letter ✓ Due diligence
Listing remarks
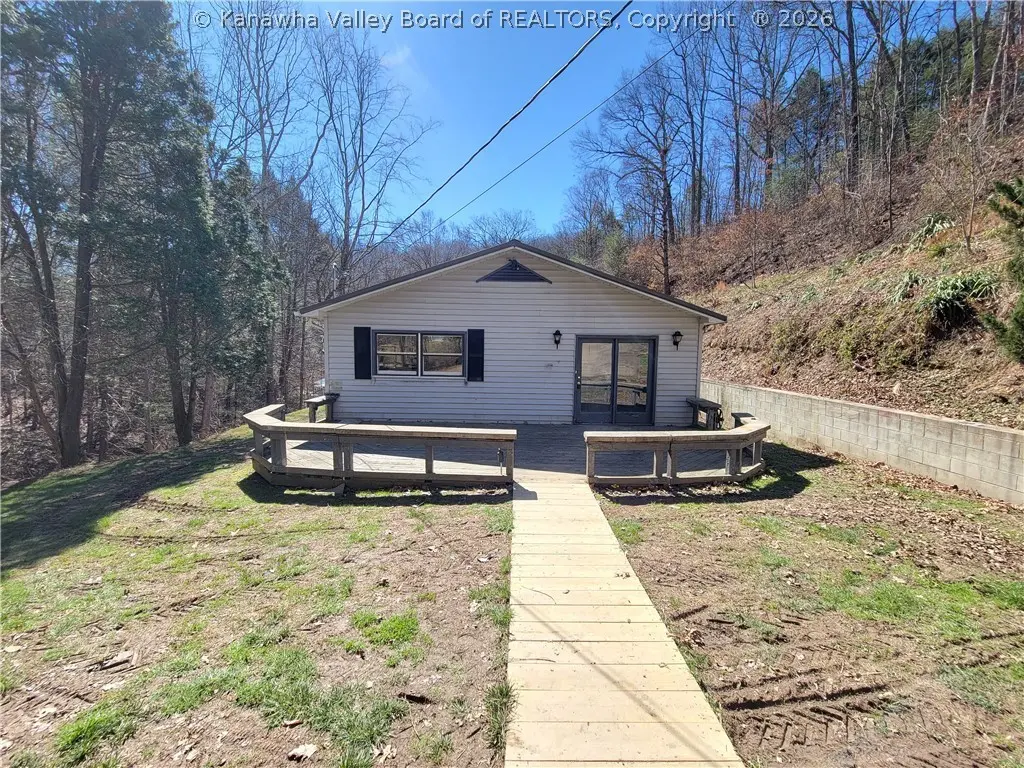
* * * Multiple offers have been received and the seller request that all potential buyers submit their highest and best offer before 10:00 AM EDT, Wednesday 4/15/2026. * * * Look at the potential in this 3-bedroom 1-bathroom single level home situated on a 1.66 acre +/- lot at the end of a dead end street. The kitchen and flooring has been removed and is ready for you to choose your own finishes. Off street parking for 4+ cars plus a detached garage that could be used as a storage building or workshop and has its own separate power meter. This property is eligible under the Freddie Mac First Look Initiative through 05/06/2026.
Key facts
- 1.66 acre lot
- Built 1985
- Listed 17 days
Neighborhood map
What this means for you Summary
Snapshot
- This is a 3-bed/1.0-bath single-family listed at $57k. Condition is rated fair.
Deal economics
- At list price, monthly cash flow is $551 ($7k/yr) — positive.
- The deal already cash-flows at list — no discount required.
- Meets the 1% rule at list price ($1k rent vs $57k).
- Recommended offer: $56k (1.5% below list) — sets the bar for market timing.
- Cap rate 17.9% vs local median 4.8% in South Charleston — top-decile yield for the area; either an underpriced asset or a hidden risk that comps aren't pricing in. Stress-test before assuming the spread holds.
Location & tenants
- Location reads 71/100 on livability (#58 in WV) — a middle-class / working-renter tenant base. Strengths: cost of living A+, housing A+, health & safety B+; Watch: crime F, amenities F, commute F.
- Kanawha County Schools (suburban): math 29% / reading 40% proficiency, ranked #17 of 55 in WV (top 31%) — families likely to look elsewhere, expect single-tenant / working-renter base with shorter leases.
- Zoned schools: Ruthlawn Elementary School (math 47% / reading 37%, grade F, #87 of 377 statewide, top 28%, 226 students, 0% FRL); John Adams Middle School (math 45% / reading 63%, grade B-, #2 of 109 statewide, top 1%, 705 students, 0% FRL) — zoned schools average 0% FRL vs 46% district-wide (46 pts lower); this property's tenant base skews higher-income than the district average.
- Zoned-school proficiency averages 48% at this address vs 34% district-wide (+14 pts) — the actual schools serving this property are materially stronger than the Kanawha County Schools average implies; a family-tenant draw the district grade alone would hide.
- Market conditions: 56 active listings in the ZIP; 103 units permitted in Kanawha County in 2024 (0 in 5+ unit buildings).
Forward outlook
- Local home prices are declining (-3.0%/yr); year-one equity from $393 of loan paydown is wiped out by about $2k of value loss. Plan a longer hold.
- Kanawha County population projected at -17% by 2050 — secular population decline; favor cash flow + early exit over multi-decade hold.
- At projected returns (-3.0% appreciation + 3.0% rent growth), your $16k cash investment doubles in ~3 years — after that, you're playing with house money.
Negotiation context
- It's been on market 17 days — a 2% lower offer ($56k) is reasonable based on typical stale-listing flexibility.
Questions for the listing agent
- Have any recent inspections been done? Can we get a copy of the seller's disclosures and any deferred-maintenance estimates?
- Is there a deadline driving the sale (1031 exchange, divorce, estate, relocation)? That informs how much negotiation room exists.
- Schools are D-rated, which usually means shorter tenancies and higher turnover. Who's the typical renter profile here, and what's been the actual vacancy rate?
- Crime grade is F in this area — have there been break-ins, vandalism, or insurance claims at this property in the last 3 years? What carrier currently insures it and at what premium?
- What's the average days-on-market for RENTAL listings here right now (not sales)? A rising rental-DOM trend means longer vacancies and softer asking-rent achievability than the comps imply.
- What's the recent tenant-quality profile in this submarket — average credit score on applications, eviction rate, late-payment / NSF rate, and stable-employment percentage? A property-management company in the area should have these aggregated.
- How much new for-sale + rental construction is in the pipeline within 1–3 miles? Heavy new supply typically softens prices + rents 12–24 months out; constrained supply supports both.
Investment metrics
- 1% rule
- 2.10% ✓
- Cap rate
- 17.91%
- Cash-on-cash
- 41.50%
- DSCR
- 2.85
- GRM
- 4.0
CMA / ARV
No comps found within radius.
Projected returns pro-forma
-3.0% appreciation · 3.0% rent growth · sell at horizon
- IRR
- 38.1%
- Equity multiple
- 2.62×
- Total profit
- $25,888
- Equity at exit
- $8,484
- IRR
- 44.6%
- Equity multiple
- 5.26×
- Total profit
- $67,801
- Equity at exit
- $4,920
Cash invested: $15,932 (down + closing). Projections, not guarantees.
Landlord ↔ Tenant lean methodology
- Overall (STATE)
- 83 Strongly Landlord-Friendly
- State West Virginia
- 83 Strongly Landlord-Friendly · R+22
- County
- — inherits STATE
- City
- — inherits STATE
ZIP-level market 25309
- Home prices YoY
- -21.6%
- Active inventory
- 56
- Price-to-rent
- 4.0×
Monthly cashflow live
- Estimated rent
- $1,195 medium interval (Pro) →
- Mortgage (P&I)
- −$298
- Tax est. 1.5%
- −$71 /mo · $854/yr
- Insurance
- −$24
- HOA
- −$0
- Vacancy / Maint / Mgmt
- −$251
- Net cashflow
- $551
Break-even live
Sensitivity live
| Price | -10% $590 | -5% $571 | +0% $551 | +5% $531 | +10% $512 |
|---|---|---|---|---|---|
| Rent | -10% $457 | -5% $504 | +0% $551 | +5% $598 | +10% $645 |
| Rate | -1.0pp $580 | -0.5pp $565 | base $551 | +0.5pp $536 | +1.0pp $521 |
UW: 25.0% down · 7.5% · 30yr · 1.5% tax · 5.0% vac · 8.0% maint · 8.0% mgmt
Financing live
Cash to close
- Down payment
- $14,225
- Closing costs
- $1,707
- Reserves months
- —
- Total cash needed
- —
Loan-product check · same deal, 3 products live
Conventional
25% down · 7.5% · 30yr
- Down + closing
- —
- Monthly P&I
- —
- Monthly cashflow
- —
- DSCR
- —
- Eligible?
- —
Personal DTI + credit; lowest rate.
DSCR
20% down · 8.5% · 30yr
- Down + closing
- —
- Monthly P&I
- —
- Monthly cashflow
- —
- DSCR
- —
- Eligible?
- —
No personal income docs; deal must DSCR.
Hard money
10% down · 12.0% · 12mo
- Down + closing
- —
- Monthly P&I
- —
- Monthly cashflow
- —
- DSCR
- —
- Eligible?
- —
Short-term bridge; refi at stabilization.
Listing history 2 events
-
2026-04-24status Pending
-
2026-04-03$56,900 Active
ⓘ Source: listings_history table (triggers on properties + properties_extension) + one-shot
backfill from property_details.listing_events for pre-trigger history.
Climate risk First Street
- Flood 1/10 Low FEMA zone X (unshaded) · 0% chance over 30 yrs
- Wildfire 4/10 Moderate
- Heat 4/10 Moderate 7 d/yr ≥101°F today · 19 d/yr by 30 yrs out
- Wind 2/10 Low 100% chance of damaging wind over 30 yrs
- Air quality 1/10 Low 0 unhealthy d/yr today · 0 by 30 yrs out
Nearby sold comps map
Loading sold comps map…
Walkable amenities ~0.75 mi
Loading nearby amenities…
Taxation est. · year 1
- Rental income
- $14,342
- − Mortgage interest
- −$3,187
- − Property taxes
- −$854
- − Insurance
- −$284
- − Repairs & maintenance
- −$1,147
- − Management
- −$1,147
- − Depreciation
- −$1,655
- Taxable income
- $6,067
- Est. tax owed @ 24.0%
- −$1,456
- After-tax cash flow
- $5,155/yr
For passive investors: Depreciation is non-cash, so a rental often shows a tax loss while cash-flowing — sheltering income. Rental losses are passive: they offset passive income freely, and up to $25,000/yr can offset ordinary (W-2) income if you actively participate and your MAGI is under $100k (phasing out to $0 by $150k); unused losses carry forward. On sale, claimed depreciation is recaptured at up to 25%, and gains may owe capital-gains tax (a 1031 exchange can defer both). Figures are a year-1 estimate at your 24.0% rate — not tax advice; consult a CPA.
Condition & rehab AI · 13 photos
This single-family home requires extensive renovations, including painting, flooring, and exterior siding repair, to bring it up to a fair condition. The property is situated on a 1.66-acre lot, offering ample space for updates and improvements.
Repairs flagged
- Major Exterior siding — Weathered and discolored, indicating significant wear.
- Major Interior walls — Uneven paint and signs of wear, requiring repainting.
- Major Flooring — Removed in multiple rooms, requiring new flooring.
Value-add opportunities
- Resale Painting and repainting — Fresh paint enhances curb appeal and interior finish.
- Resale New flooring — New flooring improves the home's appearance and functionality.
- Resale Exterior siding repair — Repairing the siding improves the home's appearance and value.
Renovation cost estimate screening
| Repair item | Severity | Est. cost |
|---|---|---|
| Exterior siding · Weathered and discolored, indicating significant wear. | Major | $15,000–50,000 |
| Interior walls · Uneven paint and signs of wear, requiring repainting. | Major | $15,000–50,000 |
| Flooring · Removed in multiple rooms, requiring new flooring. | Major | $15,000–50,000 |
| Total estimated repair cost · 3 items | $45,000–150,000 |
Value-add ROI direction
- Resale Painting and repainting — Fresh paint enhances curb appeal and interior finish. ↑
- Resale New flooring — New flooring improves the home's appearance and functionality. ↑
- Resale Exterior siding repair — Repairing the siding improves the home's appearance and value. ↑
ⓘ Cost ranges are severity-bucket heuristics (US national rule-of-thumb). Get contractor quotes + a written scope before underwriting a rehab budget.
Schools (NCES district)
- District
- Kanawha County Schools
- NCES district ID
- 5400600
- Math proficiency
- 29% ▼ -13.00%
- Reading proficiency
- 40% ▼ -7.00%
- Median HH income
- $44,329
- Composite
- 29.35/100
- National rank
- #6540
- State rank
- #17 of 55 in WV
Livability — South Charleston
- Score
- 71/100
- State rank
- #58
- US rank
- #6993
Category grades
Schools grade is shown separately in the Schools card above.
Census & demographics
- City population
- 6,987
- Population (ZIP)
- 12,144
Population outlook (Kanawha County) Hauer SSP2
- Today (2025)
- 178,946 people
- By 2030
- 172,906 · -3.4%
- By 2040
- 159,874 · -10.7%
- By 2050
- 148,148 · -17.2%
- By 2075
- 123,257 · -31.1%
- By 2100
- 96,454 · -46.1%
Race, ethnicity, and origin ACS 2023
- Neighborhood character
- Predominantly White (90%)
- Race & ethnicity
- White 90% Black 7% Two or more races 2%
- Common ancestry
- Serbian 4% Slovak 2% Lithuanian 2%
- Foreign-born
- 2%
Political lean MEDSL · Kanawha
- 2024 margin
- R (+17.4) · D 40.2% · R 57.6% · Other 2.2%
- 2008→2024 swing
- -17.0pp toward R · 2008: -0.4pp · 2024: -17.4pp
- All cycles
- 2024: R+17.4 2020: R+14.7 2016: R+20.6 2012: R+11.9 2008: R+0.4
Not yet ingested
- Civics
- —
Market trends
- HPI YoY
- ▼ -50.49%
- Current HPI
- 183.4559
- Rent YoY
- —
- Metro
- —
- State GDP YoY
- —
- F500 in state
- 0
Price history
2 events — show timeline
- 2026-04-24 Pending — KVBOR
- 2026-04-03 Listed $56,900 KVBOR
Cash-flow waterfall
monthlySold comps — $/sqft
last 12 mo · ≤1 miLoading sold comps…