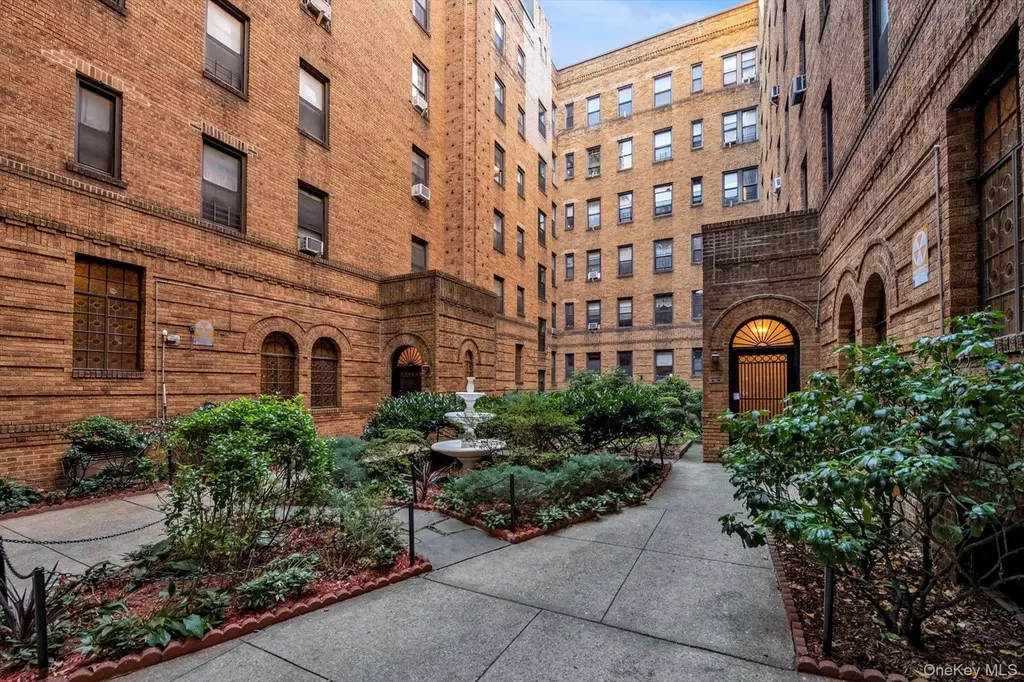
83-44 Lefferts Blvd Unit 6C · New York, NY
Flood risk 1/10 · Minimal
- FEMA flood zone
- X (unshaded)
- Chance of flooding over 30 yrs
- 0.0%
- Est. flood insurance / yr
- $507 – $1,088
Fire risk 1/10 · Minimal
- Est. fire insurance / yr
- $691 – $1,283
Heat risk 6/10 · Moderate
- Hot days now (above 99°F)
- 7 days/yr
- Hot days in 30 yrs
- 15 days/yr
Wind risk 6/10 · Moderate
- Chance of severe wind over 30 yrs
- 52.0%
Air-quality risk 4/10 · Minor
- Unhealthy air days now
- 6 days/yr
- Unhealthy air days in 30 yrs
- 6 days/yr
Risk factors via First Street. Map © Google.
Why this score? — see what drove the C+ grade
The composite is a weighted blend of 9 inputs, each scored 0–100. Each bar is that input's sub-score; the figure is the points it added to the 100-point composite (weight × sub-score).
- Cash flow +24.9/30.0
- DSCR +8.1/10.0
- ARV discount +7.5/15.0
- 1% rule +6.5/10.0
- Schools +5.0/10.0
- Livability +3.8/5.0
- Rent growth +2.8/5.0
- Condition / age +2.5/5.0
- Appreciation +0.0/10.0
$205,999
🖨 Deal sheet 📄 Offer letter ✓ Due diligence
Listing remarks
Recently renovated and move-in ready!! Beautifully Renovated 1-Bedroom in Pre-War Building. This bright and spacious home features high ceilings, abundant closet space, and large windows that fill the rooms with natural light. Prime location, just steps from the Long Island Rail Road (LIRR), Train, buses, JFK airport.
Key facts
- Move-in ready
- Large windows
- Recently renovated
Tags
Property features AI
Finance
- Other: Located in Queens County
- HOA & community: Additional monthly assessment of $192
Exterior
- Parking: No carport; Parking waitlist
- Utilities: Public sewer; Electricity connected; Natural gas connected; Public trash collection; Water connected
- Home design: Stock cooperative; Entry level: 1
- Construction: Brick construction
- Exterior features: Brick exterior; Not waterfront
Interior
- Kitchen: Gas Range; Refrigerator
- Bedrooms: 3 rooms total (includes bedrooms and living spaces)
- Bathrooms: 1 full bathroom
- Heating & cooling: Natural gas heating; Additional heating; Wall/window air conditioning units
- Interior features: Other interior features
Neighborhood map
What this means for you Summary
Snapshot
- This is a 1-bed/1.0-bath condo listed at $206k.
Deal economics
- At list price, monthly cash flow is $444 ($5k/yr) — positive.
- The deal already cash-flows at list — no discount required.
- Meets the 1% rule at list price ($2k rent vs $206k).
- Recommended offer: $203k (1.5% below list) — sets the bar for market timing.
- Cap rate 8.9% vs local median 2.6% in New York — top-decile yield for the area; either an underpriced asset or a hidden risk that comps aren't pricing in. Stress-test before assuming the spread holds.
Location & tenants
- Location reads 75/100 on livability (#268 in NY, #4,188 nationally) — a middle-class / working-renter tenant base. Strengths: amenities A+, commute A+, health & safety A; Watch: crime F, cost of living F.
- Market conditions: Rents rising (+1.4%/yr); 133 active listings in the ZIP; 30 comparable units currently listed for rent nearby; rentals at typical pace (median 25d on market — plan ~3-4 weeks tenant-placement turnaround); solid renter incomes; 5,302 units permitted in Queens County in 2024 (4,918 in 5+ unit buildings).
- This rent runs 33% of the median local income ($86k/yr) — at the standard rent-burdened threshold; future hikes will face affordability resistance.
Forward outlook
- Local home prices are declining (-3.0%/yr); year-one equity from $1k of loan paydown is wiped out by about $6k of value loss. Plan a longer hold.
- Queens County population projected at +16% by 2050 — long-run rental-demand tailwind backs the buy-and-hold thesis.
Negotiation context
- It's been on market 17 days — a 2% lower offer ($203k) is reasonable based on typical stale-listing flexibility.
- 2 sale attempts with the ask held roughly flat each time — persistent listings suggest the price (not the market) is what's stuck; bring a comps-based counter.
Risks & watch-outs
- Watch-outs: built in 1932 — expect roof / HVAC / electrical / plumbing capex.
- Climate carrying-cost: major wind risk, 52% chance of damaging wind over 30y; extreme-heat days projected 7→15/yr by 2055 (HVAC capex compounding) — expect insurance premiums to compound above CPI over the hold.
Questions for the listing agent
- Built in 1932 — when were the roof, HVAC, electrical panel, plumbing, and water heater last replaced?
- Any open or pending special assessments — roof, HVAC, plumbing, elevator, façade? What's the per-unit balance and payoff schedule, and is the seller paying it off at close or rolling it to the buyer?
- Is there a deadline driving the sale (1031 exchange, divorce, estate, relocation)? That informs how much negotiation room exists.
- Schools are B-rated — typically a magnet for longer-tenancy family renters. What's the average tenant stay here, and is there a school-zone premium baked into asking?
- Crime grade is F in this area — have there been break-ins, vandalism, or insurance claims at this property in the last 3 years? What carrier currently insures it and at what premium?
- What's the average days-on-market for RENTAL listings here right now (not sales)? A rising rental-DOM trend means longer vacancies and softer asking-rent achievability than the comps imply.
- What's the recent tenant-quality profile in this submarket — average credit score on applications, eviction rate, late-payment / NSF rate, and stable-employment percentage? A property-management company in the area should have these aggregated.
- How much new apartment / multifamily construction is in the pipeline within 1–3 miles? Heavy new supply (>2% of stock underway) typically softens rents 12–24 months out; light construction supports rent growth.
Investment metrics
- 1% rule
- 1.15% ✓
- Cap rate
- 8.88%
- Cash-on-cash
- 9.24%
- DSCR
- 1.41
- GRM
- 7.3
CMA / ARV
No comps found within radius.
Projected returns pro-forma
-3.0% appreciation · 1.35% rent growth · sell at horizon
- IRR
- -4.2%
- Equity multiple
- 0.85×
- Total profit
- $-8,927
- Equity at exit
- $30,715
- IRR
- 3.5%
- Equity multiple
- 1.23×
- Total profit
- $13,457
- Equity at exit
- $17,811
Cash invested: $57,680 (down + closing). Projections, not guarantees.
Landlord ↔ Tenant lean methodology
- Overall (CITY)
- 0 Strongly Tenant-Friendly
- State New York
- 15 Strongly Tenant-Friendly · D+10
- County
- — inherits STATE
- City New York
- 0 Strongly Tenant-Friendly · D+34
ZIP-level market 11415
- Rents YoY
- 1.4%
- Active inventory
- 133
- Price-to-rent
- 7.3×
Monthly cashflow live
- Estimated rent
- $2,364 high interval (Pro) →
- Mortgage (P&I)
- −$1,080
- Tax est. 1.5%
- −$257 /mo · $3,090/yr
- Insurance
- −$86
- HOA
- −$0
- Vacancy / Maint / Mgmt
- −$496
- Net cashflow
- $444
Break-even live
UW: 25.0% down · 7.5% · 30yr · 1.5% tax · 5.0% vac · 8.0% maint · 8.0% mgmt
Financing live
Cash to close
- Down payment
- $51,500
- Closing costs
- $6,180
- Reserves months
- —
- Total cash needed
- —
Loan-product check · same deal, 3 products live
Conventional
25% down · 7.5% · 30yr
- Down + closing
- —
- Monthly P&I
- —
- Monthly cashflow
- —
- DSCR
- —
- Eligible?
- —
Personal DTI + credit; lowest rate.
DSCR
20% down · 8.5% · 30yr
- Down + closing
- —
- Monthly P&I
- —
- Monthly cashflow
- —
- DSCR
- —
- Eligible?
- —
No personal income docs; deal must DSCR.
Hard money
10% down · 12.0% · 12mo
- Down + closing
- —
- Monthly P&I
- —
- Monthly cashflow
- —
- DSCR
- —
- Eligible?
- —
Short-term bridge; refi at stabilization.
Rent comps 30 comps
| Address | Beds | Baths | Sqft | Rent | $/sqft | DOM | Units | Dist |
|---|---|---|---|---|---|---|---|---|
| 8321 Lefferts Blvd Kew Gardens, NY | — | 1.0 | 550 | $2,100 | $3.82 | 24d | 1 | 0.07mi |
| 8380 118th St Unit 2P Kew Gardens, NY | — | 1.0 | 550 | $1,900 | $3.45 | 13d | 1 | 0.08mi |
| 8375 117th St Richmond Hill, NY | 1.0 | 1.0 | 650 | $2,695 | $4.15 | 24d | 1 | 0.10mi |
| 8375 117th St Unit 5E Richmond Hill, NY | 1.0 | 1.0 | 650 | $2,650 | $4.08 | 12d | 1 | 0.10mi |
| 8371 116th St Jamaica, NY | 1.0 | 1.0 | 688 | $2,725 | $3.96 | 5d | 2 | 0.14mi |
| 8340 Austin St Unit 7N Kew Gardens, NY | — | 1.0 | 550 | $2,000 | $3.64 | 24d | 1 | 0.31mi |
| 122-08 Hillside Ave Unit 2 Jamaica, NY | 2.0 | 1.0 | 700 | $2,500 | $3.57 | 24d | 1 | 0.32mi |
| 12015 Jamaica Ave Unit 2 Jamaica, NY | 2.0 | 1.0 | 700 | $2,200 | $3.14 | 24d | 1 | 0.36mi |
| 123-40 83rd Ave Unit 2107 Jamaica, NY | 1.0 | 1.0 | 750 | $2,573 | $3.43 | 24d | 1 | 0.54mi |
| 9915 Ascan Ave Forest Hills, NY | 2.0 | 1.0 | 600 | $2,700 | $4.50 | 24d | 1 | 0.78mi |
| 13828 Queens Blvd Unit 2E Briarwood, NY | 1.0 | 1.0 | 700 | $2,600 | $3.71 | 7d | 1 | 0.80mi |
| 138-28 Queens Blvd Unit 5B Briarwood, NY | 1.0 | 1.0 | 500 | $2,600 | $5.20 | 24d | 1 | 0.80mi |
| 13828 Queens Blvd Jamaica, NY | 1.0 | 1.0 | 640 | $2,700 | $4.22 | 19d | 1 | 0.80mi |
| 138-28 Queens Blvd Unit 5G Briarwood, NY | 1.0 | 1.0 | 650 | $2,750 | $4.23 | 24d | 1 | 0.80mi |
| 14160 84th Rd Unit 2G Jamaica, NY | 1.0 | 1.0 | 700 | $2,200 | $3.14 | 14d | 1 | 1.03mi |
| 10919 72nd Rd Unit 6F Forest Hills, NY | 1.0 | 1.0 | 696 | $3,485 | $5.01 | 11d | 1 | 1.10mi |
| 8455 Daniels St Unit 5H Jamaica, NY | 1.0 | 1.0 | 750 | $2,300 | $3.07 | 19d | 1 | 1.13mi |
| 110-19 72nd Rd Unit 1A Forest Hills, NY | — | 1.0 | 500 | $2,395 | $4.79 | 24d | 1 | 1.14mi |
| 11019 72nd Rd Unit 1B Forest Hills, NY | 1.0 | 1.0 | 750 | $3,200 | $4.27 | 14d | 1 | 1.14mi |
| 10825 72nd Ave Forest Hills, NY | 1.0–2.0 | 1.0 | 700 | $3,500 | $5.00 | 5d | 2 | 1.16mi |
| 14112 78th Rd Unit 1G Flushing, NY | 1.0 | 1.0 | 700 | $2,200 | $3.14 | 24d | 1 | 1.18mi |
| 148-16 87th Ave Unit 2 Jamaica, NY | 2.0 | 1.0 | 700 | $2,300 | $3.29 | 17d | 1 | 1.26mi |
| 7837 Main St Unit 2G Queens, NY | 1.0 | 1.0 | 700 | $2,300 | $3.29 | 24d | 1 | 1.30mi |
| 10740 70th Rd Unit 7F Forest Hills, NY | 1.0 | 1.0 | 750 | $2,650 | $3.53 | 24d | 1 | 1.32mi |
| 7835 147th St Unit 2E Flushing, NY | 1.0 | 1.0 | 700 | $2,200 | $3.14 | 6d | 1 | 1.36mi |
| 6820 Selfridge St Unit 3L Forest Hills, NY | — | 1.0 | 500 | $1,900 | $3.80 | 24d | 1 | 1.38mi |
| 14836 89th Ave Unit 3C Jamaica, NY | 1.0 | 1.0 | 673 | $2,900 | $4.31 | 24d | 1 | 1.41mi |
| 14725 94th Ave Jamaica, NY | 1.0 | 1.0 | 525 | $2,825 | $5.38 | 4d | 3 | 1.46mi |
| 15038 Union Tpke Unit 8L Flushing, NY | — | 1.0 | 489 | $2,100 | $4.29 | 22d | 1 | 1.48mi |
| 152-18 Union Tpke Unit 8S Queens, NY | — | 1.0 | 496 | $1,950 | $3.93 | 14d | 1 | 1.50mi |
HOA detail condo
- Monthly dues
- $0 · $0/yr
- Assessments
- None detected in remarks — confirm with the listing agent.
Listing history 12 events
-
2026-06-18days on market $205,999 Active 17 DOM
-
2026-06-17days on market $205,999 Active 16 DOM
-
2026-06-16days on market $205,999 Active 15 DOM
-
2026-06-15days on market $205,999 Active 14 DOM
-
2026-06-13days on market $205,999 Active 12 DOM
-
2026-06-09days on market $205,999 Active 8 DOM
-
2026-06-08days on market $205,999 Active 7 DOM
-
2026-06-08days on market $205,999 Active 6 DOM
-
2026-06-04days on market $205,999 Active 3 DOM
-
2026-06-03days on market $205,999 Active 2 DOM
-
2026-06-02remarks 319-char remark
-
2026-06-02$205,999 Active 1 DOM
ⓘ Source: listings_history table (triggers on properties + properties_extension) + one-shot
backfill from property_details.listing_events for pre-trigger history.
Climate risk First Street
- Flood 1/10 Low FEMA zone X (unshaded) · 0% chance over 30 yrs
- Wildfire 1/10 Low
- Heat 6/10 Major 7 d/yr ≥99°F today · 15 d/yr by 30 yrs out
- Wind 6/10 Major 52% chance of damaging wind over 30 yrs
- Air quality 4/10 Moderate 6 unhealthy d/yr today · 6 by 30 yrs out
Nearby sold comps map
Loading sold comps map…
Walkable amenities ~0.75 mi
Loading nearby amenities…
Taxation est. · year 1
- Rental income
- $28,369
- − Mortgage interest
- −$11,539
- − Property taxes
- −$3,090
- − Insurance
- −$1,030
- − Repairs & maintenance
- −$2,270
- − Management
- −$2,270
- − Depreciation
- −$5,993
- Taxable income
- $2,178
- Est. tax owed @ 24.0%
- −$523
- After-tax cash flow
- $4,805/yr
For passive investors: Depreciation is non-cash, so a rental often shows a tax loss while cash-flowing — sheltering income. Rental losses are passive: they offset passive income freely, and up to $25,000/yr can offset ordinary (W-2) income if you actively participate and your MAGI is under $100k (phasing out to $0 by $150k); unused losses carry forward. On sale, claimed depreciation is recaptured at up to 25%, and gains may owe capital-gains tax (a 1031 exchange can defer both). Figures are a year-1 estimate at your 24.0% rate — not tax advice; consult a CPA.
Schools (NCES district)
No district data.
Livability — New York
- Score
- 75/100
- State rank
- #268
- US rank
- #4188
Category grades
Schools grade is shown separately in the Schools card above.
Census & demographics
- Census place
- New York, NY
- County
- Queens County · 1,914,869 people
- City population
- 7,731,280
- Metro
- New York-Newark-Jersey City, NY-NJ-PA
- Population (ZIP)
- 21,154
- Household income
- $86,394
- Rent vs Own
- Severe rent burden
- 1615.0
Population outlook (Queens County) Hauer SSP2
- Today (2025)
- 2,546,320 people
- By 2030
- 2,643,059 · +3.8%
- By 2040
- 2,815,563 · +10.6%
- By 2050
- 2,944,423 · +15.6%
- By 2075
- 3,123,338 · +22.7%
- By 2100
- 3,098,688 · +21.7%
Race, ethnicity, and origin ACS 2023
- Neighborhood character
- Highly diverse neighborhood (Simpson 0.71)
- Race & ethnicity
- White 43% Hispanic / Latino 25% Asian 20% Two or more races 11% Black 6%
- Hispanic origin (detail)
- Mexican 3% Puerto Rican 5% Dominican 4%
- Common ancestry
- Scotch-Irish 6% Romanian 5% Scandinavian 1%
- Foreign-born
- 38% · Canada, Jamaica, China
- Languages at home
- 45% English-only · Spanish 18% Other Indo-European 12% Russian/Polish/Slavic 10%
Political lean MEDSL · Queens
- 2024 margin
- Strong D (+24.6) · D 62.3% · R 37.7%
- 2008→2024 swing
- -26.2pp toward R · 2008: 50.8pp · 2024: 24.6pp
- All cycles
- 2024: D+24.6 2020: D+45.2 2016: D+53.4 2012: D+58.5 2008: D+50.8
Not yet ingested
- Civics
- —
Market trends
- HPI YoY
- ▼ -155.23%
- Current HPI
- 184.7643
- Rent YoY
- ▲ 1.35%
- Metro
- New York-Newark-Jersey City, NY-NJ-PA
- State GDP YoY
- ▲ 2.60%
- F500 in state
- 92
Industry mix (Fortune 500 HQ in NY)
| Industry | F500 HQs | Revenue |
|---|---|---|
| Financial Services | 10 | $950B |
|
||
| Consumer Goods | 9 | $162B |
|
||
| Insurance | 4 | $225B |
|
||
| Telecommunications | 2 | $144B |
|
||
| Pharmaceuticals | 2 | $112B |
|
||
| Media / Entertainment | 2 | $69B |
|
||
Price history
-15.9% since first listed6 events — show timeline
- 2026-06-01 Listed $205,999 OneKey® MLS as Distributed by MLS Grid
- 2026-05-11 Listing Removed — OneKey® MLS as Distributed by MLS Grid
- 2026-03-29 Price Changed $214,999 OneKey® MLS as Distributed by MLS Grid
- 2025-12-12 Price Changed $225,000 OneKey® MLS as Distributed by MLS Grid
- 2025-11-02 Price Changed $235,000 OneKey® MLS as Distributed by MLS Grid
- 2025-10-07 Listed $245,000 OneKey® MLS as Distributed by MLS Grid
Cash-flow waterfall
monthlySold comps — $/sqft
last 12 mo · ≤1 miLoading sold comps…