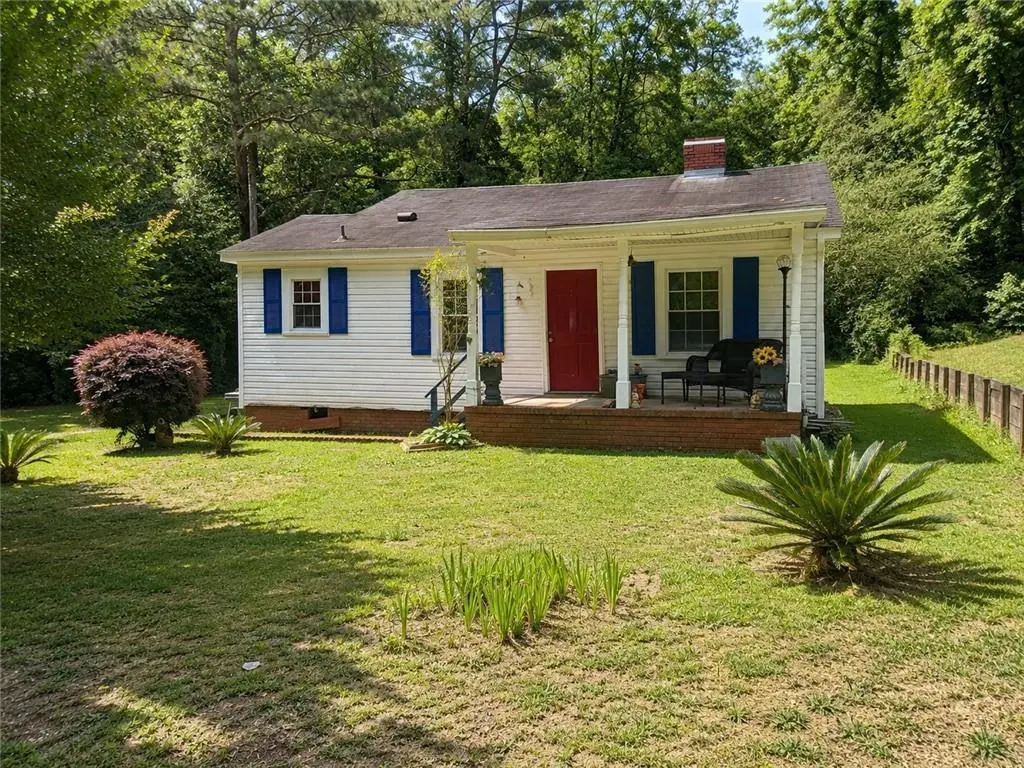
2701 11th Pl · Phenix City, AL
Flood risk 9/10 · Severe
- FEMA flood zone
- X (unshaded)
- Chance of flooding over 30 yrs
- 0.99%
- Est. flood insurance / yr
- $507 – $1,088
Fire risk 3/10 · Minor
- Est. fire insurance / yr
- $916 – $1,700
Heat risk 7/10 · Major
- Hot days now (above 107°F)
- 7 days/yr
- Hot days in 30 yrs
- 19 days/yr
Wind risk 6/10 · Moderate
- Chance of severe wind over 30 yrs
- 76.0%
Air-quality risk 5/10 · Moderate
- Unhealthy air days now
- 7 days/yr
- Unhealthy air days in 30 yrs
- 8 days/yr
Risk factors via First Street. Map © Google.
Why this score? — see what drove the B- grade
The composite is a weighted blend of 9 inputs, each scored 0–100. Each bar is that input's sub-score; the figure is the points it added to the 100-point composite (weight × sub-score).
- Cash flow +30.0/30.0
- 1% rule +10.0/10.0
- DSCR +10.0/10.0
- ARV discount +7.5/15.0
- Livability +3.0/5.0
- Schools +2.7/10.0
- Rent growth +2.6/5.0
- Condition / age +2.5/5.0
- Appreciation +0.0/10.0
$85,000
🖨 Deal sheet 📄 Offer letter ✓ Due diligence
Listing remarks
Tucked away at the dead end of a quiet street near the Ladonia area of Phenix City, this 4 bedroom, 2 bathroom home offers plenty of potential at a price that’s hard to beat. Recent updates include a roof and water heater both replaced within the last 6 years, along with some fresh interior paint completed within the past 6 months. Whether you're looking for your next home or an investment opportunity, this property is priced to sell and ready for its next owner. Home is being sold as-is.
Key facts
- 0.28 acre lot
- Built 1950
- Listed 23 days
Property features AI
Finance
- Other: Residential property (single family); Lot approximately 0.28 acres (160 x 73)
- HOA & community: No community features
Exterior
- Parking: Driveway
- Utilities: Public water; Public sewer; Electricity available; Cable available; Other utilities available
- Home design: Single-family residence; One story / single level; No shared/common walls; Has a view
- Construction: Vinyl siding; Shingle roof; Built with a slab or foundation (basement: none)
- Exterior features: Covered front porch; Covered side porch; Back yard; Cleared, level lot; City street frontage; Asphalt road
Interior
- Bedrooms: Four main-level bedrooms
- Flooring: Other flooring
- Bathrooms: Two full bathrooms, both on the main level
- Heating & cooling: Central heating; Central air conditioning
- Interior features: Other interior features; No fireplace
- Laundry & utility: Laundry area (other features)
Neighborhood map
What this means for you Summary
Snapshot
- This is a 4-bed/2.0-bath single-family listed at $85k.
Deal economics
- At list price, monthly cash flow is $799 ($10k/yr) — positive.
- The deal already cash-flows at list — no discount required.
- Meets the 1% rule at list price ($2k rent vs $85k).
- Recommended offer: $84k (1.5% below list) — sets the bar for market timing.
- Cap rate 18.5% vs local median 5.0% in Phenix City — top-decile yield for the area; either an underpriced asset or a hidden risk that comps aren't pricing in. Stress-test before assuming the spread holds.
Location & tenants
- Location reads 60/100 on livability (#297 in AL) — a middle-class / working-renter tenant base. Strengths: cost of living A+, housing A+; Watch: schools D+, crime F, amenities F.
- Phenix City (suburban): math 22% / reading 44% proficiency, ranked #59 of 129 in AL (top 46%) — families likely to look elsewhere, expect single-tenant / working-renter base with shorter leases; 64% free/reduced lunch — lower-income household profile, screen leases tightly.
- Market conditions: Rents flat; 105 active listings in the ZIP; 3 comparable units currently listed for rent nearby; rentals leasing fast (median 14d on market — plan ~1-2 weeks tenant-placement turnaround); 183 units permitted in Russell County in 2024 (0 in 5+ unit buildings).
- This rent runs 42% of the median local income ($50k/yr) — at the standard rent-burdened threshold; future hikes will face affordability resistance.
Forward outlook
- Local home prices are declining (-3.0%/yr); year-one equity from $588 of loan paydown is wiped out by about $3k of value loss. Plan a longer hold.
- Russell County population projected at +42% by 2050 — long-run rental-demand tailwind backs the buy-and-hold thesis.
- At projected returns (-3.0% appreciation + 0.4% rent growth), your $24k cash investment doubles in ~4 years — after that, you're playing with house money.
Negotiation context
- It's been on market 24 days — a 2% lower offer ($84k) is reasonable based on typical stale-listing flexibility.
- 2 sale attempts; this cycle's ask is 6% above the opening price — seller raised mid-cycle; expect resistance to lowballs.
- Current owner paid $11k; list at $85k implies a 692% gain — meaningful room to come down on a strong offer.
Risks & watch-outs
- Watch-outs: flood insurance adds $66/mo; built in 1950 — expect roof / HVAC / electrical / plumbing capex.
- Climate carrying-cost: severe flood risk; major wind risk, 76% chance of damaging wind over 30y; extreme-heat days projected 7→19/yr by 2055 (HVAC capex compounding) — expect insurance premiums to compound above CPI over the hold.
Questions for the listing agent
- Built in 1950 — when were the roof, HVAC, electrical panel, plumbing, and water heater last replaced?
- What's the actual annual flood-insurance premium (NFIP or private), and is the property in a SFHA with mandatory coverage?
- Is there a deadline driving the sale (1031 exchange, divorce, estate, relocation)? That informs how much negotiation room exists.
- Schools are D-rated, which usually means shorter tenancies and higher turnover. Who's the typical renter profile here, and what's been the actual vacancy rate?
- Crime grade is F in this area — have there been break-ins, vandalism, or insurance claims at this property in the last 3 years? What carrier currently insures it and at what premium?
- What's the average days-on-market for RENTAL listings here right now (not sales)? A rising rental-DOM trend means longer vacancies and softer asking-rent achievability than the comps imply.
- What's the recent tenant-quality profile in this submarket — average credit score on applications, eviction rate, late-payment / NSF rate, and stable-employment percentage? A property-management company in the area should have these aggregated.
- How much new for-sale + rental construction is in the pipeline within 1–3 miles? Heavy new supply typically softens prices + rents 12–24 months out; constrained supply supports both.
Investment metrics
- 1% rule
- 2.07% ✓
- Cap rate
- 18.50%
- Cash-on-cash
- 43.61%
- DSCR
- 2.94
- GRM
- 4.0
CMA / ARV
- ARV (on-the-fly)
- $202,860
- Comps found
- 12
Show comp detail 12 sales within ~0.75 mi
| Address | Dist | Beds/Ba | Sqft | Sold | Price | $/sf | Match |
|---|---|---|---|---|---|---|---|
| 1116 28th Ave Ave | 0.12mi | 3/2.0 (-1) | 1,594 (+8%) | 3mo | $199,900 | $125 | 73 |
| 1312 Ingersoll Dr | 0.56mi | 3/2.5 (-1) | 1,516 (+3%) | 2mo | $249,900 | $165 | 60 |
| 1308 Ingersoll Dr | 0.54mi | 3/2.0 (-1) | 1,299 (-12%) | 1mo | $199,000 | $153 | 50 |
| 706 27th Ave | 0.57mi | 3/2.0 (-1) | 1,588 (+8%) | 10mo | $140,000 | $88 | 46 |
| 1307 Ingersoll Dr | 0.46mi | 3/2.0 (-1) | 1,343 (-9%) | 15mo | $185,000 | $138 | 46 |
| 721 Pine Hill Ct | 0.54mi | 3/2.0 (-1) | 1,348 (-8%) | 12mo | $120,000 | $89 | 46 |
| 710 Pine Hill Ct | 0.59mi | 3/2.0 (-1) | 1,416 (-4%) | 20mo | $85,400 | $60 | 44 |
| 2714 8th St | 0.51mi | 3/2.0 (-1) | 1,359 (-8%) | 18mo | $164,000 | $121 | 44 |
| 1309 Ingersoll Dr | 0.47mi | 3/2.0 (-1) | 1,358 (-8%) | 20mo | $179,900 | $132 | 43 |
| 1304 Ingersoll Dr | 0.53mi | 3/2.0 (-1) | 1,285 (-13%) | 11mo | $215,000 | $167 | 41 |
| 703 Williams Ave | 0.73mi | 3/2.5 (-1) | 1,560 (+6%) | 21mo | $239,900 | $154 | 32 |
| 705 Williams Ave | 0.71mi | 3/2.5 (-1) | 1,560 (+6%) | 22mo | $239,900 | $154 | 31 |
Match score weights: distance 35% · size 25% · config 20% · recency 20%. Top-matched comps best support the ARV.
Projected returns pro-forma
-3.0% appreciation · 0.43% rent growth · sell at horizon
- IRR
- 33.7%
- Equity multiple
- 2.37×
- Total profit
- $32,676
- Equity at exit
- $12,674
- IRR
- 39.2%
- Equity multiple
- 4.23×
- Total profit
- $76,768
- Equity at exit
- $7,349
Cash invested: $23,800 (down + closing). Projections, not guarantees.
Landlord ↔ Tenant lean methodology
- Overall (STATE)
- 90 Strongly Landlord-Friendly
- State Alabama
- 90 Strongly Landlord-Friendly · R+15
- County
- — inherits STATE
- City
- — inherits STATE
ZIP-level market 36869
- Home prices YoY
- -22.2%
- Rents YoY
- 0.4%
- Active inventory
- 105
- Price-to-rent
- 4.0×
Monthly cashflow live
- Estimated rent
- $1,760 medium interval (Pro) →
- Mortgage (P&I)
- −$446
- Tax from tax record
- −$44 /mo · $528/yr
- Insurance
- −$35
- Flood insurance flood zone
- −$66 /mo · $798/yr
- HOA
- −$0
- Vacancy / Maint / Mgmt
- −$370
- Net cashflow
- $799
Break-even live
UW: 25.0% down · 7.5% · 30yr · 1.5% tax · 5.0% vac · 8.0% maint · 8.0% mgmt
Financing live
Cash to close
- Down payment
- $21,250
- Closing costs
- $2,550
- Reserves months
- —
- Total cash needed
- —
Loan-product check · same deal, 3 products live
Conventional
25% down · 7.5% · 30yr
- Down + closing
- —
- Monthly P&I
- —
- Monthly cashflow
- —
- DSCR
- —
- Eligible?
- —
Personal DTI + credit; lowest rate.
DSCR
20% down · 8.5% · 30yr
- Down + closing
- —
- Monthly P&I
- —
- Monthly cashflow
- —
- DSCR
- —
- Eligible?
- —
No personal income docs; deal must DSCR.
Hard money
10% down · 12.0% · 12mo
- Down + closing
- —
- Monthly P&I
- —
- Monthly cashflow
- —
- DSCR
- —
- Eligible?
- —
Short-term bridge; refi at stabilization.
Rent comps 3 comps
| Address | Beds | Baths | Sqft | Rent | $/sqft | DOM | Units | Dist |
|---|---|---|---|---|---|---|---|---|
| 1346 Ingersoll Dr Phenix City, AL | 3.0 | 2.0 | 1453 | $1,700 | $1.17 | 13d | 1 | 0.66mi |
| 651 Builder Dr Phenix City, AL | 4.0 | 2.0 | 1415 | $1,750 | $1.24 | 21d | 1 | 0.73mi |
| 414 21st Ave Phenix City, AL | 3.0 | 1.0 | 1080 | $1,250 | $1.16 | 13d | 1 | 1.14mi |
Listing history 8 events
-
2026-06-01days on market $85,000 Active 24 DOM
-
2026-05-31days on market $85,000 Active 23 DOM
-
2026-05-30days on market $85,000 Active 22 DOM
-
2026-05-09price $85,000
-
2026-05-08$80,000 Active
-
2025-03-01price $125,500
-
2025-02-14$165,500 Active
-
1983-11-26soldstatus $10,731
ⓘ Source: listings_history table (triggers on properties + properties_extension) + one-shot
backfill from property_details.listing_events for pre-trigger history.
Tax reassessment forecast AL · Resets to sale price
- Current annual tax
- $528 · $44/mo
- Projected year-2 tax
- $528 · $44/mo
- Expected delta
- $0/yr ($0/mo · 0.0%)
ⓘ Screening estimate from a state-policy table — verify with the county assessor before closing.
Climate risk First Street
- Flood 9/10 Extreme FEMA zone X (unshaded) · 99% chance over 30 yrs
- Wildfire 3/10 Moderate
- Heat 7/10 Severe 7 d/yr ≥107°F today · 19 d/yr by 30 yrs out
- Wind 6/10 Major 76% chance of damaging wind over 30 yrs
- Air quality 5/10 Major 7 unhealthy d/yr today · 8 by 30 yrs out
Nearby sold comps map
Loading sold comps map…
Walkable amenities ~0.75 mi
Loading nearby amenities…
Taxation est. · year 1
- Rental income
- $21,116
- − Mortgage interest
- −$4,761
- − Property taxes
- −$528
- − Insurance
- −$1,222
- − Repairs & maintenance
- −$1,689
- − Management
- −$1,689
- − Depreciation
- −$2,473
- Taxable income
- $8,753
- Est. tax owed @ 24.0%
- −$2,101
- After-tax cash flow
- $7,481/yr
For passive investors: Depreciation is non-cash, so a rental often shows a tax loss while cash-flowing — sheltering income. Rental losses are passive: they offset passive income freely, and up to $25,000/yr can offset ordinary (W-2) income if you actively participate and your MAGI is under $100k (phasing out to $0 by $150k); unused losses carry forward. On sale, claimed depreciation is recaptured at up to 25%, and gains may owe capital-gains tax (a 1031 exchange can defer both). Figures are a year-1 estimate at your 24.0% rate — not tax advice; consult a CPA.
Schools (NCES district)
- District
- Phenix City
- NCES district ID
- 0102700
- Math proficiency
- 22% ▼ -24.00%
- Reading proficiency
- 44% ▼ -1.00%
- Median HH income
- $36,228
- Composite
- 27.29/100
- National rank
- #7001
- State rank
- #59 of 129 in AL
Livability — Phenix City
- Score
- 60/100
- State rank
- #297
- US rank
- #19037
Category grades
Schools grade is shown separately in the Schools card above.
Census & demographics
- Census place
- Phenix City, AL
- County
- Russell County · 53,055 people
- City population
- 62,290
- Metro
- Columbus, GA-AL
- Population (ZIP)
- 21,518
- Household income
- $50,061
- Rent vs Own
- Severe rent burden
- 789.0
Population outlook (Russell County) Hauer SSP2
- Today (2025)
- 70,137 people
- By 2030
- 75,826 · +8.1%
- By 2040
- 87,858 · +25.3%
- By 2050
- 99,721 · +42.2%
- By 2075
- 128,009 · +82.5%
- By 2100
- 149,251 · +112.8%
Race, ethnicity, and origin ACS 2023
- Neighborhood character
- Diverse neighborhood (Simpson 0.58)
- Race & ethnicity
- Black 50% White 41% Hispanic / Latino 5% Two or more races 4%
- Common ancestry
- Slovak 1% Lithuanian 1% Portuguese 1%
- Foreign-born
- 3% · Canada
- Languages at home
- 95% English-only · Spanish 4%
Political lean MEDSL · Russell
- 2024 margin
- Toss-up / Even · D 50.4% · R 48.7%
- 2008→2024 swing
- -5.6pp toward R · 2008: 7.3pp · 2024: 1.7pp
- All cycles
- 2024: D+1.7 2020: D+6.4 2016: D+1.9 2012: D+11.8 2008: D+7.3
Not yet ingested
- Civics
- —
Market trends
- HPI YoY
- ▼ -47.69%
- Current HPI
- 166.9094
- Rent YoY
- ▲ 0.43%
- Metro
- Columbus, GA-AL
- State GDP YoY
- ▲ 2.94%
- F500 in state
- 4
Industry mix (Fortune 500 HQ in AL)
| Industry | F500 HQs | Revenue |
|---|---|---|
| Financial Services | 1 | $8B |
|
||
| Healthcare | 1 | $5B |
|
||
Price history
+692.1% since first listed5 events — show timeline
- 2026-05-09 Price Changed $85,000 EABOR
- 2026-05-08 Listed $80,000 EABOR
- 2025-03-01 Price Changed $125,500 VMLS
- 2025-02-14 Listed $165,500 VMLS
- 1983-11-26 Sold (Public Records) $10,731 Public Records
Property tax history
-1.8%/yrLatest (2025): $528 · +8.0% YoY. Source: county tax records.
Cash-flow waterfall
monthlySold comps — $/sqft
last 12 mo · ≤1 miLoading sold comps…