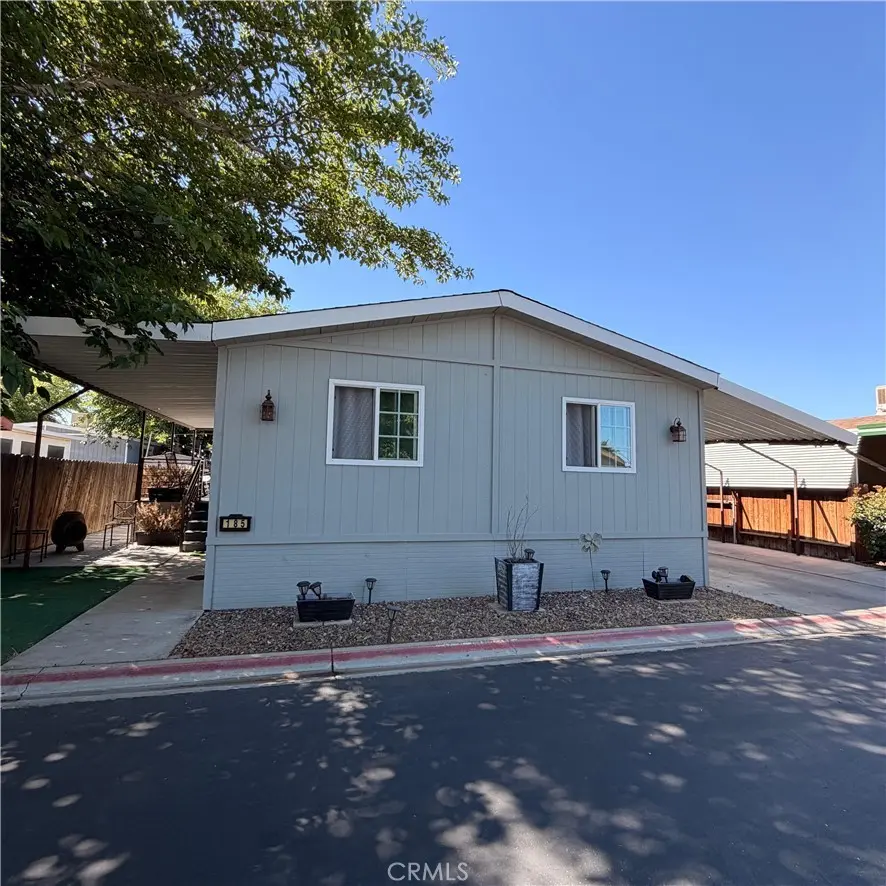
3524 E Avenue R #185 · Palmdale, CA
Flood risk 1/10 · Minimal
- FEMA flood zone
- X (shaded)
- Chance of flooding over 30 yrs
- 0.0%
- Est. flood insurance / yr
- $507 – $1,088
Fire risk 7/10 · Major
- Est. fire insurance / yr
- $659 – $1,223
Heat risk 6/10 · Moderate
- Hot days now (above 100°F)
- 2 days/yr
- Hot days in 30 yrs
- 5 days/yr
Wind risk 1/10 · Minimal
- Chance of severe wind over 30 yrs
- —
Air-quality risk 10/10 · Severe
- Unhealthy air days now
- 25 days/yr
- Unhealthy air days in 30 yrs
- 29 days/yr
Risk factors via First Street. Map © Google.
Why this score? — see what drove the C+ grade
The composite is a weighted blend of 9 inputs, each scored 0–100. Each bar is that input's sub-score; the figure is the points it added to the 100-point composite (weight × sub-score).
- Cash flow +30.0/30.0
- 1% rule +10.0/10.0
- DSCR +10.0/10.0
- Condition / age +4.0/5.0
- Rent growth +2.9/5.0
- Livability +2.8/5.0
- Schools +2.5/10.0
- ARV discount +0.0/15.0
- Appreciation +0.0/10.0
$185,000
🖨 Deal sheet 📄 Offer letter ✓ Due diligence
Key facts
- 3 garage spots
- Community pool
- Built 1984
Property features AI
Finance
- HOA & community: Part of an association; Community amenities include dog park, street lighting, sidewalks, suburban setting; Land lease (monthly)
Exterior
- Parking: 3 covered carport spaces; 3 garage spaces (total 6 parking spaces); Located in Sagetree Village Manufactured Home park
- Utilities: Public sewer; District/Public water
- Home design: Single-story home; Mobile home remains (24 x 60)
- Construction: Year built per public records
- Exterior features: Association pool; Paved lot; Front yard
Interior
- Bathrooms: 2 full bathrooms
- Heating & cooling: Central cooling; Central furnace heating
- Interior features: Main-level entry
- Laundry & utility: Laundry inside; Washer hookup; Gas dryer hookup; Gas and electric dryer hookup
Neighborhood map
What this means for you Summary
Snapshot
- This is a 3-bed/2.0-bath manufactured listed at $185k. Condition is rated good.
Deal economics
- At list price, monthly cash flow is $1k ($15k/yr) — positive.
- The deal already cash-flows at list — no discount required.
- Meets the 1% rule at list price ($3k rent vs $185k).
- Recommended offer: $179k (3.0% below list) — sets the bar for market timing.
- Cap rate 14.2% vs local median 4.5% in Palmdale — top-decile yield for the area; either an underpriced asset or a hidden risk that comps aren't pricing in. Stress-test before assuming the spread holds.
Location & tenants
- Location reads 55/100 on livability (#861 in CA) — a working-class tenant base; expect higher turnover. Strengths: housing A+; Watch: schools F, crime F, amenities F.
- Palmdale Elementary (suburban): math 20% / reading 31% proficiency, ranked #1,147 of 1,400 in CA (top 82%) — low school quality limits family demand, transient renter base, plan for 1-2y turnover; 69% free/reduced lunch — lower-income household profile, screen leases tightly.
- Market conditions: Rents rising (+1.8%/yr); 410 active listings in the ZIP; 13 comparable units currently listed for rent nearby; rentals leasing fast (median 1d on market — plan ~1-2 weeks tenant-placement turnaround); 19,697 units permitted in Los Angeles County in 2024 (9,426 in 5+ unit buildings).
- At $2,919/mo this rent would consume 56% of the median local household income ($62k/yr) (locally 4384% of renters already pay >50% of income on rent) — very limited rent-growth headroom before tenants either downsize or default.
Forward outlook
- Local home prices are declining (-3.0%/yr); year-one equity from $1k of loan paydown is wiped out by about $6k of value loss. Plan a longer hold.
- Los Angeles County population projected at +9% by 2050 — modest demand growth; plan on rents tracking national, not racing it.
- At projected returns (-3.0% appreciation + 1.8% rent growth), your $52k cash investment doubles in ~5 years — after that, you're playing with house money.
Negotiation context
- It's been on market 43 days — a 3% lower offer ($179k) is reasonable based on typical stale-listing flexibility.
Risks & watch-outs
- Climate carrying-cost: major wildfire risk; extreme-heat days projected 2→5/yr by 2055 (HVAC capex compounding) — expect insurance premiums to compound above CPI over the hold.
Questions for the listing agent
- It's been on market 43 days. Have you received any prior offers? Is the seller open to a 3% concession, seller financing, or rate buy-down credit?
- Is there a deadline driving the sale (1031 exchange, divorce, estate, relocation)? That informs how much negotiation room exists.
- Schools are F-rated, which usually means shorter tenancies and higher turnover. Who's the typical renter profile here, and what's been the actual vacancy rate?
- Crime grade is F in this area — have there been break-ins, vandalism, or insurance claims at this property in the last 3 years? What carrier currently insures it and at what premium?
- What's the average days-on-market for RENTAL listings here right now (not sales)? A rising rental-DOM trend means longer vacancies and softer asking-rent achievability than the comps imply.
- What's the recent tenant-quality profile in this submarket — average credit score on applications, eviction rate, late-payment / NSF rate, and stable-employment percentage? A property-management company in the area should have these aggregated.
- How much new for-sale + rental construction is in the pipeline within 1–3 miles? Heavy new supply typically softens prices + rents 12–24 months out; constrained supply supports both.
Investment metrics
- 1% rule
- 1.58% ✓
- Cap rate
- 14.23%
- Cash-on-cash
- 28.35%
- DSCR
- 2.26
- GRM
- 5.3
CMA / ARV
- ARV (on-the-fly)
- $139,680
- Comps found
- 12
Show comp detail 12 sales within ~0.75 mi
| Address | Dist | Beds/Ba | Sqft | Sold | Price | $/sf | Match |
|---|---|---|---|---|---|---|---|
| 3524 E Avenue R #226 | 0.00mi | 3/2.0 | 1,344 (-7%) | 1mo | $120,000 | $89 | 88 |
| 3524 E Avenue R #202 | 0.00mi | 3/2.0 | 1,344 (-7%) | 2mo | $155,000 | $115 | 87 |
| 3524 E Avenue R SPC 310 | 0.00mi | 3/2.0 | 1,344 (-7%) | 3mo | $165,000 | $123 | 86 |
| 3524 E Avenue R #297 | 0.00mi | 4/2.0 (+1) | 1,344 (-7%) | 1mo | $100,000 | $74 | 83 |
| 3255 E Avenue R #269 | 0.33mi | 3/2.0 | 1,440 (0%) | 5mo | $139,000 | $97 | 81 |
| 3524 E Avenue R Spc 327 | 0.00mi | 4/2.0 (+1) | 1,344 (-7%) | 6mo | $178,500 | $133 | 79 |
| 3524 E Avenue R #236 | 0.00mi | 4/2.0 (+1) | 1,344 (-7%) | 7mo | $170,000 | $126 | 78 |
| 3524 E Avenue R Spc 243 | 0.00mi | 3/2.0 | 1,248 (-13%) | 0mo | $154,000 | $123 | 78 |
| 3255 E Avenue R | 0.36mi | 2/2.0 (-1) | 1,440 (0%) | 5mo | $139,000 | $97 | 74 |
| 3524 East Ave #6 | 0.11mi | 3/2.0 | 1,272 (-12%) | 7mo | $105,000 | $83 | 70 |
| 3524 E Ave R #6 | 0.13mi | 3/2.0 | 1,272 (-12%) | 7mo | $105,000 | $83 | 68 |
| 3255 E Avenue R #73 | 0.31mi | 4/2.0 (+1) | 1,290 (-10%) | 7mo | $109,900 | $85 | 58 |
Match score weights: distance 35% · size 25% · config 20% · recency 20%. Top-matched comps best support the ARV.
Projected returns pro-forma
-3.0% appreciation · 1.76% rent growth · sell at horizon
- IRR
- 21.3%
- Equity multiple
- 1.86×
- Total profit
- $44,303
- Equity at exit
- $27,584
- IRR
- 28.6%
- Equity multiple
- 3.40×
- Total profit
- $124,248
- Equity at exit
- $15,995
Cash invested: $51,800 (down + closing). Projections, not guarantees.
Landlord ↔ Tenant lean methodology
- Overall (STATE)
- 18 Strongly Tenant-Friendly
- State California
- 18 Strongly Tenant-Friendly · D+13
- County
- — inherits STATE
- City
- — inherits STATE
ZIP-level market 93550
- Home prices YoY
- -29.4%
- Rents YoY
- 1.8%
- Active inventory
- 410
- Price-to-rent
- 5.3×
Monthly cashflow live
- Estimated rent
- $2,919 high interval (Pro) →
- Mortgage (P&I)
- −$970
- Tax from tax record
- −$35 /mo · $421/yr
- Insurance
- −$77
- HOA
- −$0
- Vacancy / Maint / Mgmt
- −$613
- Net cashflow
- $1,224
Break-even live
UW: 25.0% down · 7.5% · 30yr · 1.5% tax · 5.0% vac · 8.0% maint · 8.0% mgmt
Financing live
Cash to close
- Down payment
- $46,250
- Closing costs
- $5,550
- Reserves months
- —
- Total cash needed
- —
Loan-product check · same deal, 3 products live
Conventional
25% down · 7.5% · 30yr
- Down + closing
- —
- Monthly P&I
- —
- Monthly cashflow
- —
- DSCR
- —
- Eligible?
- —
Personal DTI + credit; lowest rate.
DSCR
20% down · 8.5% · 30yr
- Down + closing
- —
- Monthly P&I
- —
- Monthly cashflow
- —
- DSCR
- —
- Eligible?
- —
No personal income docs; deal must DSCR.
Hard money
10% down · 12.0% · 12mo
- Down + closing
- —
- Monthly P&I
- —
- Monthly cashflow
- —
- DSCR
- —
- Eligible?
- —
Short-term bridge; refi at stabilization.
Rent comps 13 comps
| Address | Beds | Baths | Sqft | Rent | $/sqft | DOM | Units | Dist |
|---|---|---|---|---|---|---|---|---|
| 37347 Waterman Ave Palmdale, CA | 3.0 | 2.0 | 1383 | $3,350 | $2.42 | 1d | 1 | 0.66mi |
| 3559 E Avenue R14 Palmdale, CA | 4.0 | 2.5 | 1483 | $2,895 | $1.95 | 1d | 1 | 0.75mi |
| 4206 East Avenue Q-14 Unit Q14 Palmdale, CA | 3.0 | 2.0 | 1150 | $2,850 | $2.48 | 1d | 1 | 0.75mi |
| 38532 33rd St E Palmdale, CA | 4.0 | 2.0 | 1157 | $2,646 | $2.29 | 1d | 1 | 0.84mi |
| 38527 Pond Ave Palmdale, CA | 4.0 | 2.0 | 1300 | $3,200 | $2.46 | 1d | 1 | 0.87mi |
| 37333 Scranton Ct Palmdale, CA | 3.0 | 2.0 | 1756 | $2,850 | $1.62 | 24d | 1 | 0.92mi |
| 3138 E Avenue Q4 Palmdale, CA | 4.0 | 2.0 | 1318 | $2,646 | $2.01 | 1d | 1 | 0.96mi |
| 38638 31st St E Palmdale, CA | 4.0 | 2.0 | 1186 | $2,700 | $2.28 | 10d | 1 | 1.07mi |
| 4636 Blue Ridge Ave Palmdale, CA | 3.0 | 2.0 | 1526 | $3,000 | $1.97 | 24d | 1 | 1.16mi |
| 38121 25th St E Palmdale, CA | 1.0–2.0 | 1.0–2.0 | 840 | $2,100 | $2.50 | 1d | 7 | 1.20mi |
| 37526 Rose St Palmdale, CA | 3.0 | 2.0 | 1361 | $3,150 | $2.31 | 1d | 1 | 1.25mi |
| 38659 Angele Trumpet Ct Palmdale, CA | 3.0 | 2.0 | 1453 | $2,950 | $2.03 | 1d | 1 | 1.28mi |
| 36935 26th St E Palmdale, CA | 4.0 | 2.0 | 1530 | $2,300 | $1.50 | 6d | 1 | 1.35mi |
Listing history 15 events
-
2026-06-18days on market $185,000 Active 43 DOM
-
2026-06-17days on market $185,000 Active 42 DOM
-
2026-06-16days on market $185,000 Active 41 DOM
-
2026-06-15days on market $185,000 Active 40 DOM
-
2026-06-13days on market $185,000 Active 38 DOM
-
2026-06-13days on market $185,000 Active 37 DOM
-
2026-06-09days on market $185,000 Active 34 DOM
-
2026-06-08days on market $185,000 Active 33 DOM
-
2026-06-07days on market $185,000 Active 32 DOM
-
2026-06-04days on market $185,000 Active 29 DOM
-
2026-06-03days on market $185,000 Active 28 DOM
-
2026-06-02days on market $185,000 Active 27 DOM
-
2026-06-01days on market $185,000 Active 26 DOM
-
2026-05-31days on market $185,000 Active 25 DOM
-
2026-05-06$185,000 Active
ⓘ Source: listings_history table (triggers on properties + properties_extension) + one-shot
backfill from property_details.listing_events for pre-trigger history.
Tax reassessment forecast CA · Resets to sale price
- Current annual tax
- $421 · $35/mo
- Projected year-2 tax
- $1,406 · $117/mo
- Expected delta
- +$985/yr (+$82/mo · 234.3%)
ⓘ Screening estimate from a state-policy table — verify with the county assessor before closing.
Climate risk First Street
- Flood 1/10 Low FEMA zone X (shaded) · 0% chance over 30 yrs
- Wildfire 7/10 Severe
- Heat 6/10 Major 2 d/yr ≥100°F today · 5 d/yr by 30 yrs out
- Wind 1/10 Low
- Air quality 10/10 Extreme 25 unhealthy d/yr today · 29 by 30 yrs out
Nearby sold comps map
Loading sold comps map…
Walkable amenities ~0.75 mi
Loading nearby amenities…
Taxation est. · year 1
- Rental income
- $35,032
- − Mortgage interest
- −$10,363
- − Property taxes
- −$421
- − Insurance
- −$925
- − Repairs & maintenance
- −$2,803
- − Management
- −$2,803
- − Depreciation
- −$5,382
- Taxable income
- $12,337
- Est. tax owed @ 24.0%
- −$2,961
- After-tax cash flow
- $11,727/yr
For passive investors: Depreciation is non-cash, so a rental often shows a tax loss while cash-flowing — sheltering income. Rental losses are passive: they offset passive income freely, and up to $25,000/yr can offset ordinary (W-2) income if you actively participate and your MAGI is under $100k (phasing out to $0 by $150k); unused losses carry forward. On sale, claimed depreciation is recaptured at up to 25%, and gains may owe capital-gains tax (a 1031 exchange can defer both). Figures are a year-1 estimate at your 24.0% rate — not tax advice; consult a CPA.
Condition & rehab AI · 12 photos
This home is in good condition with modern updates and a well-maintained exterior. It is ready for a new owner or tenant.
Value-add opportunities
- Both Painting exterior and interior walls — Fresh paint can enhance curb appeal and interior aesthetics
- Both Landscaping improvements — A well-maintained yard can increase both resale and rental value
- Both Add smart home features — Modern technology can increase both resale and rental value
Renovation cost estimate screening
Value-add ROI direction
- Both Painting exterior and interior walls — Fresh paint can enhance curb appeal and interior aesthetics ↑
- Both Landscaping improvements — A well-maintained yard can increase both resale and rental value ↑
- Both Add smart home features — Modern technology can increase both resale and rental value ↑
ⓘ Cost ranges are severity-bucket heuristics (US national rule-of-thumb). Get contractor quotes + a written scope before underwriting a rehab budget.
Schools (NCES district)
- District
- Palmdale Elementary
- NCES district ID
- 0629580
- Math proficiency
- 20% ▲ 1.00%
- Reading proficiency
- 31% ▲ 1.00%
- Median HH income
- $48,652
- Composite
- 25.34/100
- National rank
- #12888
- State rank
- #1147 of 1400 in CA
Livability — Palmdale
- Score
- 55/100
- State rank
- #861
- US rank
- #23501
Category grades
Schools grade is shown separately in the Schools card above.
Census & demographics
- Census place
- Palmdale, CA
- County
- Los Angeles County · 9,444,647 people
- City population
- 177,644
- Metro
- Los Angeles-Long Beach-Anaheim, CA
- Population (ZIP)
- 80,645
- Household income
- $62,078
- Rent vs Own
- Severe rent burden
- 4384.0
Population outlook (Los Angeles County) Hauer SSP2
- Today (2025)
- 10,940,515 people
- By 2030
- 11,256,481 · +2.9%
- By 2040
- 11,729,929 · +7.2%
- By 2050
- 11,948,407 · +9.2%
- By 2075
- 11,818,114 · +8.0%
- By 2100
- 10,842,928 · -0.9%
Race, ethnicity, and origin ACS 2023
- Neighborhood character
- Predominantly Hispanic (69%)
- Race & ethnicity
- Hispanic / Latino 69% Two or more races 15% Black 14% White 12% Asian 3% Native American 2%
- Hispanic origin (detail)
- Mexican 52%
- Foreign-born
- 26% · Canada
- Languages at home
- 42% English-only · Spanish 55% Tagalog/Filipino 1% Other Asian/Pacific 1%
Political lean MEDSL · Los Angeles
- 2024 margin
- Solid D (+32.9) · D 64.8% · R 31.9% · Other 3.3%
- 2008→2024 swing
- -7.4pp toward R · 2008: 40.4pp · 2024: 32.9pp
- All cycles
- 2024: D+32.9 2020: D+44.2 2016: D+48.0 2012: D+40.0 2008: D+40.4
Not yet ingested
- Civics
- —
Market trends
- HPI YoY
- ▼ -183.38%
- Current HPI
- 440.8844
- Rent YoY
- ▲ 1.76%
- Metro
- Los Angeles-Long Beach-Anaheim, CA
- State GDP YoY
- ▲ 3.21%
- F500 in state
- 116
Industry mix (Fortune 500 HQ in CA)
| Industry | F500 HQs | Revenue |
|---|---|---|
| Technology | 27 | $1,492B |
|
||
| Financial Services | 3 | $174B |
|
||
| Retail | 3 | $44B |
|
||
| Insurance | 3 | $26B |
|
||
| Media / Entertainment | 2 | $115B |
|
||
| Pharmaceuticals / Biotech | 2 | $62B |
|
||
Price history
1 event — show timeline
- 2026-05-06 Listed $185,000 CRMLS
Property tax history
+6.7%/yrLatest (2025): $421 · +6.7% YoY. Source: county tax records.
Cash-flow waterfall
monthlySold comps — $/sqft
last 12 mo · ≤1 miLoading sold comps…