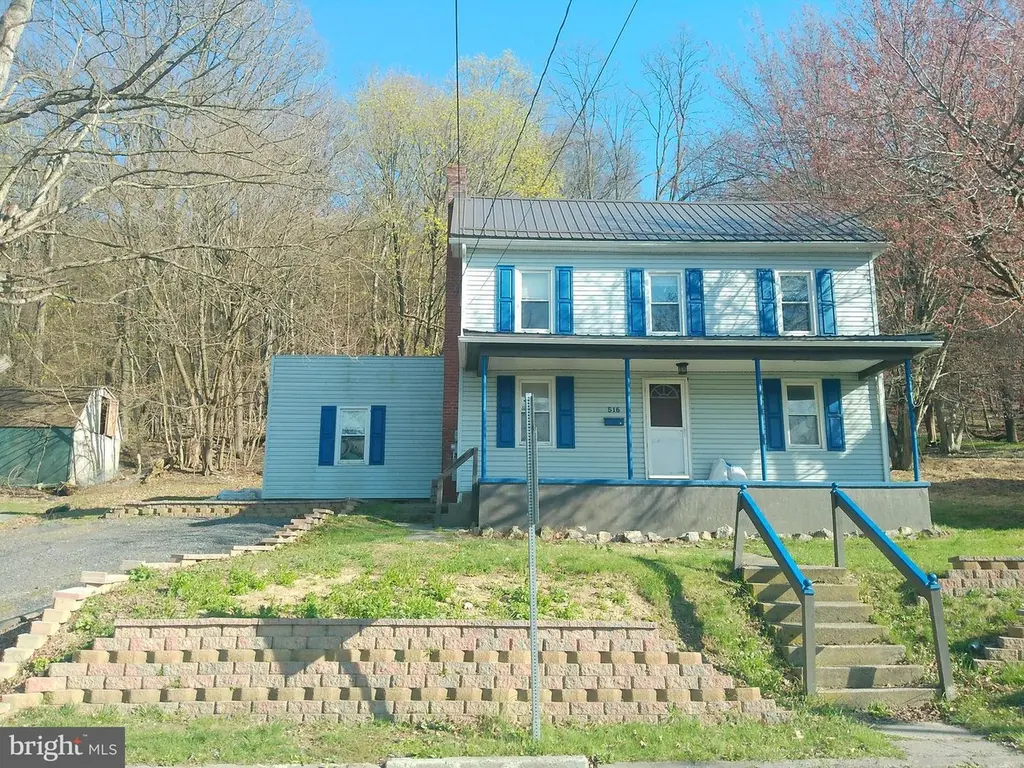
516 Highland Ave · Burnham, PA
Flood risk 1/10 · Minimal
- FEMA flood zone
- X (unshaded)
- Chance of flooding over 30 yrs
- 0.0%
- Est. flood insurance / yr
- $507 – $1,088
Fire risk 3/10 · Minor
- Est. fire insurance / yr
- $511 – $949
Heat risk 3/10 · Minor
- Hot days now (above 95°F)
- 7 days/yr
- Hot days in 30 yrs
- 16 days/yr
Wind risk 2/10 · Minimal
- Chance of severe wind over 30 yrs
- —
Air-quality risk 2/10 · Minimal
- Unhealthy air days now
- 0 days/yr
- Unhealthy air days in 30 yrs
- 1 days/yr
Risk factors via First Street. Map © Google.
Why this score? — see what drove the A- grade
The composite is a weighted blend of 9 inputs, each scored 0–100. Each bar is that input's sub-score; the figure is the points it added to the 100-point composite (weight × sub-score).
- Cash flow +30.0/30.0
- ARV discount +15.0/15.0
- DSCR +10.0/10.0
- Appreciation +9.2/10.0
- 1% rule +8.3/10.0
- Livability +3.6/5.0
- Schools +3.2/10.0
- Rent growth +2.5/5.0
- Condition / age +2.5/5.0
$140,000
🖨 Deal sheet 📄 Offer letter ✓ Due diligence
Listing remarks MLS
Step inside this new Burnham listing! Many possibilities are available with this 2-3 bedroom home. First floor features a living, dining, kitchen, remodeled full bath and a flex addition. Make it a bedroom, office or family room! Second floor features 2-3 bedrooms. Make one a bedroom with a walk-in closet, nursery, play room, the options are endless! Outside you will get a breath of fresh air as the rear yard boasts room for kids or pets. Off street parking recently added.
Key facts
- 0.49 acre lot
- 2 parking spots
- Built 1930
Neighborhood map
What this means for you Summary
Snapshot
- This is a 3-bed/1.0-bath other listed at $140k.
Deal economics
- At list price, monthly cash flow is $563 ($7k/yr) — positive.
- The deal already cash-flows at list — no discount required.
- Meets the 1% rule at list price ($2k rent vs $140k).
- Recommended offer: $136k (3.0% below list) — sets the bar for market timing.
Location & tenants
- Location reads 72/100 on livability (#634 in PA) — a middle-class / working-renter tenant base. Strengths: crime A+, cost of living A+, housing A+; Watch: schools F, amenities F, commute F.
- Mifflin County SD (town): math 28% / reading 49% proficiency, ranked #380 of 539 in PA (top 70%) — families likely to look elsewhere, expect single-tenant / working-renter base with shorter leases.
- Market conditions: 14 active listings in the ZIP; 58 units permitted in Mifflin County in 2024 (0 in 5+ unit buildings).
Forward outlook
- In year one you build about $13k of equity ($968 loan paydown + $12k appreciation (8.3% local appreciation)).
- Mifflin County population projected at -18% by 2050 — secular population decline; favor cash flow + early exit over multi-decade hold.
- At projected returns (8.3% appreciation + 3.0% rent growth), your $39k cash investment doubles in ~2 years — after that, you're playing with house money.
- By year 3, paydown + projected appreciation supports a ~$32k cash-out refi (75% LTV) — recoverable capital for the next deal without selling this one.
Negotiation context
- It's been on market 53 days — a 3% lower offer ($136k) is reasonable based on typical stale-listing flexibility.
- 5 sale attempts since 18y ago with the ask held roughly flat each time — persistent listings suggest the price (not the market) is what's stuck; bring a comps-based counter.
- Current owner paid $65k; list at $140k implies a 116% gain — meaningful room to come down on a strong offer.
Risks & watch-outs
- Watch-outs: built in 1930 — expect roof / HVAC / electrical / plumbing capex.
Questions for the listing agent
- It's been on market 53 days. Have you received any prior offers? Is the seller open to a 3% concession, seller financing, or rate buy-down credit?
- Built in 1930 — when were the roof, HVAC, electrical panel, plumbing, and water heater last replaced?
- Is there a deadline driving the sale (1031 exchange, divorce, estate, relocation)? That informs how much negotiation room exists.
- Schools are F-rated, which usually means shorter tenancies and higher turnover. Who's the typical renter profile here, and what's been the actual vacancy rate?
- What's the average days-on-market for RENTAL listings here right now (not sales)? A rising rental-DOM trend means longer vacancies and softer asking-rent achievability than the comps imply.
- What's the recent tenant-quality profile in this submarket — average credit score on applications, eviction rate, late-payment / NSF rate, and stable-employment percentage? A property-management company in the area should have these aggregated.
- How much new for-sale + rental construction is in the pipeline within 1–3 miles? Heavy new supply typically softens prices + rents 12–24 months out; constrained supply supports both.
Investment metrics
- 1% rule
- 1.33% ✓
- Cap rate
- 11.12%
- Cash-on-cash
- 17.23%
- DSCR
- 1.77
- GRM
- 6.3
CMA / ARV
- ARV (median comp)
- $175,024
- List price
- $140,000
- Delta
- -20.01%
- Verdict
- UNDERPRICED
- Comps
- 20 within 1.0 mi
Projected returns pro-forma
8.31% appreciation · 3.0% rent growth · sell at horizon
- IRR
- 34.1%
- Equity multiple
- 3.46×
- Total profit
- $96,288
- Equity at exit
- $109,313
- IRR
- 30.1%
- Equity multiple
- 7.45×
- Total profit
- $252,883
- Equity at exit
- $219,863
Cash invested: $39,200 (down + closing). Projections, not guarantees.
Landlord ↔ Tenant lean methodology
- Overall (STATE)
- 62 Landlord-Friendly
- State Pennsylvania
- 62 Landlord-Friendly · EVEN
- County
- — inherits STATE
- City
- — inherits STATE
ZIP-level market 17009
- Home prices YoY
- 3.5%
- Active inventory
- 14
- Price-to-rent
- 6.3×
Monthly cashflow live
- Estimated rent
- $1,866 medium interval (Pro) →
- Mortgage (P&I)
- −$734
- Tax from tax record
- −$119 /mo · $1,430/yr
- Insurance
- −$58
- HOA
- −$0
- Vacancy / Maint / Mgmt
- −$392
- Net cashflow
- $563
Break-even live
UW: 25.0% down · 7.5% · 30yr · 1.5% tax · 5.0% vac · 8.0% maint · 8.0% mgmt
Financing live
Cash to close
- Down payment
- $35,000
- Closing costs
- $4,200
- Reserves months
- —
- Total cash needed
- —
Loan-product check · same deal, 3 products live
Conventional
25% down · 7.5% · 30yr
- Down + closing
- —
- Monthly P&I
- —
- Monthly cashflow
- —
- DSCR
- —
- Eligible?
- —
Personal DTI + credit; lowest rate.
DSCR
20% down · 8.5% · 30yr
- Down + closing
- —
- Monthly P&I
- —
- Monthly cashflow
- —
- DSCR
- —
- Eligible?
- —
No personal income docs; deal must DSCR.
Hard money
10% down · 12.0% · 12mo
- Down + closing
- —
- Monthly P&I
- —
- Monthly cashflow
- —
- DSCR
- —
- Eligible?
- —
Short-term bridge; refi at stabilization.
Listing history 26 events
-
2026-06-18days on market $140,000 Active 53 DOM
-
2026-06-17days on market $140,000 Active 52 DOM
-
2026-06-16days on market $140,000 Active 51 DOM
-
2026-06-15days on market $140,000 Active 50 DOM
-
2026-06-13days on market $140,000 Active 48 DOM
-
2026-06-12days on market $140,000 Active 47 DOM
-
2026-06-09days on market $140,000 Active 44 DOM
-
2026-06-08days on market $140,000 Active 43 DOM
-
2026-06-08days on market $140,000 Active 42 DOM
-
2026-06-07days on market $140,000 Active 41 DOM
-
2026-06-04days on market $140,000 Active 38 DOM
-
2026-06-02days on market $140,000 Active 37 DOM
-
2026-06-01days on market $140,000 Active 36 DOM
-
2026-05-31days on market $140,000 Active 35 DOM
-
2026-05-06status Pending 477-char remark
Show marketing remark (477 chars)
Step inside this new Burnham listing! Many possibilities are available with this 2-3 bedroom home. First floor features a living, dining, kitchen, remodeled full bath and a flex addition. Make it a bedroom, office or family room! Second floor features 2-3 bedrooms. Make one a bedroom with a walk-in closet, nursery, play room, the options are endless! Outside you will get a breath of fresh air as the rear yard boasts room for kids or pets. Off street parking recently added.
-
2026-04-10$144,900 Active 477-char remark
Show marketing remark (477 chars)
Step inside this new Burnham listing! Many possibilities are available with this 2-3 bedroom home. First floor features a living, dining, kitchen, remodeled full bath and a flex addition. Make it a bedroom, office or family room! Second floor features 2-3 bedrooms. Make one a bedroom with a walk-in closet, nursery, play room, the options are endless! Outside you will get a breath of fresh air as the rear yard boasts room for kids or pets. Off street parking recently added.
-
2019-06-12soldstatus $64,900
-
2019-06-07soldstatus $64,900 83-char remark
Show marketing remark (83 chars)
Cozy 2 story, 3-4 bedroom home. First floor master bedroom and large living spaces.
-
2018-03-06$64,900 83-char remark
Show marketing remark (83 chars)
Cozy 2 story, 3-4 bedroom home. First floor master bedroom and large living spaces.
-
2018-03-06$72,900
Show marketing remark (83 chars)
Cozy 2 story, 3-4 bedroom home. First floor master bedroom and large living spaces.
-
2017-07-17soldstatus $28,000
-
2014-05-30historical
-
2014-05-30$84,900
-
2008-11-03soldstatus $28,000
-
2008-06-23historical
-
2008-06-23$37,900
ⓘ Source: listings_history table (triggers on properties + properties_extension) + one-shot
backfill from property_details.listing_events for pre-trigger history.
Tax reassessment forecast PA · Partial reset (capped growth)
- Current annual tax
- $1,430 · $119/mo
- Projected year-2 tax
- $1,821 · $152/mo
- Expected delta
- +$391/yr (+$33/mo · 27.3%)
ⓘ Screening estimate from a state-policy table — verify with the county assessor before closing.
Climate risk First Street
- Flood 1/10 Low FEMA zone X (unshaded) · 0% chance over 30 yrs
- Wildfire 3/10 Moderate
- Heat 3/10 Moderate 7 d/yr ≥95°F today · 16 d/yr by 30 yrs out
- Wind 2/10 Low
- Air quality 2/10 Low 0 unhealthy d/yr today · 1 by 30 yrs out
Nearby sold comps map
Loading sold comps map…
Walkable amenities ~0.75 mi
Loading nearby amenities…
Taxation est. · year 1
- Rental income
- $22,398
- − Mortgage interest
- −$7,842
- − Property taxes
- −$1,430
- − Insurance
- −$700
- − Repairs & maintenance
- −$1,792
- − Management
- −$1,792
- − Depreciation
- −$4,073
- Taxable income
- $4,769
- Est. tax owed @ 24.0%
- −$1,145
- After-tax cash flow
- $5,609/yr
For passive investors: Depreciation is non-cash, so a rental often shows a tax loss while cash-flowing — sheltering income. Rental losses are passive: they offset passive income freely, and up to $25,000/yr can offset ordinary (W-2) income if you actively participate and your MAGI is under $100k (phasing out to $0 by $150k); unused losses carry forward. On sale, claimed depreciation is recaptured at up to 25%, and gains may owe capital-gains tax (a 1031 exchange can defer both). Figures are a year-1 estimate at your 24.0% rate — not tax advice; consult a CPA.
Schools (NCES district)
- District
- Mifflin County SD
- NCES district ID
- 4215290
- Math proficiency
- 28% ▼ -7.00%
- Reading proficiency
- 49% ▼ -9.00%
- Median HH income
- $40,718
- Composite
- 32.28/100
- National rank
- #5755
- State rank
- #380 of 539 in PA
Livability — Burnham
- Score
- 72/100
- State rank
- #634
- US rank
- #6172
Category grades
Schools grade is shown separately in the Schools card above.
Census & demographics
- Census place
- Burnham, PA
- City population
- 2,804
- Population (ZIP)
- 1,682
Population outlook (Mifflin County) Hauer SSP2
- Today (2025)
- 44,611 people
- By 2030
- 43,212 · -3.1%
- By 2040
- 40,197 · -9.9%
- By 2050
- 36,813 · -17.5%
- By 2075
- 28,833 · -35.4%
- By 2100
- 20,296 · -54.5%
Race, ethnicity, and origin ACS 2023
- Neighborhood character
- Predominantly White (91%)
- Race & ethnicity
- White 91% Two or more races 5% Black 3%
- Common ancestry
- Romanian 5% Iranian 3% Lithuanian 2%
- Foreign-born
- 0% · Canada
Political lean MEDSL · Mifflin
- 2024 margin
- Solid R (+56.4) · D 21.4% · R 77.9%
- 2008→2024 swing
- -22.8pp toward R · 2008: -33.7pp · 2024: -56.4pp
- All cycles
- 2024: R+56.4 2020: R+56.1 2016: R+57.5 2012: R+46.8 2008: R+33.7
Not yet ingested
- Civics
- —
Market trends
- HPI YoY
- ▲ 8.31%
- Current HPI
- 249.4239
- Rent YoY
- —
- Metro
- —
- State GDP YoY
- ▲ 1.68%
- F500 in state
- 34
Industry mix (Fortune 500 HQ in PA)
| Industry | F500 HQs | Revenue |
|---|---|---|
| Healthcare | 2 | $309B |
|
||
| Insurance | 2 | $27B |
|
||
| Telecommunications / Media | 1 | $124B |
|
||
| Industrial Distribution | 1 | $22B |
|
||
| Financial Services | 1 | $20B |
|
||
| Chemicals / Materials | 1 | $18B |
|
||
Price history
+282.3% since first listed12 events — show timeline
- 2026-05-06 Pending — BRIGHT MLS
- 2026-04-10 Listed $144,900 BRIGHT MLS
- 2019-06-12 Sold (Public Records) $64,900 Public Records
- 2019-06-07 Sold (MLS) $64,900 BRIGHT MLS
- 2018-03-06 Listed $72,900 BRIGHT MLS
- 2018-03-06 Listed $64,900 BRIGHT MLS
- 2017-07-17 Sold (Public Records) $28,000 Public Records
- 2014-05-30 Listed $84,900 BRIGHT MLS
- 2014-05-30 Listing Removed — BRIGHT MLS
- 2008-11-03 Sold (Public Records) $28,000 Public Records
- 2008-06-23 Listed $37,900 BRIGHT MLS
- 2008-06-23 Listing Removed — BRIGHT MLS
Property tax history
+0.7%/yrLatest (2026): $1,430 · +0.0% YoY. Source: county tax records.
Cash-flow waterfall
monthlySold comps — $/sqft
last 12 mo · ≤1 miLoading sold comps…