 🏷️ Likely Rental
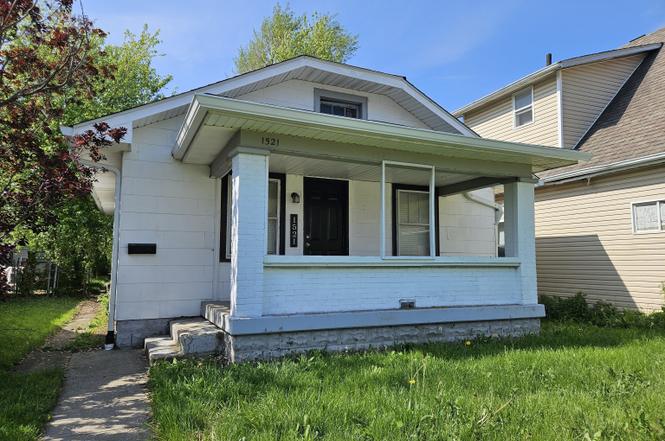
1521 E Legrande Ave · Indianapolis city (balance), IN
Flood risk 1/10 · Minimal
- FEMA flood zone
- X (unshaded)
- Chance of flooding over 30 yrs
- 0.0%
- Est. flood insurance / yr
- $473 – $860
Fire risk 1/10 · Minimal
- Est. fire insurance / yr
- $717 – $1,331
Heat risk 4/10 · Minor
- Hot days now (above 101°F)
- 7 days/yr
- Hot days in 30 yrs
- 19 days/yr
Wind risk 2/10 · Minimal
- Chance of severe wind over 30 yrs
- 0.0%
Air-quality risk 3/10 · Minor
- Unhealthy air days now
- 2 days/yr
- Unhealthy air days in 30 yrs
- 3 days/yr
Risk factors via First Street. Map © Google.
Why this score? — see what drove the C grade
The composite is a weighted blend of 9 inputs, each scored 0–100. Each bar is that input's sub-score; the figure is the points it added to the 100-point composite (weight × sub-score).
- Cash flow +22.4/30.0
- ARV discount +15.0/15.0
- DSCR +7.2/10.0
- 1% rule +5.7/10.0
- Rent growth +3.2/5.0
- Livability +2.5/5.0
- Condition / age +2.5/5.0
- Schools +1.4/10.0
- Appreciation +0.0/10.0
$110,000
🖨 Deal sheet (PDF) 📄 Offer letter ✓ Due diligence
Listing remarks
Don't miss this 2-bedroom, 1-bathroom single-family home located near the vibrant neighborhoods of Garfield Park, Bates-Hendricks, and Fountain Square. With a wave of investment and revitalization happening in the area, this property is primed for growth and opportunity. Perfect for a first-time homebuyer that wants to use a renovation loan to buy and renovate, or an investor looking to add to their portfolio. Currently occupied by a tenant on a month-to-month lease, the property generates $1,200/month in rental income, and estimated market rent is $1,320. The home has been updated with a newer roof, fresh paint, modern light fixtures, contemporary appliances, and a renovated kitchen and ba
Key facts
- Renovated bathroom
- Fresh paint
- Renovated kitchen
Tags
Neighborhood map
What this means for you Summary
Snapshot
- This is a 2-bed/1.0-bath single-family listed at $110k.
Deal economics
- At list price, monthly cash flow is $184 ($2k/yr) — positive.
- The deal already cash-flows at list — no discount required.
- Meets the 1% rule at list price ($1k rent vs $110k).
- Recommended offer: $97k (12.0% below list) — sets the bar for market timing.
- Cap rate 8.3% vs local median 4.4% in Indianapolis city (balance) — top-decile yield for the area; either an underpriced asset or a hidden risk that comps aren't pricing in. Stress-test before assuming the spread holds.
Location & tenants
- Location reads: area grade C — affects rentability + tenant quality, not the cash-flow math above.
- Indianapolis Public Schools (urban): math 14% / reading 20% proficiency, ranked #286 of 301 in IN (top 95%) — low school quality limits family demand, transient renter base, plan for 1-2y turnover; 77% free/reduced lunch — lower-income household profile, screen leases tightly.
- Zoned schools: Frederick Douglass School 19 (math 9% / reading 13%, grade F, #909 of 994 statewide, top 92%, 444 students, 81% FRL); H L Harshman Middle School (math 3% / reading 16%, grade F, #316 of 330 statewide, top 96%, 549 students, 84% FRL).
- Market conditions: Rents rising (+2.9%/yr); 501 active listings in the ZIP; 40 comparable units currently listed for rent nearby; rentals at typical pace (median 26d on market — plan ~3-4 weeks tenant-placement turnaround); 1,906 units permitted in Marion County in 2024 (621 in 5+ unit buildings).
Forward outlook
- Local home prices are declining (-3.0%/yr); year-one equity from $761 of loan paydown is wiped out by about $3k of value loss. Plan a longer hold.
- Marion County population projected at +18% by 2050 — long-run rental-demand tailwind backs the buy-and-hold thesis.
Negotiation context
- It's been on market 222 days — a 12% lower offer ($97k) is reasonable based on typical stale-listing flexibility.
- 5 sale attempts since 20y ago with the ask held roughly flat each time — persistent listings suggest the price (not the market) is what's stuck; bring a comps-based counter.
- Current owner paid $16k; list at $110k implies a 592% gain — meaningful room to come down on a strong offer.
Risks & watch-outs
- Watch-outs: built in 1926 — expect roof / HVAC / electrical / plumbing capex.
Questions for the listing agent
- It's been on market 222 days. Have you received any prior offers? Is the seller open to a 12% concession, seller financing, or rate buy-down credit?
- Built in 1926 — when were the roof, HVAC, electrical panel, plumbing, and water heater last replaced?
- Why hasn't it sold? Are there any deal-killer items the seller is aware of (foundation, flood, title, zoning, code violations)?
- Is there a deadline driving the sale (1031 exchange, divorce, estate, relocation)? That informs how much negotiation room exists.
- What's the average days-on-market for RENTAL listings here right now (not sales)? A rising rental-DOM trend means longer vacancies and softer asking-rent achievability than the comps imply.
- What's the recent tenant-quality profile in this submarket — average credit score on applications, eviction rate, late-payment / NSF rate, and stable-employment percentage? A property-management company in the area should have these aggregated.
- How much new for-sale + rental construction is in the pipeline within 1–3 miles? Heavy new supply typically softens prices + rents 12–24 months out; constrained supply supports both.
Investment metrics
- 1% rule
- 1.07% ✓
- Cap rate
- 8.30%
- Cash-on-cash
- 7.17%
- DSCR
- 1.32
- GRM
- 7.8
CMA / ARV
- ARV (on-the-fly)
- $148,224
- Comps found
- 12
Show comp detail 12 sales within ~0.75 mi
| Address | Dist | Beds/Ba | Sqft | Sold | Price | $/sf | Match |
|---|---|---|---|---|---|---|---|
| 1637 Hoefgen St | 0.48mi | 2/1.0 | 780 (+2%) | 4mo | $90,000 | $115 | 72 |
| 1418 Finley Ave | 0.38mi | 2/1.0 | 844 (+10%) | 2mo | $55,000 | $65 | 64 |
| 1730 S State Ave | 0.41mi | 2/1.0 | 704 (-8%) | 4mo | $139,999 | $199 | 64 |
| 2062 Calhoun St | 0.54mi | 2/1.0 | 720 (-6%) | 3mo | $149,900 | $208 | 62 |
| 1431 Finley Ave | 0.40mi | 2/1.0 | 858 (+12%) | 3mo | $75,000 | $87 | 59 |
| 2237 Villa Ave | 0.49mi | 3/1.0 (+1) | 846 (+10%) | 1mo | $175,000 | $207 | 55 |
| 1509 Comer Ave | 0.52mi | 2/2.0 | 856 (+12%) | 0mo | $175,000 | $204 | 52 |
| 1610 Ringgold Ave | 0.69mi | 2/1.0 | 850 (+11%) | 1mo | $164,000 | $193 | 49 |
| 2524 Harlan St | 0.67mi | 2/1.0 | 676 (-12%) | 0mo | $130,900 | $194 | 48 |
| 2329 Saint Paul St | 0.64mi | 2/1.0 | 672 (-12%) | 3mo | $86,000 | $128 | 47 |
| 2029 Reformers Ave | 0.49mi | 3/1.0 (+1) | 875 (+14%) | 6mo | $95,000 | $109 | 44 |
| 2343 Saint Peter St | 0.70mi | 3/1.0 (+1) | 864 (+12%) | 3mo | $113,000 | $131 | 39 |
Match score weights: distance 35% · size 25% · config 20% · recency 20%. Top-matched comps best support the ARV.
Projected returns pro-forma
-3.0% appreciation · 2.88% rent growth · sell at horizon
- IRR
- -5.4%
- Equity multiple
- 0.80×
- Total profit
- $-6,235
- Equity at exit
- $16,401
- IRR
- 4.1%
- Equity multiple
- 1.30×
- Total profit
- $9,125
- Equity at exit
- $9,511
Cash invested: $30,800 (down + closing). Projections, not guarantees.
Landlord ↔ Tenant lean methodology
- Overall (STATE)
- 90 Strongly Landlord-Friendly
- State Indiana
- 90 Strongly Landlord-Friendly · R+11
- County
- — inherits STATE
- City
- — inherits STATE
ZIP-level market 46203
- Home prices YoY
- -26.7%
- Rents YoY
- 2.9%
- Active inventory
- 501
- Price-to-rent
- 7.8×
Monthly cashflow live
- Estimated rent
- $1,181 high interval (Pro) →
- Mortgage (P&I)
- −$577
- Tax from tax record
- −$126 /mo · $1,514/yr
- Insurance
- −$46
- HOA
- −$0
- Lot rent
- −$0
- Vacancy / Maint / Mgmt
- −$248
- Net cashflow
- $184
Break-even live
Sensitivity live
| Price | -10% $246 | -5% $215 | +0% $184 | +5% $153 | +10% $122 |
|---|---|---|---|---|---|
| Rent | -10% $91 | -5% $137 | +0% $184 | +5% $231 | +10% $277 |
| Rate | -1.0pp $239 | -0.5pp $212 | base $184 | +0.5pp $156 | +1.0pp $127 |
UW: 25.0% down · 7.5% · 30yr · 1.5% tax · 5.0% vac · 8.0% maint · 8.0% mgmt
Financing live
Cash to close
- Down payment
- $27,500
- Closing costs
- $3,300
- Reserves months
- —
- Total cash needed
- —
Loan-product check · same deal, 3 products live
Conventional
25% down · 7.5% · 30yr
- Down + closing
- —
- Monthly P&I
- —
- Monthly cashflow
- —
- DSCR
- —
- Eligible?
- —
Personal DTI + credit; lowest rate.
DSCR
20% down · 8.5% · 30yr
- Down + closing
- —
- Monthly P&I
- —
- Monthly cashflow
- —
- DSCR
- —
- Eligible?
- —
No personal income docs; deal must DSCR.
Hard money
10% down · 12.0% · 12mo
- Down + closing
- —
- Monthly P&I
- —
- Monthly cashflow
- —
- DSCR
- —
- Eligible?
- —
Short-term bridge; refi at stabilization.
Rent comps 40 comps
| Address | Beds | Baths | Sqft | Rent | $/sqft | DOM | Units | Dist |
|---|---|---|---|---|---|---|---|---|
| 1409 E Tabor St Indianapolis, IN | 1.0 | 1.0 | 528 | $775 | $1.47 | 26d | 1 | 0.18mi |
| 1604 E Kelly St Indianapolis, IN | 2.0 | 1.0 | 800 | $1,025 | $1.28 | 13d | 1 | 0.21mi |
| 1604 E Kelly St Indianapolis, IN | 2.0 | 1.0 | 750 | $1,025 | $1.37 | 20d | 1 | 0.21mi |
| 1706 E Tabor St Unit 1708 Indianapolis, IN | 3.0 | 1.0 | 1000 | $1,300 | $1.30 | 10d | 1 | 0.25mi |
| 1117 E Naomi St Indianapolis, IN | 2.0 | 1.5 | 976 | $1,450 | $1.49 | 1d | 1 | 0.35mi |
| 1815 Dawson St Unit 1815 Indianapolis, IN | 2.0 | 1.0 | 1019 | $999 | $0.98 | 17d | 1 | 0.43mi |
| 1011 E Raymond St Indianapolis, IN | 2.0 | 2.0 | 1100 | $1,350 | $1.23 | 26d | 1 | 0.43mi |
| 2103 Ringgold Ave Indianapolis, IN | 1.0 | 1.0 | 1090 | $775 | $0.71 | 16d | 1 | 0.44mi |
| 1637 S State Ave Indianapolis, IN | 2.0 | 1.5 | 816 | $900 | $1.10 | 20d | 1 | 0.48mi |
| 1640 Asbury St Indianapolis, IN | 1.0 | 1.0 | 700 | $850 | $1.21 | 46d | 1 | 0.50mi |
| 2036 Calhoun St Indianapolis, IN | 2.0 | 1.0 | 880 | $1,200 | $1.36 | 10d | 1 | 0.50mi |
| 1637 Hoefgen St Indianapolis, IN | 2.0 | 1.0 | 780 | $1,000 | $1.28 | 46d | 1 | 0.51mi |
| 1727 S Randolph St Indianapolis, IN | 1.0 | 1.0 | 616 | $950 | $1.54 | 46d | 1 | 0.52mi |
| 1620 E Palmer St Indianapolis, IN | 2.0 | 1.0 | 824 | $1,200 | $1.46 | 26d | 1 | 0.53mi |
| 1543 S State Ave Indianapolis, IN | 2.0 | 1.0 | 1086 | $1,100 | $1.01 | 10d | 1 | 0.54mi |
| 2469 Dawson St Indianapolis, IN | 2.0 | 1.0 | 700 | $949 | $1.36 | 5d | 4 | 0.55mi |
| 2525 Shelby St Unit 1 Indianapolis, IN | 1.0 | 1.0 | 600 | $865 | $1.44 | 5d | 1 | 0.59mi |
| 2525 Shelby St Unit 4 Indianapolis, IN | 1.0 | 1.0 | 600 | $775 | $1.29 | 26d | 1 | 0.59mi |
| 2525 Shelby St Unit 4 Indianapolis, IN | 1.0 | 1.0 | 600 | $775 | $1.29 | 1d | 1 | 0.59mi |
| 1534 Dawson St Indianapolis, IN | 3.0 | 1.0 | 1040 | $1,499 | $1.44 | 26d | 1 | 0.60mi |
| 944 E Minnesota St Indianapolis, IN | 2.0 | 2.0 | 944 | $1,299 | $1.38 | 46d | 1 | 0.64mi |
| 2555 Shelby St Unit 2559 Indianapolis, IN | 1.0 | 1.0 | 717 | $1,250 | $1.74 | 46d | 1 | 0.66mi |
| 1503 Dawson St Indianapolis, IN | 2.0 | 1.0 | 700 | $1,200 | $1.71 | 46d | 1 | 0.67mi |
| 823 Iowa St Indianapolis, IN | 2.0 | 1.0 | 812 | $1,100 | $1.35 | 1d | 1 | 0.67mi |
| 823 Iowa St Indianapolis, IN | 2.0 | 1.0 | 812 | $1,100 | $1.35 | 46d | 1 | 0.67mi |
| 1026 Laurel St Indianapolis, IN | 1.0 | 1.0 | 655 | $860 | $1.31 | 46d | 1 | 0.70mi |
| 1861 Orleans St Indianapolis, IN | 1.0 | 1.0 | 552 | $2,500 | $4.53 | 26d | 1 | 0.72mi |
| 1549 Nelson Ave Indianapolis, IN | 3.0 | 1.0 | 950 | $1,380 | $1.45 | 46d | 1 | 0.74mi |
| 620 E Beecher St Indianapolis, IN | 3.0 | 2.0 | 1072 | $1,639 | $1.53 | 22d | 1 | 0.75mi |
| 1514 Ringgold Ave Indianapolis, IN | 3.0 | 1.0 | 1064 | $1,295 | $1.22 | 46d | 1 | 0.75mi |
| 2430 E Kelly St Indianapolis, IN | 2.0 | 1.0 | 965 | $949 | $0.98 | 46d | 1 | 0.77mi |
| 1318 Shelby St Unit B 120% AMI Indianapolis, IN | 1.0 | 1.0 | 1116 | $1,350 | $1.21 | 26d | 1 | 0.80mi |
| 2633 S Randolph St Indianapolis, IN | 2.0 | 1.0 | 900 | $995 | $1.11 | 13d | 1 | 0.81mi |
| 2633 S Randolph St Unit b Indianapolis, IN | 2.0 | 1.0 | 900 | $995 | $1.11 | 26d | 1 | 0.81mi |
| 1026 Orange St Indianapolis, IN | 2.0 | 2.0 | 1007 | $1,600 | $1.59 | 18d | 1 | 0.81mi |
| 1024 Orange St Indianapolis, IN | 2.0 | 2.0 | 1007 | $1,650 | $1.64 | 46d | 1 | 0.82mi |
| 2714 Dawson St Indianapolis, IN | 3.0 | 1.0 | 912 | $1,500 | $1.64 | 1d | 1 | 0.84mi |
| 512 E Minnesota St Unit 203 Indianapolis, IN | 2.0 | 1.0 | 903 | $1,195 | $1.32 | 26d | 1 | 0.89mi |
| 1144 McDougal St Indianapolis, IN | 3.0 | 1.0 | 876 | $1,500 | $1.71 | 24d | 1 | 0.90mi |
| 1441 Prospect St Indianapolis, IN | 2.0 | 1.0–2.0 | 2840 | $1,949 | $0.69 | 0d | 14 | 0.91mi |
Listing history 9 events
-
2026-02-24status Pending
-
2025-08-15status Active
-
2025-07-16$110,000 Active
-
2012-08-28historical
-
2012-02-27$49,900
-
2010-09-13historical
-
2010-04-15$39,900
-
2006-09-14soldstatus $15,900
-
2006-07-16$18,900
ⓘ Source: listings_history table (triggers on properties + properties_extension) + one-shot
backfill from property_details.listing_events for pre-trigger history.
Tax reassessment forecast IN · Partial reset (capped growth)
- Current annual tax
- $1,514 · $126/mo
- Projected year-2 tax
- $1,514 · $126/mo
- Expected delta
- $0/yr ($0/mo · 0.0%)
ⓘ Screening estimate from a state-policy table — verify with the county assessor before closing.
Climate risk First Street
- Flood 1/10 Low FEMA zone X (unshaded) · 0% chance over 30 yrs
- Wildfire 1/10 Low
- Heat 4/10 Moderate 7 d/yr ≥101°F today · 19 d/yr by 30 yrs out
- Wind 2/10 Low 0% chance of damaging wind over 30 yrs
- Air quality 3/10 Moderate 2 unhealthy d/yr today · 3 by 30 yrs out
Nearby sold comps map
Loading sold comps map…
Walkable amenities ~0.75 mi
Loading nearby amenities…
Taxation est. · year 1
- Rental income
- $14,170
- − Mortgage interest
- −$6,162
- − Property taxes
- −$1,514
- − Insurance
- −$550
- − Repairs & maintenance
- −$1,134
- − Management
- −$1,134
- − Depreciation
- −$3,200
- Taxable income
- $477
- Est. tax owed @ 24.0%
- −$115
- After-tax cash flow
- $2,094/yr
For passive investors: Depreciation is non-cash, so a rental often shows a tax loss while cash-flowing — sheltering income. Rental losses are passive: they offset passive income freely, and up to $25,000/yr can offset ordinary (W-2) income if you actively participate and your MAGI is under $100k (phasing out to $0 by $150k); unused losses carry forward. On sale, claimed depreciation is recaptured at up to 25%, and gains may owe capital-gains tax (a 1031 exchange can defer both). Figures are a year-1 estimate at your 24.0% rate — not tax advice; consult a CPA.
Schools (NCES district)
- District
- Indianapolis Public Schools
- NCES district ID
- 1804770
- Math proficiency
- 14% ▼ -7.00%
- Reading proficiency
- 20% ▼ -3.00%
- Median HH income
- $32,034
- Composite
- 13.69/100
- National rank
- #9499
- State rank
- #286 of 301 in IN
Livability — Indianapolis city (balance)
No livability data for this city. (Only ~50 U.S. cities are tracked.)
Census & demographics
- Census place
- Indianapolis city (balance), IN
- County
- Marion County · 998,460 people
- City population
- 881,119
- Metro
- Indianapolis-Carmel-Anderson, IN
- Population (ZIP)
- 37,758
- Household income
- $57,393
- Rent vs Own
- Severe rent burden
- 1499.0
Population outlook (Marion County) Hauer SSP2
- Today (2025)
- 1,025,572 people
- By 2030
- 1,065,727 · +3.9%
- By 2040
- 1,141,577 · +11.3%
- By 2050
- 1,208,920 · +17.9%
- By 2075
- 1,367,288 · +33.3%
- By 2100
- 1,438,201 · +40.2%
Race, ethnicity, and origin ACS 2023
- Neighborhood character
- Predominantly White (69%)
- Race & ethnicity
- White 69% Hispanic / Latino 14% Black 12% Two or more races 8% Asian 2% Native American 1%
- Hispanic origin (detail)
- Mexican 12% Puerto Rican 1%
- Common ancestry
- Slovak 2% Lithuanian 2% Italian 1%
- Foreign-born
- 8% · Canada
- Languages at home
- 88% English-only · Spanish 10% Other Indo-European 1%
Political lean MEDSL · Marion
- 2024 margin
- Strong D (+27.7) · D 63.0% · R 35.3% · Other 1.7%
- 2008→2024 swing
- -0.7pp no change · 2008: 28.4pp · 2024: 27.7pp
- All cycles
- 2024: D+27.7 2020: D+29.1 2016: D+22.8 2012: D+22.2 2008: D+28.4
Not yet ingested
- Civics
- —
Market trends
- HPI YoY
- ▼ -127.37%
- Current HPI
- 349.579
- Rent YoY
- ▲ 2.88%
- Metro
- Indianapolis-Carmel-Anderson, IN
- State GDP YoY
- ▲ 2.90%
- F500 in state
- 18
Industry mix (Fortune 500 HQ in IN)
| Industry | F500 HQs | Revenue |
|---|---|---|
| Industrial Machinery | 2 | $37B |
|
||
| Healthcare | 1 | $177B |
|
||
| Pharmaceuticals | 1 | $45B |
|
||
| Metals / Steel | 1 | $18B |
|
||
| Agriculture | 1 | $17B |
|
||
| Packaging | 1 | $12B |
|
||
Price history
+482.0% since first listed9 events — show timeline
- 2026-02-24 Pending — MIBOR as Distributed by MLS Grid
- 2025-08-15 Relisted — MIBOR as Distributed by MLS Grid
- 2025-07-16 Listed $110,000 MIBOR as Distributed by MLS Grid
- 2012-08-28 Listing Removed — MIBOR as Distributed by MLS Grid
- 2012-02-27 Listed $49,900 MIBOR as Distributed by MLS Grid
- 2010-09-13 Listing Removed — MIBOR as Distributed by MLS Grid
- 2010-04-15 Listed $39,900 MIBOR as Distributed by MLS Grid
- 2006-09-14 Sold (MLS) $15,900 MIBOR as Distributed by MLS Grid
- 2006-07-16 Listed $18,900 MIBOR as Distributed by MLS Grid
Property tax history
+6.1%/yrLatest (2025): $1,514 · +6.7% YoY. Source: county tax records.
Cash-flow waterfall
monthlySold comps — $/sqft
last 12 mo · ≤1 miLoading sold comps…