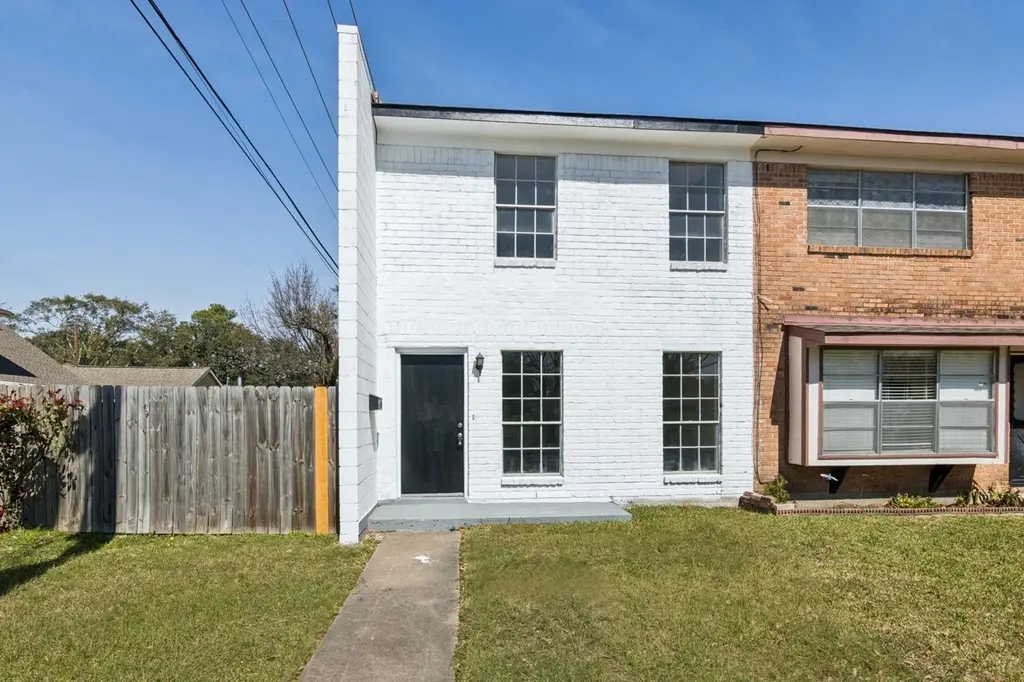
9114 Kempwood Dr #9114 · Houston, TX
Flood risk 3/10 · Minor
- FEMA flood zone
- X (shaded)
- Chance of flooding over 30 yrs
- 0.2%
- Est. flood insurance / yr
- $507 – $1,088
Fire risk 1/10 · Minimal
- Est. fire insurance / yr
- $1,222 – $2,270
Heat risk 9/10 · Severe
- Hot days now (above 109°F)
- 7 days/yr
- Hot days in 30 yrs
- 24 days/yr
Wind risk 9/10 · Severe
- Chance of severe wind over 30 yrs
- 99.0%
Air-quality risk 3/10 · Minor
- Unhealthy air days now
- 3 days/yr
- Unhealthy air days in 30 yrs
- 3 days/yr
Risk factors via First Street. Map © Google.
Why this score? — see what drove the C grade
The composite is a weighted blend of 9 inputs, each scored 0–100. Each bar is that input's sub-score; the figure is the points it added to the 100-point composite (weight × sub-score).
- Cash flow +18.5/30.0
- ARV discount +15.0/15.0
- DSCR +5.8/10.0
- 1% rule +5.0/10.0
- Schools +4.1/10.0
- Livability +3.7/5.0
- Condition / age +2.5/5.0
- Rent growth +2.1/5.0
- Appreciation +0.0/10.0
$149,900
🖨 Deal sheet (PDF) 📄 Offer letter ✓ Due diligence
Listing remarks MLS
Welcome home! DYNAMITE 2 Bedroom, 1.5 bath COMPLETELY REMODELED townhome in Spring Branch...ALL NEW EVERYTHING: HVAC system, paint in and out, flooring throughout, hardware, countertops, appliances, lighting...TOO MANY UPGRADES TO MENTION...Pictures tell the story on this one... End unit with only one shared wall...Beautiful fenced in large patio back yard PERFECT FOR ENTERTAINING...Hurry at this location and at this price range it will not last!
Key facts
- Quartz countertops
- New carpet
- Spacious patio
Tags
Neighborhood map
What this means for you Summary
Snapshot
- This is a 2-bed/1.5-bath condo listed at $150k.
Deal economics
- At list price, monthly cash flow is $144 ($2k/yr) — positive.
- The deal already cash-flows at list — no discount required.
- To meet the 1% rule (rent ≥ 1% of price), the offer needs to be $149k (0.5% below list).
- Recommended offer: $132k (12.0% below list) — sets the bar for market timing.
- Cap rate 7.4% vs local median 3.2% in Houston — top-decile yield for the area; either an underpriced asset or a hidden risk that comps aren't pricing in. Stress-test before assuming the spread holds.
Location & tenants
- Location reads 74/100 on livability (#184 in TX, #4,771 nationally) — a middle-class / working-renter tenant base. Strengths: amenities A+, cost of living A+, housing A+; Watch: schools D, crime F.
- Spring Branch ISD (urban): math 47% / reading 46% proficiency, ranked #215 of 826 in TX (top 26%) — families likely to look elsewhere, expect single-tenant / working-renter base with shorter leases.
- Market conditions: Rents soft (-1.6%/yr); 344 active listings in the ZIP; 39 comparable units currently listed for rent nearby; rentals at typical pace (median 25d on market — plan ~3-4 weeks tenant-placement turnaround); 41% of comp listings sitting > 30 days — soft ceiling on asking rent; 29,883 units permitted in Harris County in 2024 (8,621 in 5+ unit buildings).
Forward outlook
- Local home prices are declining (-3.0%/yr); year-one equity from $1k of loan paydown is wiped out by about $4k of value loss. Plan a longer hold.
- Harris County population projected at +47% by 2050 — long-run rental-demand tailwind backs the buy-and-hold thesis.
Negotiation context
- It's been on market 219 days — a 12% lower offer ($132k) is reasonable based on typical stale-listing flexibility.
- 2 sale attempts; this cycle's ask is 8744% above the opening price — seller raised mid-cycle; expect resistance to lowballs.
Risks & watch-outs
- Climate carrying-cost: severe wind risk, 99% chance of damaging wind over 30y; extreme-heat days projected 7→24/yr by 2055 (HVAC capex compounding) — expect insurance premiums to compound above CPI over the hold.
Questions for the listing agent
- It's been on market 219 days. Have you received any prior offers? Is the seller open to a 12% concession, seller financing, or rate buy-down credit?
- Built in 1970 — when were the roof, HVAC, electrical panel, plumbing, and water heater last replaced?
- Any open or pending special assessments — roof, HVAC, plumbing, elevator, façade? What's the per-unit balance and payoff schedule, and is the seller paying it off at close or rolling it to the buyer?
- Why hasn't it sold? Are there any deal-killer items the seller is aware of (foundation, flood, title, zoning, code violations)?
- Is there a deadline driving the sale (1031 exchange, divorce, estate, relocation)? That informs how much negotiation room exists.
- Schools are D-rated, which usually means shorter tenancies and higher turnover. Who's the typical renter profile here, and what's been the actual vacancy rate?
- Crime grade is F in this area — have there been break-ins, vandalism, or insurance claims at this property in the last 3 years? What carrier currently insures it and at what premium?
- What's the average days-on-market for RENTAL listings here right now (not sales)? A rising rental-DOM trend means longer vacancies and softer asking-rent achievability than the comps imply.
- What's the recent tenant-quality profile in this submarket — average credit score on applications, eviction rate, late-payment / NSF rate, and stable-employment percentage? A property-management company in the area should have these aggregated.
- How much new apartment / multifamily construction is in the pipeline within 1–3 miles? Heavy new supply (>2% of stock underway) typically softens rents 12–24 months out; light construction supports rent growth.
Investment metrics
- 1% rule
- 1.00% ✗
- Cap rate
- 7.45%
- Cash-on-cash
- 4.12%
- DSCR
- 1.18
- GRM
- 8.4
CMA / ARV
- ARV (median comp)
- $292,605
- List price
- $149,900
- Delta
- -45.35%
- Verdict
- UNDERPRICED
- Comps
- 20 within 1.0 mi
Projected returns pro-forma
-3.0% appreciation · 0.0% rent growth · sell at horizon
- IRR
- -13.3%
- Equity multiple
- 0.54×
- Total profit
- $-19,472
- Equity at exit
- $22,351
- IRR
- -9.9%
- Equity multiple
- 0.48×
- Total profit
- $-21,955
- Equity at exit
- $12,961
Cash invested: $41,972 (down + closing). Projections, not guarantees.
Landlord ↔ Tenant lean methodology
- Overall (STATE)
- 87 Strongly Landlord-Friendly
- State Texas
- 87 Strongly Landlord-Friendly · R+5
- County
- — inherits STATE
- City
- — inherits STATE
ZIP-level market 77080
- Rents YoY
- -1.6%
- Active inventory
- 344
- Price-to-rent
- 8.4×
Monthly cashflow live
- Estimated rent
- $1,492 high interval (Pro) →
- Mortgage (P&I)
- −$786
- Tax from tax record
- −$186 /mo · $2,230/yr
- Insurance
- −$62
- HOA
- −$0
- Vacancy / Maint / Mgmt
- −$313
- Net cashflow
- $144
Break-even live
Sensitivity live
| Price | -10% $229 | -5% $186 | +0% $144 | +5% $102 | +10% $59 |
|---|---|---|---|---|---|
| Rent | -10% $26 | -5% $85 | +0% $144 | +5% $203 | +10% $262 |
| Rate | -1.0pp $219 | -0.5pp $182 | base $144 | +0.5pp $105 | +1.0pp $66 |
UW: 25.0% down · 7.5% · 30yr · 1.5% tax · 5.0% vac · 8.0% maint · 8.0% mgmt
Financing live
Cash to close
- Down payment
- $37,475
- Closing costs
- $4,497
- Reserves months
- —
- Total cash needed
- —
Loan-product check · same deal, 3 products live
Conventional
25% down · 7.5% · 30yr
- Down + closing
- —
- Monthly P&I
- —
- Monthly cashflow
- —
- DSCR
- —
- Eligible?
- —
Personal DTI + credit; lowest rate.
DSCR
20% down · 8.5% · 30yr
- Down + closing
- —
- Monthly P&I
- —
- Monthly cashflow
- —
- DSCR
- —
- Eligible?
- —
No personal income docs; deal must DSCR.
Hard money
10% down · 12.0% · 12mo
- Down + closing
- —
- Monthly P&I
- —
- Monthly cashflow
- —
- DSCR
- —
- Eligible?
- —
Short-term bridge; refi at stabilization.
Rent comps 39 comps
| Address | Beds | Baths | Sqft | Rent | $/sqft | DOM | Units | Dist |
|---|---|---|---|---|---|---|---|---|
| 9007 Kempwood Dr Houston, TX | 3.0 | 2.0 | 1344 | $1,175 | $0.87 | 16d | 1 | 0.16mi |
| 9007 Kempwood Dr Houston, TX | 3.0 | 2.0 | 1344 | $1,175 | $0.87 | 19d | 1 | 0.16mi |
| 2324 Peppermill Rd Houston, TX | 3.0 | 1.5 | 1500 | $1,800 | $1.20 | 25d | 1 | 0.38mi |
| 3400 Campbell Rd Houston, TX | 1.0–3.0 | 1.0–2.0 | 954 | $1,024 | $1.07 | 6d | 12 | 0.50mi |
| 9540 Kempwood Dr Houston, TX | 1.0–3.0 | 1.0–2.5 | 965 | $1,260 | $1.31 | 44d | 24 | 0.66mi |
| 4006 Hollister Rd Houston, TX | 3.0 | 2.0 | 1344 | $1,776 | $1.32 | 25d | 1 | 0.74mi |
| 3950 Hollister Rd Houston, TX | 1.0–3.0 | 1.0–2.0 | 972 | $974 | $1.00 | 3d | 6 | 0.76mi |
| 3125 Crestdale Dr Unit 3148 Houston, TX | 3.0 | 2.0 | 1241 | $1,533 | $1.24 | 0d | 1 | 0.84mi |
| 3125 Crestdale Dr Unit 3158 Houston, TX | 3.0 | 2.0 | 1241 | $1,573 | $1.27 | 11d | 1 | 0.84mi |
| 2015 Peppermill Rd Houston, TX | 3.0 | 2.0 | 1756 | $2,400 | $1.37 | 44d | 1 | 0.84mi |
| 3125 Crestdale Dr Houston, TX | 3.0 | 3.0 | 1400 | $1,749 | $1.25 | 44d | 1 | 0.90mi |
| 2008 Laverne Willow Ln Unit 2008 B* Model Houston, TX | 2.0 | 2.0 | 1200 | $2,145 | $1.79 | 44d | 1 | 0.91mi |
| 9012 Lonestar Creekbend Ln Houston, TX | 3.0 | 2.5 | 1500 | $2,175 | $1.45 | 25d | 1 | 0.94mi |
| 9009 Lonestar River Ln Houston, TX | 3.0 | 3.5 | 2048 | $2,780 | $1.36 | 44d | 1 | 0.97mi |
| 3125 Crestdale Dr Unit 1006 Houston, TX | 3.0 | 2.0 | 1495 | $1,629 | $1.09 | 25d | 1 | 0.99mi |
| 3125 Crestdale Dr Unit 1091 Houston, TX | 3.0 | 2.0 | 1450 | $1,500 | $1.03 | 44d | 1 | 0.99mi |
| 3125 Crestdale Dr Unit 2346 Houston, TX | 3.0 | 2.0 | 1354 | $1,499 | $1.11 | 44d | 1 | 0.99mi |
| 3125 Crestdale Dr Unit 1057 Houston, TX | 3.0 | 2.0 | 1241 | $1,419 | $1.14 | 44d | 1 | 0.99mi |
| 3125 Crestdale Dr Unit 1064 Houston, TX | 3.0 | 2.0 | 1400 | $1,399 | $1.00 | 44d | 1 | 0.99mi |
| 3125 Crestdale Dr Unit 1185 Houston, TX | 2.0 | 2.0 | 1150 | $1,249 | $1.09 | 44d | 1 | 0.99mi |
| 3125 Crestdale Dr Unit 1006 Houston, TX | 3.0 | 2.0 | 1500 | $1,629 | $1.09 | 44d | 1 | 0.99mi |
| 3125 Crestdale Dr Unit 2523 Houston, TX | 2.0 | 2.0 | 1080 | $1,299 | $1.20 | 44d | 1 | 0.99mi |
| 3125 Crestdale Dr Unit 1436 Houston, TX | 3.0 | 2.0 | 1450 | $1,599 | $1.10 | 44d | 1 | 0.99mi |
| 8520 Pitner Rd Houston, TX | 3.0 | 1.0–2.0 | 892 | $1,216 | $1.36 | 2d | 102 | 1.04mi |
| 9024 Wellspring Dr Houston, TX | 3.0 | 2.5 | 2000 | $2,700 | $1.35 | 23d | 1 | 1.06mi |
| 1920 Hollister St Apt 1201 Houston, TX | 2.0 | 2.0 | 1200 | $1,295 | $1.08 | 25d | 1 | 1.10mi |
| 2308 Bingle Rd Houston, TX | 3.0 | 1.0–2.0 | 871 | $1,973 | $2.26 | 0d | 34 | 1.11mi |
| 8701 Hammerly Blvd Houston, TX | 3.0 | 1.0–2.0 | 843 | $1,281 | $1.52 | 0d | 53 | 1.13mi |
| 1760 Campbell Rd Houston, TX | 3.0 | 2.0 | 1354 | $1,675 | $1.24 | 44d | 1 | 1.23mi |
| 8515 Hammerly Blvd Unit 3047 Houston, TX | 3.0 | 2.0 | 1200 | $1,330 | $1.11 | 0d | 1 | 1.24mi |
| 8850 Long Point Rd Houston, TX | 1.0–2.0 | 1.0–2.0 | 994 | $1,955 | $1.97 | 0d | 37 | 1.27mi |
| 8515 Hammerly Blvd Unit 8548 Houston, TX | 3.0 | 2.0 | 1200 | $1,279 | $1.07 | 0d | 1 | 1.27mi |
| 9811 Falling Fern Ln Houston, TX | 3.0 | 2.5 | 1942 | $2,400 | $1.24 | 0d | 1 | 1.30mi |
| 9813 Falling Fern Ln Houston, TX | 3.0 | 2.5 | 1650 | $2,295 | $1.39 | 25d | 1 | 1.30mi |
| 9826 Rugged Oaks Dr Houston, TX | 3.0 | 2.5 | 1942 | $2,250 | $1.16 | 25d | 1 | 1.34mi |
| 2121 Pech Rd Houston, TX | 1.0–2.0 | 1.0–2.0 | 900 | $1,680 | $1.87 | 3d | 49 | 1.36mi |
| 10005 Kempwood Dr Houston, TX | 2.0 | 2.0 | 1100 | $1,213 | $1.10 | 44d | 1 | 1.36mi |
| 9999 Kempwood Dr Houston, TX | 1.0–2.0 | 1.0–2.0 | 932 | $1,552 | $1.66 | 44d | 31 | 1.45mi |
| 10105 Kempwood Dr Houston, TX | 1.0–3.0 | 1.0–2.0 | 925 | $1,224 | $1.32 | 3d | 24 | 1.48mi |
HOA detail condo
- Monthly dues
- $0 · $0/yr
- Assessments
- None detected in remarks — confirm with the listing agent.
Listing history 21 events
-
2026-06-21pricedays on market $149,900 Active 219 DOM
-
2026-06-18days on market $159,900 Active 216 DOM
-
2026-06-17days on market $159,900 Active 215 DOM
-
2026-06-16days on market $159,900 Active 214 DOM
-
2026-06-15days on market $159,900 Active 213 DOM
-
2026-06-13days on market $159,900 Active 211 DOM
-
2026-06-09days on market $159,900 Active 207 DOM
-
2026-06-08days on market $159,900 Active 206 DOM
-
2026-06-07days on market $159,900 Active 205 DOM
-
2026-06-04days on market $159,900 Active 202 DOM
-
2026-06-03days on market $159,900 Active 201 DOM
-
2026-06-02days on market $159,900 Active 200 DOM
-
2026-06-01days on market $159,900 Active 199 DOM
-
2026-05-31days on market $159,900 Active 198 DOM
-
2026-04-30$1,695
-
2026-02-20price $159,900 450-char remark
Show marketing remark (450 chars)
Welcome home! DYNAMITE 2 Bedroom, 1.5 bath COMPLETELY REMODELED townhome in Spring Branch...ALL NEW EVERYTHING: HVAC system, paint in and out, flooring throughout, hardware, countertops, appliances, lighting...TOO MANY UPGRADES TO MENTION...Pictures tell the story on this one... End unit with only one shared wall...Beautiful fenced in large patio back yard PERFECT FOR ENTERTAINING...Hurry at this location and at this price range it will not last!
-
2026-01-19price $169,900 450-char remark
Show marketing remark (450 chars)
Welcome home! DYNAMITE 2 Bedroom, 1.5 bath COMPLETELY REMODELED townhome in Spring Branch...ALL NEW EVERYTHING: HVAC system, paint in and out, flooring throughout, hardware, countertops, appliances, lighting...TOO MANY UPGRADES TO MENTION...Pictures tell the story on this one... End unit with only one shared wall...Beautiful fenced in large patio back yard PERFECT FOR ENTERTAINING...Hurry at this location and at this price range it will not last!
-
2025-11-14$179,900 Active 450-char remark
Show marketing remark (450 chars)
Welcome home! DYNAMITE 2 Bedroom, 1.5 bath COMPLETELY REMODELED townhome in Spring Branch...ALL NEW EVERYTHING: HVAC system, paint in and out, flooring throughout, hardware, countertops, appliances, lighting...TOO MANY UPGRADES TO MENTION...Pictures tell the story on this one... End unit with only one shared wall...Beautiful fenced in large patio back yard PERFECT FOR ENTERTAINING...Hurry at this location and at this price range it will not last!
-
2025-07-22soldstatus
-
2025-07-07soldstatus
-
1988-01-02soldstatus
ⓘ Source: listings_history table (triggers on properties + properties_extension) + one-shot
backfill from property_details.listing_events for pre-trigger history.
Tax reassessment forecast TX · Resets to sale price
- Current annual tax
- $2,230 · $186/mo
- Projected year-2 tax
- $2,743 · $229/mo
- Expected delta
- +$513/yr (+$43/mo · 23.0%)
ⓘ Screening estimate from a state-policy table — verify with the county assessor before closing.
Climate risk First Street
- Flood 3/10 Moderate FEMA zone X (shaded) · 20% chance over 30 yrs
- Wildfire 1/10 Low
- Heat 9/10 Extreme 7 d/yr ≥109°F today · 24 d/yr by 30 yrs out
- Wind 9/10 Extreme 99% chance of damaging wind over 30 yrs
- Air quality 3/10 Moderate 3 unhealthy d/yr today · 3 by 30 yrs out
Nearby sold comps map
Loading sold comps map…
Walkable amenities ~0.75 mi
Loading nearby amenities…
Taxation est. · year 1
- Rental income
- $17,898
- − Mortgage interest
- −$8,397
- − Property taxes
- −$2,230
- − Insurance
- −$750
- − Repairs & maintenance
- −$1,432
- − Management
- −$1,432
- − Depreciation
- −$4,361
- Taxable loss
- −$702
- Est. tax savings @ 24.0%
- +$168
- After-tax cash flow
- $1,896/yr
For passive investors: Depreciation is non-cash, so a rental often shows a tax loss while cash-flowing — sheltering income. Rental losses are passive: they offset passive income freely, and up to $25,000/yr can offset ordinary (W-2) income if you actively participate and your MAGI is under $100k (phasing out to $0 by $150k); unused losses carry forward. On sale, claimed depreciation is recaptured at up to 25%, and gains may owe capital-gains tax (a 1031 exchange can defer both). Figures are a year-1 estimate at your 24.0% rate — not tax advice; consult a CPA.
Schools (NCES district)
- District
- Spring Branch ISD
- NCES district ID
- 4841100
- Math proficiency
- 47% ▼ -4.00%
- Reading proficiency
- 46% ▼ -1.00%
- Median HH income
- $60,311
- Composite
- 40.88/100
- National rank
- #3624
- State rank
- #215 of 826 in TX
Livability — Houston
- Score
- 74/100
- State rank
- #184
- US rank
- #4771
Category grades
Schools grade is shown separately in the Schools card above.
Census & demographics
- Census place
- Houston, TX
- County
- Harris County · 4,702,590 people
- City population
- 3,226,434
- Metro
- Houston-The Woodlands-Sugar Land, TX
- Population (ZIP)
- 47,638
- Household income
- $62,134
- Rent vs Own
- Severe rent burden
- 2296.0
Population outlook (Harris County) Hauer SSP2
- Today (2025)
- 5,571,493 people
- By 2030
- 6,089,821 · +9.3%
- By 2040
- 7,142,806 · +28.2%
- By 2050
- 8,185,864 · +46.9%
- By 2075
- 10,574,329 · +89.8%
- By 2100
- 12,109,958 · +117.4%
Race, ethnicity, and origin ACS 2023
- Neighborhood character
- Predominantly Hispanic (71%)
- Race & ethnicity
- Hispanic / Latino 71% Two or more races 19% White 18% Asian 5% Black 5% Native American 1%
- Hispanic origin (detail)
- Mexican 44% Cuban 1%
- Common ancestry
- Lithuanian 2% Romanian 1% Slovak 1%
- Foreign-born
- 42% · Canada, Vietnam, South Korea
- Languages at home
- 33% English-only · Spanish 62% Vietnamese 1% Other Indo-European 1%
Political lean MEDSL · Harris
- 2024 margin
- Lean D (+5.5) · D 52.0% · R 46.4% · Other 1.6%
- 2008→2024 swing
- +3.9pp toward D · 2008: 1.6pp · 2024: 5.5pp
- All cycles
- 2024: D+5.5 2020: D+13.3 2016: D+12.4 2012: D+0.1 2008: D+1.6
Not yet ingested
- Civics
- —
Market trends
- HPI YoY
- ▼ -240.33%
- Current HPI
- 266.9663
- Rent YoY
- ▼ -1.57%
- Metro
- Houston-The Woodlands-Sugar Land, TX
- State GDP YoY
- ▲ 3.95%
- F500 in state
- 110
Industry mix (Fortune 500 HQ in TX)
| Industry | F500 HQs | Revenue |
|---|---|---|
| Energy | 16 | $1,198B |
|
||
| Technology | 5 | $198B |
|
||
| Engineering / Construction | 4 | $72B |
|
||
| Energy Services | 3 | $60B |
|
||
| Utilities | 3 | $41B |
|
||
| Healthcare | 2 | $330B |
|
||
Price history
-99.1% since first listed7 events — show timeline
- 2026-04-30 Listed for Rent $1,695 HARMLS
- 2026-02-20 Price Changed $159,900 HARMLS
- 2026-01-19 Price Changed $169,900 HARMLS
- 2025-11-14 Listed $179,900 HARMLS
- 2025-07-22 Sold (Public Records) — Public Records
- 2025-07-07 Sold (Public Records) — Public Records
- 1988-01-02 Sold (Public Records) — Public Records
Property tax history
+3.1%/yrLatest (2025): $2,230 · +8.4% YoY. Source: county tax records.
Cash-flow waterfall
monthlySold comps — $/sqft
last 12 mo · ≤1 miLoading sold comps…