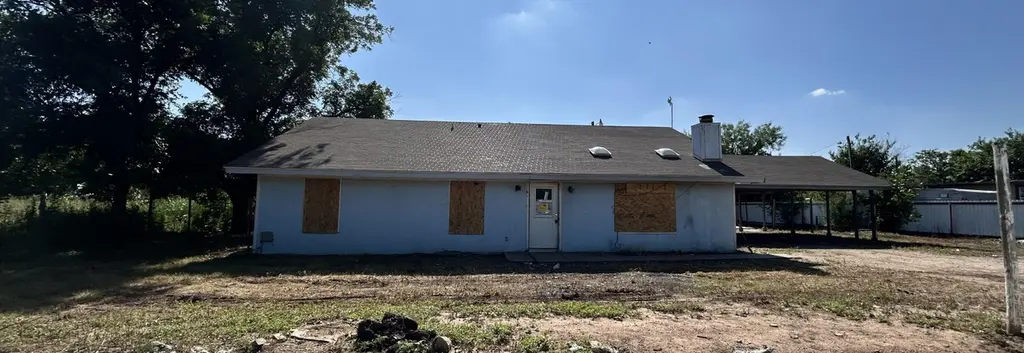
9769 Possum Hollow Rd · Grape Creek, TX
Flood risk 1/10 · Minimal
- FEMA flood zone
- X (unshaded)
- Chance of flooding over 30 yrs
- 0.0%
- Est. flood insurance / yr
- $507 – $1,088
Fire risk 7/10 · Major
- Est. fire insurance / yr
- $1,222 – $2,270
Heat risk 7/10 · Major
- Hot days now (above 103°F)
- 7 days/yr
- Hot days in 30 yrs
- 24 days/yr
Wind risk 4/10 · Minor
- Chance of severe wind over 30 yrs
- 17.0%
Air-quality risk 2/10 · Minimal
- Unhealthy air days now
- 0 days/yr
- Unhealthy air days in 30 yrs
- 1 days/yr
Risk factors via First Street. Map © Google.
Why this score? — see what drove the B+ grade
The composite is a weighted blend of 9 inputs, each scored 0–100. Each bar is that input's sub-score; the figure is the points it added to the 100-point composite (weight × sub-score).
- Cash flow +30.0/30.0
- 1% rule +10.0/10.0
- DSCR +10.0/10.0
- Appreciation +10.0/10.0
- ARV discount +7.5/15.0
- Rent growth +3.9/5.0
- Livability +3.4/5.0
- Condition / age +2.5/5.0
- Schools +2.4/10.0
$64,900
🖨 Deal sheet (PDF) 📄 Offer letter ✓ Due diligence
Listing remarks
Calling all investors, flippers, and cash buyers! This property offers a blank canvas for your next renovation project. Situated on a spacious lot, this single-story home features a large open living area with vaulted ceilings, and a functional floor plan ready for transformation. Bring your Vision and Contractor—this property is ready for a makeover! Sold As-Is!
Key facts
- Spacious lot
- 0.45 acre lot
- 2 parking spots
Tags
Property features AI
Exterior
- Parking: Carport (2 spaces); Driveway
- Utilities: Other water source
- Home design: Single family residence; One story; Fixer condition
- Construction: Stucco construction; Shingle roof; Slab foundation; Built as residential single family
- Exterior features: Patio; Paved public road access; City street frontage; Approximately 0.46 acre lot
Interior
- Flooring: Concrete flooring; Tile flooring
- Bathrooms: 2 full bathrooms
- Heating & cooling: Ceiling fans for cooling; No central heating listed
- Interior features: Ceiling fan(s); Living room fireplace
Neighborhood map
What this means for you Summary
Snapshot
- This is a 3-bed/2.0-bath single-family listed at $65k.
Deal economics
- At list price, monthly cash flow is $754 ($9k/yr) — positive.
- The deal already cash-flows at list — no discount required.
- Meets the 1% rule at list price ($2k rent vs $65k).
- Cap rate 20.2% vs local median 2.6% in Grape Creek — top-decile yield for the area; either an underpriced asset or a hidden risk that comps aren't pricing in. Stress-test before assuming the spread holds.
Location & tenants
- Location reads 67/100 on livability (#545 in TX) — a middle-class / working-renter tenant base. Strengths: cost of living A+, housing A+, crime B; Watch: health & safety C-, amenities F, commute F.
- Grape Creek ISD (rural): math 25% / reading 29% proficiency, ranked #675 of 826 in TX (top 82%) — low school quality limits family demand, transient renter base, plan for 1-2y turnover.
- Zoned schools: Grape Creek Pri (316 students, 74% FRL); Grape Creek Middle (math 18% / reading 26%, grade F, #1,360 of 1,662 statewide, top 83%, 270 students, 60% FRL); Grape Creek H S (math 27% / reading 37%, grade F, #1,044 of 1,632 statewide, top 66%, 308 students, 63% FRL).
- Market conditions: Rents rising fast (+5.8%/yr); 331 active listings in the ZIP; 233 units permitted in Tom Green County in 2024 (0 in 5+ unit buildings).
Forward outlook
- In year one you build about $7k of equity ($449 loan paydown + $6k appreciation (10.0% local appreciation)).
- Tom Green County population projected at +35% by 2050 — long-run rental-demand tailwind backs the buy-and-hold thesis.
- At projected returns (10.0% appreciation + 5.8% rent growth), your $18k cash investment doubles in ~2 years — after that, you're playing with house money.
- By year 5, paydown + projected appreciation supports a ~$32k cash-out refi (75% LTV) — recoverable capital for the next deal without selling this one.
Negotiation context
- Only 11 days on market — expect competitive offers; lowballing is unlikely to land.
- 2 sale attempts with the ask held roughly flat each time — persistent listings suggest the price (not the market) is what's stuck; bring a comps-based counter.
Risks & watch-outs
- Watch-outs: property tax is 3.4% of price.
- Climate carrying-cost: major wildfire risk; extreme-heat days projected 7→24/yr by 2055 (HVAC capex compounding) — expect insurance premiums to compound above CPI over the hold.
Questions for the listing agent
- Property tax is high relative to price — has the assessment been appealed recently, and will the sale trigger a re-assessment?
- Is there a deadline driving the sale (1031 exchange, divorce, estate, relocation)? That informs how much negotiation room exists.
- Schools are F-rated, which usually means shorter tenancies and higher turnover. Who's the typical renter profile here, and what's been the actual vacancy rate?
- What's the average days-on-market for RENTAL listings here right now (not sales)? A rising rental-DOM trend means longer vacancies and softer asking-rent achievability than the comps imply.
- What's the recent tenant-quality profile in this submarket — average credit score on applications, eviction rate, late-payment / NSF rate, and stable-employment percentage? A property-management company in the area should have these aggregated.
- How much new for-sale + rental construction is in the pipeline within 1–3 miles? Heavy new supply typically softens prices + rents 12–24 months out; constrained supply supports both.
Investment metrics
- 1% rule
- 2.55% ✓
- Cap rate
- 20.24%
- Cash-on-cash
- 49.82%
- DSCR
- 3.22
- GRM
- 3.3
CMA / ARV
- ARV (on-the-fly)
- $232,440
- Comps found
- 8
Show comp detail 8 sales within ~0.75 mi
| Address | Dist | Beds/Ba | Sqft | Sold | Price | $/sf | Match |
|---|---|---|---|---|---|---|---|
| 10094 Cottontail Ln | 0.37mi | 3/2.0 | 1,495 (-4%) | 1mo | $245,500 | $164 | 75 |
| 7686 Chaparral Run Rd | 0.37mi | 3/2.0 | 1,392 (-11%) | 4mo | $225,000 | $162 | 62 |
| 7685 Chaparral Run Rd | 0.37mi | 3/2.0 | 1,746 (+12%) | 2mo | $165,000 | $95 | 61 |
| 7730 Sandpiper Way | 0.44mi | 3/2.0 | 1,646 (+6%) | 14mo | $225,000 | $137 | 59 |
| 9917 Cottontail Ln | 0.27mi | 3/2.0 | 1,672 (+7%) | 20mo | $215,000 | $129 | 58 |
| 7705 Whippoorwill Way | 0.64mi | 3/2.0 | 1,650 (+6%) | 6mo | $105,000 | $64 | 56 |
| 7638 Skylark Ln | 0.32mi | 3/2.0 | 1,460 (-6%) | 23mo | $299,900 | $205 | 56 |
| 9942 Mt Nebo Rd | 0.33mi | 4/2.0 (+1) | 1,508 (-3%) | 24mo | $225,000 | $149 | 54 |
Match score weights: distance 35% · size 25% · config 20% · recency 20%. Top-matched comps best support the ARV.
Projected returns pro-forma
10.0% appreciation · 5.78% rent growth · sell at horizon
- IRR
- 65.8%
- Equity multiple
- 5.86×
- Total profit
- $88,232
- Equity at exit
- $58,467
- IRR
- 60.6%
- Equity multiple
- 13.82×
- Total profit
- $233,002
- Equity at exit
- $126,086
Cash invested: $18,172 (down + closing). Projections, not guarantees.
Landlord ↔ Tenant lean methodology
- Overall (STATE)
- 87 Strongly Landlord-Friendly
- State Texas
- 87 Strongly Landlord-Friendly · R+5
- County
- — inherits STATE
- City
- — inherits STATE
ZIP-level market 76901
- Home prices YoY
- 6.4%
- Rents YoY
- 5.8%
- Active inventory
- 331
- Price-to-rent
- 3.3×
Monthly cashflow live
- Estimated rent
- $1,652 medium interval (Pro) →
- Mortgage (P&I)
- −$340
- Tax from tax record
- −$184 /mo · $2,202/yr
- Insurance
- −$27
- HOA
- −$0
- Vacancy / Maint / Mgmt
- −$347
- Net cashflow
- $754
Break-even live
Sensitivity live
| Price | -10% $791 | -5% $773 | +0% $754 | +5% $736 | +10% $718 |
|---|---|---|---|---|---|
| Rent | -10% $624 | -5% $689 | +0% $754 | +5% $820 | +10% $885 |
| Rate | -1.0pp $787 | -0.5pp $771 | base $754 | +0.5pp $738 | +1.0pp $720 |
UW: 25.0% down · 7.5% · 30yr · 1.5% tax · 5.0% vac · 8.0% maint · 8.0% mgmt
Financing live
Cash to close
- Down payment
- $16,225
- Closing costs
- $1,947
- Reserves months
- —
- Total cash needed
- —
Loan-product check · same deal, 3 products live
Conventional
25% down · 7.5% · 30yr
- Down + closing
- —
- Monthly P&I
- —
- Monthly cashflow
- —
- DSCR
- —
- Eligible?
- —
Personal DTI + credit; lowest rate.
DSCR
20% down · 8.5% · 30yr
- Down + closing
- —
- Monthly P&I
- —
- Monthly cashflow
- —
- DSCR
- —
- Eligible?
- —
No personal income docs; deal must DSCR.
Hard money
10% down · 12.0% · 12mo
- Down + closing
- —
- Monthly P&I
- —
- Monthly cashflow
- —
- DSCR
- —
- Eligible?
- —
Short-term bridge; refi at stabilization.
Listing history 10 events
-
2026-06-19days on market $64,900 Active 11 DOM
-
2026-06-18days on market $64,900 Active 10 DOM
-
2026-06-17days on market $64,900 Active 9 DOM
-
2026-06-16days on market $64,900 Active 8 DOM
-
2026-06-15days on market $64,900 Active 7 DOM
-
2026-06-14days on market $64,900 Active 5 DOM
-
2026-06-13days on market $64,900 Active 4 DOM
-
2026-06-10days on market $64,900 Active 2 DOM
-
2026-06-09remarks 365-char remark
-
2026-06-09$64,900 Active 1 DOM
ⓘ Source: listings_history table (triggers on properties + properties_extension) + one-shot
backfill from property_details.listing_events for pre-trigger history.
Tax reassessment forecast TX · Resets to sale price
- Current annual tax
- $2,202 · $184/mo
- Projected year-2 tax
- $2,202 · $184/mo
- Expected delta
- $0/yr ($0/mo · 0.0%)
ⓘ Screening estimate from a state-policy table — verify with the county assessor before closing.
Climate risk First Street
- Flood 1/10 Low FEMA zone X (unshaded) · 0% chance over 30 yrs
- Wildfire 7/10 Severe
- Heat 7/10 Severe 7 d/yr ≥103°F today · 24 d/yr by 30 yrs out
- Wind 4/10 Moderate 17% chance of damaging wind over 30 yrs
- Air quality 2/10 Low 0 unhealthy d/yr today · 1 by 30 yrs out
Nearby sold comps map
Loading sold comps map…
Walkable amenities ~0.75 mi
Loading nearby amenities…
Taxation est. · year 1
- Rental income
- $19,827
- − Mortgage interest
- −$3,635
- − Property taxes
- −$2,202
- − Insurance
- −$324
- − Repairs & maintenance
- −$1,586
- − Management
- −$1,586
- − Depreciation
- −$1,888
- Taxable income
- $8,605
- Est. tax owed @ 24.0%
- −$2,065
- After-tax cash flow
- $6,988/yr
For passive investors: Depreciation is non-cash, so a rental often shows a tax loss while cash-flowing — sheltering income. Rental losses are passive: they offset passive income freely, and up to $25,000/yr can offset ordinary (W-2) income if you actively participate and your MAGI is under $100k (phasing out to $0 by $150k); unused losses carry forward. On sale, claimed depreciation is recaptured at up to 25%, and gains may owe capital-gains tax (a 1031 exchange can defer both). Figures are a year-1 estimate at your 24.0% rate — not tax advice; consult a CPA.
Schools (NCES district)
- District
- Grape Creek ISD
- NCES district ID
- 4821600
- Math proficiency
- 25% ▼ -12.00%
- Reading proficiency
- 29% ▲ 1.00%
- Median HH income
- $48,891
- Composite
- 23.6/100
- National rank
- #7849
- State rank
- #675 of 826 in TX
Livability — Grape Creek
- Score
- 67/100
- State rank
- #545
- US rank
- #10581
Category grades
Schools grade is shown separately in the Schools card above.
Census & demographics
- Census place
- Grape Creek, TX
- County
- Tom Green County · 113,188 people
- Metro
- San Angelo, TX
- Population (ZIP)
- 31,831
- Household income
- $69,450
- Rent vs Own
- Severe rent burden
- 1034.0
Population outlook (Tom Green County) Hauer SSP2
- Today (2025)
- 135,110 people
- By 2030
- 144,090 · +6.6%
- By 2040
- 162,561 · +20.3%
- By 2050
- 182,158 · +34.8%
- By 2075
- 232,274 · +71.9%
- By 2100
- 268,218 · +98.5%
Race, ethnicity, and origin ACS 2023
- Neighborhood character
- Majority White (55%)
- Race & ethnicity
- White 55% Hispanic / Latino 41% Two or more races 17% Black 2%
- Hispanic origin (detail)
- Mexican 38%
- Common ancestry
- Lithuanian 3% Slovak 3% Iranian 1%
- Foreign-born
- 5% · Canada
- Languages at home
- 77% English-only · Spanish 21% German/W. Germanic 1%
Political lean MEDSL · Tom Green
- 2024 margin
- Solid R (+48.0) · D 25.5% · R 73.5% · Other 1.0%
- 2008→2024 swing
- -6.3pp toward R · 2008: -41.7pp · 2024: -48.0pp
- All cycles
- 2024: R+48.0 2020: R+44.4 2016: R+47.9 2012: R+47.9 2008: R+41.7
Not yet ingested
- Civics
- —
Market trends
- HPI YoY
- ▲ 47.96%
- Current HPI
- 798.58
- Rent YoY
- ▲ 5.78%
- Metro
- San Angelo, TX
- State GDP YoY
- ▲ 3.95%
- F500 in state
- 110
Industry mix (Fortune 500 HQ in TX)
| Industry | F500 HQs | Revenue |
|---|---|---|
| Energy | 16 | $1,198B |
|
||
| Technology | 5 | $198B |
|
||
| Engineering / Construction | 4 | $72B |
|
||
| Energy Services | 3 | $60B |
|
||
| Utilities | 3 | $41B |
|
||
| Healthcare | 2 | $330B |
|
||
Price history
-64.0% since first listed9 events — show timeline
- 2026-06-08 Listed $64,900 SAAR TX
- 2026-04-27 Listing Removed — LERA
- 2026-04-24 Price Changed $102,400 LERA
- 2026-04-10 Price Changed $119,500 LERA
- 2026-03-25 Price Changed $139,000 LERA
- 2026-03-10 Price Changed $155,900 LERA
- 2026-02-19 Listed $180,200 LERA
- 2008-10-24 Sold (Public Records) — Public Records
- 2005-06-03 Sold (Public Records) — Public Records
Property tax history
+2.6%/yrLatest (2025): $2,202 · +4.0% YoY. Source: county tax records.
Cash-flow waterfall
monthlySold comps — $/sqft
last 12 mo · ≤1 miLoading sold comps…