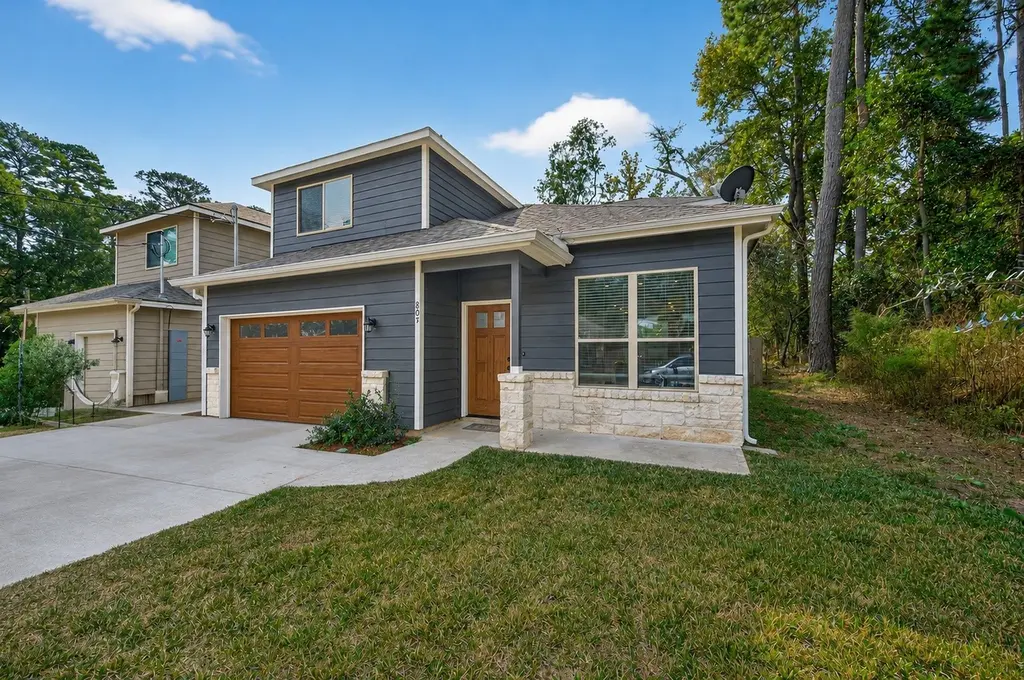
804 Pearl River Dr · Conroe, TX
Flood risk 1/10 · Minimal
- FEMA flood zone
- X (unshaded)
- Chance of flooding over 30 yrs
- 0.0%
- Est. flood insurance / yr
- $507 – $1,088
Fire risk 4/10 · Minor
- Est. fire insurance / yr
- $1,222 – $2,270
Heat risk 8/10 · Major
- Hot days now (above 111°F)
- 7 days/yr
- Hot days in 30 yrs
- 23 days/yr
Wind risk 8/10 · Major
- Chance of severe wind over 30 yrs
- 99.0%
Air-quality risk 2/10 · Minimal
- Unhealthy air days now
- 1 days/yr
- Unhealthy air days in 30 yrs
- 1 days/yr
Risk factors via First Street. Map © Google.
Why this score? — see what drove the D+ grade
The composite is a weighted blend of 9 inputs, each scored 0–100. Each bar is that input's sub-score; the figure is the points it added to the 100-point composite (weight × sub-score).
- Cash flow +15.8/30.0
- ARV discount +7.7/15.0
- Schools +5.4/10.0
- DSCR +4.9/10.0
- 1% rule +4.8/10.0
- Livability +3.7/5.0
- Rent growth +2.6/5.0
- Condition / age +2.5/5.0
- Appreciation +0.0/10.0
$299,999
🖨 Deal sheet 📄 Offer letter ✓ Due diligence
Listing remarks
Perfect starter home is waiting you! 4 bedroom/ 2.5 bath home that's only 3 years old! If your looking for something different with some personality instead of the same old cookie cutter homes. .you just found it! Excellent condition and move in ready. Walk in to 10'ceilings in kitchen and Living room. The home features an open concept plan with primary bedroom downstairs and 3 additional bedrooms on the second floor with large walk in closets. Spacious kitchen with 42" upper cabinets, large island, granite counter tops, stainless steel appliances with easy clean top range and electric oven, 3 rack dishwasher, and microwave. Extra large backyard with plenty of space for playing catch o
Key facts
- Open concept plan
- 10 ceilings
- Spacious kitchen
Tags
Property features AI
Finance
- Other: Has additional parcels
- HOA & community: Community managed by IMC Property Management; Annual association fee of $125
Exterior
- Parking: Attached garage (1 space)
- Security: Smoke detector(s)
- Utilities: Public water; Septic tank sewer
- Home design: Residential property; Built in 2021; Slab foundation; Composition roof; Cement siding with stone accents
- Construction: Cement siding; Stone exterior; Composition roof; Slab foundation
- Exterior features: Subdivision lot; Concrete road frontage; Smoke detector(s)
Interior
- Kitchen: Dishwasher; Electric oven; Free‑standing range; Disposal; Microwave
- Bedrooms: Primary bedroom on the first floor (14 x 13); Three additional bedrooms on the second floor (14 x 11; 13 x 11; 13 x 12)
- Flooring: Carpet; Plank; Vinyl
- Bathrooms: Two full bathrooms; One half bathroom
- Heating & cooling: Central heating (electric); Central air conditioning (electric); Attic fan
- Interior features: High ceilings; Kitchen island; Kitchen/family room combo; Pantry; Tub with shower; Kitchen/dining combo; Living/dining room; Programmable thermostat; Low emissivity windows
- Laundry & utility: Washer hookup; Electric dryer hookup
Neighborhood map
What this means for you Summary
Snapshot
- This is a 4-bed/2.5-bath single-family listed at $300k.
Deal economics
- At list price, monthly cash flow is $139 ($2k/yr) — positive.
- The deal already cash-flows at list — no discount required.
- To meet the 1% rule (rent ≥ 1% of price), the offer needs to be $293k (2.2% below list).
- Recommended offer: $293k (2.2% below list) — sets the bar for 1% rule.
- Cap rate 6.8% vs local median 3.1% in Conroe — top-decile yield for the area; either an underpriced asset or a hidden risk that comps aren't pricing in. Stress-test before assuming the spread holds.
Location & tenants
- Location reads 74/100 on livability (#169 in TX, #4,447 nationally) — a middle-class / working-renter tenant base. Strengths: cost of living A+, housing A+, amenities B; Watch: commute F, health & safety F.
- Montgomery ISD (rural): math 63% / reading 57% proficiency, ranked #49 of 826 in TX (top 6%) — acceptable for families but not a draw, mixed tenant base, ~2y average lease.
- Zoned schools: Lake Creek H S (math 53% / reading 68%, grade C+, #268 of 1,632 statewide, top 17%, 1,649 students, 23% FRL) — zoned schools at 23% FRL track the district average.
- Market conditions: Rents flat; 2283 active listings in the ZIP; 12 comparable units currently listed for rent nearby; rentals at typical pace (median 21d on market — plan ~3-4 weeks tenant-placement turnaround); 42% of comp listings sitting > 30 days — soft ceiling on asking rent; high-income renter base; 13,259 units permitted in Montgomery County in 2024 (1,402 in 5+ unit buildings).
Forward outlook
- Local home prices are declining (-3.0%/yr); year-one equity from $2k of loan paydown is wiped out by about $9k of value loss. Plan a longer hold.
- Montgomery County population projected at +65% by 2050 — long-run rental-demand tailwind backs the buy-and-hold thesis.
Negotiation context
- It's been on market 18 days — a 2% lower offer ($295k) is reasonable based on typical stale-listing flexibility.
- 5 sale attempts since 4y ago with the ask held roughly flat each time — persistent listings suggest the price (not the market) is what's stuck; bring a comps-based counter.
Risks & watch-outs
- Climate carrying-cost: severe wind risk, 99% chance of damaging wind over 30y; extreme-heat days projected 7→23/yr by 2055 (HVAC capex compounding) — expect insurance premiums to compound above CPI over the hold.
Questions for the listing agent
- What does the HOA fee cover, when was the last increase, and are there any pending special assessments or reserve-fund shortfalls?
- Is there a deadline driving the sale (1031 exchange, divorce, estate, relocation)? That informs how much negotiation room exists.
- Schools are D-rated, which usually means shorter tenancies and higher turnover. Who's the typical renter profile here, and what's been the actual vacancy rate?
- The area grade is low — what's the realistic commute time and amenity access for the typical tenant pool here? Any planned neighborhood developments (good or bad) we should know about?
- What's the average days-on-market for RENTAL listings here right now (not sales)? A rising rental-DOM trend means longer vacancies and softer asking-rent achievability than the comps imply.
- What's the recent tenant-quality profile in this submarket — average credit score on applications, eviction rate, late-payment / NSF rate, and stable-employment percentage? A property-management company in the area should have these aggregated.
- How much new for-sale + rental construction is in the pipeline within 1–3 miles? Heavy new supply typically softens prices + rents 12–24 months out; constrained supply supports both.
Investment metrics
- 1% rule
- 0.98% ✗
- Cap rate
- 6.85%
- Cash-on-cash
- 1.99%
- DSCR
- 1.09
- GRM
- 8.5
CMA / ARV
- ARV (on-the-fly)
- $301,392
- Comps found
- 12
Show comp detail 12 sales within ~0.75 mi
| Address | Dist | Beds/Ba | Sqft | Sold | Price | $/sf | Match |
|---|---|---|---|---|---|---|---|
| 907 Crystal River Rd | 0.17mi | 4/2.5 | 1,829 (-5%) | 6mo | $270,000 | $148 | 78 |
| 907 Columbia River Rd | 0.28mi | 3/2.0 (-1) | 1,784 (-8%) | 1mo | $383,000 | $215 | 67 |
| 537 Mohawk Bnd | 0.66mi | 3/2.5 (-1) | 1,920 (-1%) | 5mo | $300,000 | $156 | 59 |
| 1608 Mohawk Dr | 0.67mi | 3/2.0 (-1) | 1,896 (-2%) | 2mo | $500,000 | $264 | 57 |
| 1100 Papoose Trl | 0.29mi | 4/3.0 | 2,208 (+14%) | 5mo | $440,000 | $199 | 56 |
| 256 Mesa Vw | 0.73mi | 3/2.0 (-1) | 1,901 (-2%) | 1mo | $275,000 | $145 | 56 |
| 412 Harlow Dr | 0.73mi | 3/2.5 (-1) | 1,826 (-6%) | 6mo | $219,990 | $120 | 47 |
| 132 Golfview Dr | 0.65mi | 3/2.0 (-1) | 1,792 (-7%) | 4mo | $299,000 | $167 | 47 |
| 428 Harlow Dr | 0.71mi | 3/2.5 (-1) | 1,826 (-6%) | 8mo | $252,000 | $138 | 47 |
| 444 Harlow Dr | 0.71mi | 3/2.5 (-1) | 1,826 (-6%) | 10mo | $229,990 | $126 | 45 |
| 448 Harlow Dr | 0.71mi | 4/2.5 | 2,121 (+10%) | 9mo | $249,990 | $118 | 43 |
| 90 Summers Wind St | 0.75mi | 3/2.5 (-1) | 2,157 (+12%) | 8mo | $365,000 | $169 | 34 |
Match score weights: distance 35% · size 25% · config 20% · recency 20%. Top-matched comps best support the ARV.
Projected returns pro-forma
-3.0% appreciation · 0.4% rent growth · sell at horizon
- IRR
- -16.2%
- Equity multiple
- 0.44×
- Total profit
- $-47,121
- Equity at exit
- $44,731
- IRR
- -13.6%
- Equity multiple
- 0.31×
- Total profit
- $-58,309
- Equity at exit
- $25,938
Cash invested: $84,000 (down + closing). Projections, not guarantees.
Landlord ↔ Tenant lean methodology
- Overall (STATE)
- 87 Strongly Landlord-Friendly
- State Texas
- 87 Strongly Landlord-Friendly · R+5
- County
- — inherits STATE
- City
- — inherits STATE
ZIP-level market 77316
- Home prices YoY
- -10.7%
- Rents YoY
- 0.4%
- Active inventory
- 2283
- Price-to-rent
- 8.5×
Monthly cashflow live
- Estimated rent
- $2,933 high interval (Pro) →
- Mortgage (P&I)
- −$1,573
- Tax from tax record
- −$469 /mo · $5,633/yr
- Insurance
- −$125
- HOA
- −$10
- Vacancy / Maint / Mgmt
- −$616
- Net cashflow
- $139
Break-even live
UW: 25.0% down · 7.5% · 30yr · 1.5% tax · 5.0% vac · 8.0% maint · 8.0% mgmt
Financing live
Cash to close
- Down payment
- $75,000
- Closing costs
- $9,000
- Reserves months
- —
- Total cash needed
- —
Loan-product check · same deal, 3 products live
Conventional
25% down · 7.5% · 30yr
- Down + closing
- —
- Monthly P&I
- —
- Monthly cashflow
- —
- DSCR
- —
- Eligible?
- —
Personal DTI + credit; lowest rate.
DSCR
20% down · 8.5% · 30yr
- Down + closing
- —
- Monthly P&I
- —
- Monthly cashflow
- —
- DSCR
- —
- Eligible?
- —
No personal income docs; deal must DSCR.
Hard money
10% down · 12.0% · 12mo
- Down + closing
- —
- Monthly P&I
- —
- Monthly cashflow
- —
- DSCR
- —
- Eligible?
- —
Short-term bridge; refi at stabilization.
Rent comps 12 comps
| Address | Beds | Baths | Sqft | Rent | $/sqft | DOM | Units | Dist |
|---|---|---|---|---|---|---|---|---|
| 702 Crystal River Rd Montgomery, TX | 4.0 | 2.5 | 1820 | $4,000 | $2.20 | 44d | 1 | 0.04mi |
| 15310 Abella Dr Montgomery, TX | 3.0 | 2.0 | 1412 | $1,720 | $1.22 | 2d | 1 | 0.78mi |
| 613 Craven St Montgomery, TX | 3.0 | 2.0 | 1716 | $1,610 | $0.94 | 44d | 1 | 0.88mi |
| 15242 Abella Dr Montgomery, TX | 4.0 | 2.5 | 1881 | $1,780 | $0.95 | 4d | 1 | 0.90mi |
| 15231 Abella Dr Montgomery, TX | 3.0 | 2.0 | 1922 | $1,760 | $0.92 | 21d | 1 | 0.91mi |
| 632 Levine Ct Montgomery, TX | 4.0 | 2.5 | 2239 | $2,275 | $1.02 | 7d | 1 | 0.95mi |
| 583 Firemoon St Montgomery, TX | 3.0 | 2.0 | 1412 | $1,650 | $1.17 | 21d | 1 | 1.02mi |
| 4777 Holly Ln W Montgomery, TX | 3.0 | 2.0 | 1704 | $1,450 | $0.85 | 18d | 1 | 1.26mi |
| 425 McCaleb Rd Montgomery, TX | 1.0–3.0 | 1.0–2.0 | 922 | $1,702 | $1.84 | 2d | 20 | 1.37mi |
| 16913 Glenheath Montgomery, TX | 4.0 | 2.5 | 1700 | $1,571 | $0.92 | 44d | 1 | 1.38mi |
| 116 Lake View Cir Montgomery, TX | 3.0 | 2.5 | 1751 | $2,250 | $1.28 | 44d | 1 | 1.38mi |
| 16984 W Juneau Montgomery, TX | 3.0 | 3.0 | 1530 | $2,900 | $1.90 | 44d | 1 | 1.39mi |
HOA detail
- Monthly dues
- $10 · $120/yr
- Likely covers
- electric
Listing history 14 events
-
2026-06-18days on market $299,999 Active 18 DOM
-
2026-06-17days on market $299,999 Active 17 DOM
-
2026-06-16days on market $299,999 Active 16 DOM
-
2026-06-15days on market $299,999 Active 15 DOM
-
2026-06-13days on market $299,999 Active 13 DOM
-
2026-06-13days on market $299,999 Active 12 DOM
-
2026-06-09days on market $299,999 Active 9 DOM
-
2026-06-08days on market $299,999 Active 8 DOM
-
2026-06-07days on market $299,999 Active 7 DOM
-
2026-06-04days on market $299,999 Active 4 DOM
-
2026-06-03days on market $299,999 Active 3 DOM
-
2026-06-02days on market $299,999 Active 2 DOM
-
2026-06-01remarks 694-char remark
-
2026-06-01$299,999 Active 1 DOM
ⓘ Source: listings_history table (triggers on properties + properties_extension) + one-shot
backfill from property_details.listing_events for pre-trigger history.
Tax reassessment forecast TX · Resets to sale price
- Current annual tax
- $5,633 · $469/mo
- Projected year-2 tax
- $5,633 · $469/mo
- Expected delta
- $0/yr ($0/mo · 0.0%)
ⓘ Screening estimate from a state-policy table — verify with the county assessor before closing.
Climate risk First Street
- Flood 1/10 Low FEMA zone X (unshaded) · 0% chance over 30 yrs
- Wildfire 4/10 Moderate
- Heat 8/10 Severe 7 d/yr ≥111°F today · 23 d/yr by 30 yrs out
- Wind 8/10 Severe 99% chance of damaging wind over 30 yrs
- Air quality 2/10 Low 1 unhealthy d/yr today · 1 by 30 yrs out
Nearby sold comps map
Loading sold comps map…
Walkable amenities ~0.75 mi
Loading nearby amenities…
Taxation est. · year 1
- Rental income
- $35,192
- − Mortgage interest
- −$16,805
- − Property taxes
- −$5,633
- − Insurance
- −$1,500
- − Repairs & maintenance
- −$2,815
- − Management
- −$2,815
- − HOA
- −$120
- − Depreciation
- −$8,727
- Taxable loss
- −$3,224
- Est. tax savings @ 24.0%
- +$774
- After-tax cash flow
- $2,443/yr
For passive investors: Depreciation is non-cash, so a rental often shows a tax loss while cash-flowing — sheltering income. Rental losses are passive: they offset passive income freely, and up to $25,000/yr can offset ordinary (W-2) income if you actively participate and your MAGI is under $100k (phasing out to $0 by $150k); unused losses carry forward. On sale, claimed depreciation is recaptured at up to 25%, and gains may owe capital-gains tax (a 1031 exchange can defer both). Figures are a year-1 estimate at your 24.0% rate — not tax advice; consult a CPA.
Schools (NCES district)
- District
- Montgomery ISD
- NCES district ID
- 4831260
- Math proficiency
- 63% ▼ -3.00%
- Reading proficiency
- 57% ▼ -3.00%
- Median HH income
- $75,596
- Composite
- 53.55/100
- National rank
- #1445
- State rank
- #49 of 826 in TX
Livability — Conroe
- Score
- 74/100
- State rank
- #169
- US rank
- #4447
Category grades
Schools grade is shown separately in the Schools card above.
Census & demographics
- Census place
- Conroe, TX
- County
- Montgomery County · 663,713 people
- City population
- 205,417
- Metro
- Houston-The Woodlands-Sugar Land, TX
- Population (ZIP)
- 34,694
- Household income
- $124,055
- Rent vs Own
- Severe rent burden
- 273.0
Population outlook (Montgomery County) Hauer SSP2
- Today (2025)
- 713,896 people
- By 2030
- 805,263 · +12.8%
- By 2040
- 992,708 · +39.1%
- By 2050
- 1,179,590 · +65.2%
- By 2075
- 1,628,084 · +128.1%
- By 2100
- 1,937,880 · +171.5%
Race, ethnicity, and origin ACS 2023
- Neighborhood character
- Predominantly White (80%)
- Race & ethnicity
- White 80% Hispanic / Latino 14% Two or more races 11% Black 1% Asian 1%
- Hispanic origin (detail)
- Mexican 9%
- Common ancestry
- Lithuanian 6% Slovak 3% Romanian 3%
- Foreign-born
- 6% · Canada
- Languages at home
- 90% English-only · Spanish 8%
Political lean MEDSL · Montgomery
- 2024 margin
- Solid R (+45.5) · D 26.8% · R 72.3%
- 2008→2024 swing
- +7.2pp toward D · 2008: -52.7pp · 2024: -45.5pp
- All cycles
- 2024: R+45.5 2020: R+43.8 2016: R+51.4 2012: R+60.7 2008: R+52.7
Not yet ingested
- Civics
- —
Market trends
- HPI YoY
- ▼ -31.44%
- Current HPI
- 262.6973
- Rent YoY
- ▲ 0.40%
- Metro
- Houston-The Woodlands-Sugar Land, TX
- State GDP YoY
- ▲ 3.95%
- F500 in state
- 110
Industry mix (Fortune 500 HQ in TX)
| Industry | F500 HQs | Revenue |
|---|---|---|
| Energy | 16 | $1,198B |
|
||
| Technology | 5 | $198B |
|
||
| Engineering / Construction | 4 | $72B |
|
||
| Energy Services | 3 | $60B |
|
||
| Utilities | 3 | $41B |
|
||
| Healthcare | 2 | $330B |
|
||
Price history
+22.5% since first listed18 events — show timeline
- 2026-05-31 Listed $299,999 HARMLS
- 2026-05-01 Rental Removed $2,000 HARMLS
- 2026-05-01 Listing Removed — HARMLS
- 2026-04-20 Price Changed $275,000 HARMLS
- 2026-04-15 Price Changed $2,000 HARMLS
- 2026-04-14 Price Changed $285,500 HARMLS
- 2026-04-12 Price Changed $2,200 HARMLS
- 2026-04-04 Listed for Rent $2,300 HARMLS
- 2026-03-31 Price Changed $286,500 HARMLS
- 2026-03-25 Price Changed $291,500 HARMLS
- 2026-03-09 Price Changed $294,000 HARMLS
- 2026-02-12 Price Changed $296,500 HARMLS
- 2026-01-09 Listed $299,000 HARMLS
- 2025-12-22 Listing Removed — HARMLS
- 2025-11-21 Listed $299,000 HARMLS
- 2022-03-11 Sold (MLS) — HARMLS
- 2022-02-23 Pending — HARMLS
- 2022-02-23 Listed $244,900 HARMLS
Property tax history
+39.1%/yrLatest (2025): $5,633 · -3.3% YoY. Source: county tax records.
Cash-flow waterfall
monthlySold comps — $/sqft
last 12 mo · ≤1 miLoading sold comps…