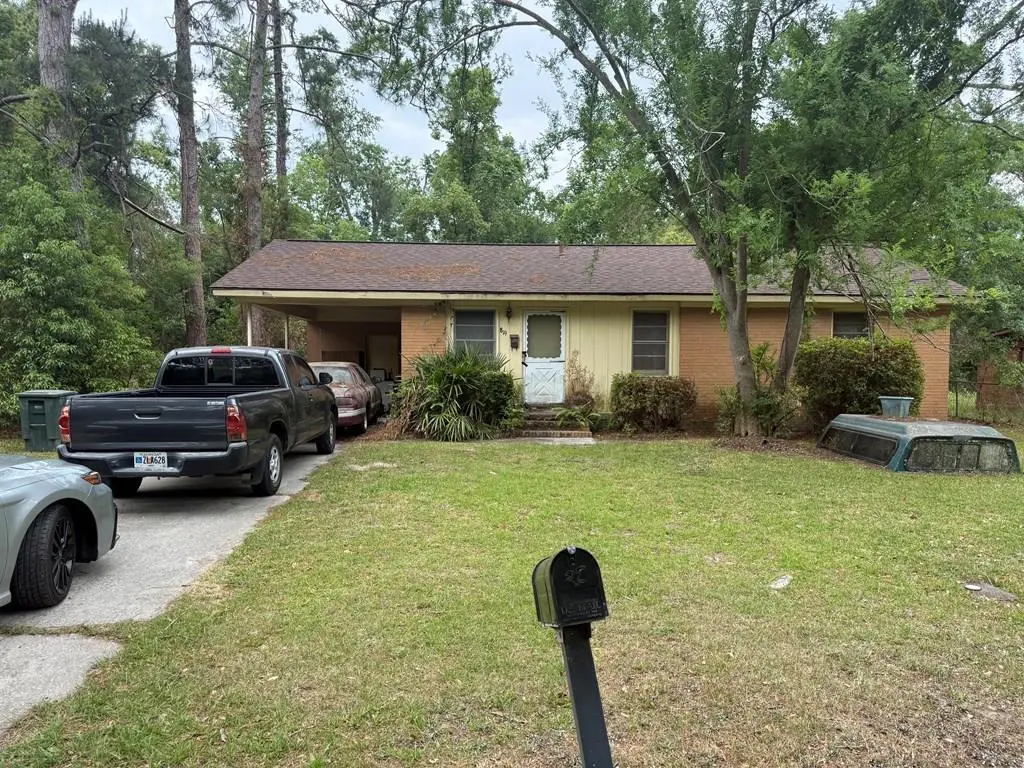
819 NE Woodlawn Dr · Valdosta, GA
Flood risk 1/10 · Minimal
- FEMA flood zone
- X (unshaded)
- Chance of flooding over 30 yrs
- 0.0%
- Est. flood insurance / yr
- $507 – $1,088
Fire risk 4/10 · Minor
- Est. fire insurance / yr
- $963 – $1,789
Heat risk 7/10 · Major
- Hot days now (above 108°F)
- 7 days/yr
- Hot days in 30 yrs
- 18 days/yr
Wind risk 8/10 · Major
- Chance of severe wind over 30 yrs
- 99.0%
Air-quality risk 6/10 · Moderate
- Unhealthy air days now
- 10 days/yr
- Unhealthy air days in 30 yrs
- 11 days/yr
Risk factors via First Street. Map © Google.
Why this score? — see what drove the C+ grade
The composite is a weighted blend of 9 inputs, each scored 0–100. Each bar is that input's sub-score; the figure is the points it added to the 100-point composite (weight × sub-score).
- Cash flow +30.0/30.0
- DSCR +10.0/10.0
- 1% rule +9.0/10.0
- Rent growth +3.5/5.0
- Livability +3.0/5.0
- Condition / age +2.5/5.0
- Schools +1.5/10.0
- ARV discount +0.7/15.0
- Appreciation +0.0/10.0
$79,900
🖨 Deal sheet 📄 Offer letter ✓ Due diligence
Key facts
- 0.24 acre lot
- Built 1965
- Listed 32 days
Property features AI
Exterior
- Utilities: Public water; Public sewer; Cable available
- Home design: Single family residence; House; 1 story
- Construction: Brick veneer and frame construction
- Exterior features: Located in the Vallotton subdivision; Zoning: R3
Interior
- Kitchen: Microwave; Refrigerator
- Bedrooms: One-story home
- Flooring: Carpet
- Bathrooms: 1 full bathroom
- Interior features: Furnished; Microwave; Refrigerator; Washer
- Laundry & utility: Washer
Neighborhood map
What this means for you Summary
Snapshot
- This is a 3-bed/1.0-bath single-family listed at $80k.
Deal economics
- At list price, monthly cash flow is $388 ($5k/yr) — positive.
- The deal already cash-flows at list — no discount required.
- Meets the 1% rule at list price ($1k rent vs $80k).
- Recommended offer: $78k (3.0% below list) — sets the bar for market timing.
- Cap rate 12.1% vs local median 4.3% in Valdosta — top-decile yield for the area; either an underpriced asset or a hidden risk that comps aren't pricing in. Stress-test before assuming the spread holds.
Location & tenants
- Location reads 60/100 on livability (#392 in GA) — a middle-class / working-renter tenant base. Strengths: cost of living A+, health & safety A+, housing A-; Watch: schools F, crime F, amenities F.
- Valdosta City (urban): math 15% / reading 22% proficiency, ranked #149 of 174 in GA (top 86%) — low school quality limits family demand, transient renter base, plan for 1-2y turnover; 74% free/reduced lunch — lower-income household profile, screen leases tightly.
- Market conditions: Rents rising fast (+4.2%/yr); 267 active listings in the ZIP; 30 comparable units currently listed for rent nearby; rentals lingering (median 44d on market — plan ~5-8 weeks vacancy on turnover, expect pricing pressure); 63% of comp listings sitting > 30 days — soft ceiling on asking rent; 896 units permitted in Lowndes County in 2024 (0 in 5+ unit buildings).
Forward outlook
- Local home prices are declining (-3.0%/yr); year-one equity from $552 of loan paydown is wiped out by about $2k of value loss. Plan a longer hold.
- Lowndes County population projected at +10% by 2050 — modest demand growth; plan on rents tracking national, not racing it.
- At projected returns (-3.0% appreciation + 4.2% rent growth), your $22k cash investment doubles in ~6 years — after that, you're playing with house money.
Negotiation context
- It's been on market 32 days — a 3% lower offer ($78k) is reasonable based on typical stale-listing flexibility.
- Current owner paid $40k; list at $80k implies a 97% gain — meaningful room to come down on a strong offer.
Risks & watch-outs
- Climate carrying-cost: severe wind risk, 99% chance of damaging wind over 30y; extreme-heat days projected 7→18/yr by 2055 (HVAC capex compounding) — expect insurance premiums to compound above CPI over the hold.
Questions for the listing agent
- It's been on market 32 days. Have you received any prior offers? Is the seller open to a 3% concession, seller financing, or rate buy-down credit?
- Built in 1965 — when were the roof, HVAC, electrical panel, plumbing, and water heater last replaced?
- Is there a deadline driving the sale (1031 exchange, divorce, estate, relocation)? That informs how much negotiation room exists.
- Schools are F-rated, which usually means shorter tenancies and higher turnover. Who's the typical renter profile here, and what's been the actual vacancy rate?
- Crime grade is F in this area — have there been break-ins, vandalism, or insurance claims at this property in the last 3 years? What carrier currently insures it and at what premium?
- What's the average days-on-market for RENTAL listings here right now (not sales)? A rising rental-DOM trend means longer vacancies and softer asking-rent achievability than the comps imply.
- What's the recent tenant-quality profile in this submarket — average credit score on applications, eviction rate, late-payment / NSF rate, and stable-employment percentage? A property-management company in the area should have these aggregated.
- How much new for-sale + rental construction is in the pipeline within 1–3 miles? Heavy new supply typically softens prices + rents 12–24 months out; constrained supply supports both.
Investment metrics
- 1% rule
- 1.40% ✓
- Cap rate
- 12.12%
- Cash-on-cash
- 20.82%
- DSCR
- 1.93
- GRM
- 5.9
CMA / ARV
- ARV (on-the-fly)
- $69,350
- Comps found
- 12
Show comp detail 12 sales within ~0.75 mi
| Address | Dist | Beds/Ba | Sqft | Sold | Price | $/sf | Match |
|---|---|---|---|---|---|---|---|
| 822 Stillwater Dr | 0.06mi | 3/1.0 | 828 (-13%) | 4mo | $33,000 | $40 | 73 |
| 1207 Leone Ave | 0.70mi | 3/1.0 | 948 (-0%) | 2mo | $68,000 | $72 | 65 |
| 722 E Jane St | 0.42mi | 3/1.0 | 1,044 (+10%) | 1mo | $76,500 | $73 | 63 |
| 6 Prince Cv | 0.40mi | 3/2.0 | 1,014 (+7%) | 6mo | $85,000 | $84 | 61 |
| 515 E Mary St | 0.70mi | 3/1.0 | 1,000 (+5%) | 2mo | $94,900 | $95 | 57 |
| 805 Ponderosa Dr | 0.57mi | 3/1.0 | 1,066 (+12%) | 1mo | $55,000 | $52 | 52 |
| 1714 Clover Dr | 0.43mi | 2/1.0 (-1) | 849 (-11%) | 7mo | $96,000 | $113 | 52 |
| 1012 N Troup St | 0.64mi | 2/1.0 (-1) | 892 (-6%) | 4mo | $13,000 | $15 | 52 |
| 703 E Cranford Ave | 0.63mi | 3/1.0 | 1,053 (+11%) | 2mo | $158,000 | $150 | 50 |
| 1400 Leone Ave | 0.73mi | 3/1.0 | 1,034 (+9%) | 1mo | $35,000 | $34 | 50 |
| 907 E Gordon St | 0.72mi | 2/1.0 (-1) | 871 (-8%) | 5mo | $23,000 | $26 | 44 |
| 1642 Lexington Cir | 0.74mi | 2/2.0 (-1) | 1,068 (+12%) | 6mo | $136,500 | $128 | 31 |
Match score weights: distance 35% · size 25% · config 20% · recency 20%. Top-matched comps best support the ARV.
Projected returns pro-forma
-3.0% appreciation · 4.19% rent growth · sell at horizon
- IRR
- 14.5%
- Equity multiple
- 1.59×
- Total profit
- $13,117
- Equity at exit
- $11,913
- IRR
- 24.0%
- Equity multiple
- 3.19×
- Total profit
- $48,891
- Equity at exit
- $6,908
Cash invested: $22,372 (down + closing). Projections, not guarantees.
Landlord ↔ Tenant lean methodology
- Overall (STATE)
- 90 Strongly Landlord-Friendly
- State Georgia
- 90 Strongly Landlord-Friendly · R+3
- County
- — inherits STATE
- City
- — inherits STATE
ZIP-level market 31602
- Rents YoY
- 4.2%
- Active inventory
- 267
- Price-to-rent
- 5.9×
Monthly cashflow live
- Estimated rent
- $1,119 high interval (Pro) →
- Mortgage (P&I)
- −$419
- Tax from tax record
- −$44 /mo · $526/yr
- Insurance
- −$33
- HOA
- −$0
- Vacancy / Maint / Mgmt
- −$235
- Net cashflow
- $388
Break-even live
UW: 25.0% down · 7.5% · 30yr · 1.5% tax · 5.0% vac · 8.0% maint · 8.0% mgmt
Financing live
Cash to close
- Down payment
- $19,975
- Closing costs
- $2,397
- Reserves months
- —
- Total cash needed
- —
Loan-product check · same deal, 3 products live
Conventional
25% down · 7.5% · 30yr
- Down + closing
- —
- Monthly P&I
- —
- Monthly cashflow
- —
- DSCR
- —
- Eligible?
- —
Personal DTI + credit; lowest rate.
DSCR
20% down · 8.5% · 30yr
- Down + closing
- —
- Monthly P&I
- —
- Monthly cashflow
- —
- DSCR
- —
- Eligible?
- —
No personal income docs; deal must DSCR.
Hard money
10% down · 12.0% · 12mo
- Down + closing
- —
- Monthly P&I
- —
- Monthly cashflow
- —
- DSCR
- —
- Eligible?
- —
Short-term bridge; refi at stabilization.
Rent comps 30 comps
| Address | Beds | Baths | Sqft | Rent | $/sqft | DOM | Units | Dist |
|---|---|---|---|---|---|---|---|---|
| 803 Lausanne Dr Valdosta, GA | 3.0 | 1.0 | 994 | $1,095 | $1.10 | 43d | 1 | 0.17mi |
| 722 Vallotton Dr Valdosta, GA | 3.0 | 1.0 | 984 | $900 | $0.91 | 43d | 1 | 0.21mi |
| 1503 E Park Ave Valdosta, GA | 1.0–3.0 | 1.0–2.0 | 890 | $1,260 | $1.42 | 43d | 54 | 0.23mi |
| 1616 E Moore St Apt 19 Valdosta, GA | 2.0 | 1.0 | 1029 | $825 | $0.80 | 43d | 1 | 0.25mi |
| 743 E Brookwood Dr Valdosta, GA | 2.0 | 1.0 | 906 | $895 | $0.99 | 43d | 1 | 0.32mi |
| 1425 E Park Ave Valdosta, GA | 1.0–2.0 | 1.0–2.0 | 917 | $1,095 | $1.19 | 21d | 2 | 0.37mi |
| 1701 N Troup St Valdosta, GA | 2.0 | 1.0 | 756 | $750 | $0.99 | 21d | 1 | 0.41mi |
| 1716 Charlton St Valdosta, GA | 2.0 | 1.0 | 833 | $825 | $0.99 | 43d | 1 | 0.55mi |
| 604 E Brookwood Dr Valdosta, GA | 2.0 | 1.0 | 720 | $995 | $1.38 | 43d | 1 | 0.56mi |
| 1609 Marion St Unit B Valdosta, GA | 2.0 | 1.0 | 945 | $895 | $0.95 | 21d | 1 | 0.61mi |
| 720 E Park Ave Unit 6 Valdosta, GA | 2.0 | 1.0 | 850 | $650 | $0.76 | 21d | 1 | 0.64mi |
| 1005 Langdale Dr Unit B Valdosta, GA | 2.0 | 1.0 | 879 | $700 | $0.80 | 21d | 1 | 0.68mi |
| 713 Lakeland Ave Valdosta, GA | 2.0 | 1.0 | 1047 | $895 | $0.85 | 43d | 1 | 0.70mi |
| 1632 Lexington Cir Valdosta, GA | 3.0 | 2.0 | 1104 | $1,395 | $1.26 | 43d | 1 | 0.75mi |
| 2314 Pineview Dr Apt A Valdosta, GA | 2.0 | 1.0 | 940 | $900 | $0.96 | 43d | 1 | 0.86mi |
| 2324 Sterling Pl Valdosta, GA | 3.0 | 1.0 | 1124 | $1,095 | $0.97 | 21d | 1 | 0.93mi |
| 2205 Bemiss Rd Valdosta, GA | 2.0 | 1.0 | 880 | $1,095 | $1.24 | 43d | 3 | 0.93mi |
| 304 E Cranford Ave Valdosta, GA | 2.0 | 1.0 | 980 | $850 | $0.87 | 43d | 1 | 0.93mi |
| 522 Green St Valdosta, GA | 2.0 | 1.0 | 1020 | $900 | $0.88 | 21d | 1 | 1.00mi |
| 1506 Slater St Unit 7 Valdosta, GA | 2.0 | 1.5 | 1037 | $695 | $0.67 | 43d | 1 | 1.03mi |
| 2709 Pineview Dr Unit A Valdosta, GA | 2.0 | 2.5 | 1000 | $995 | $0.99 | 43d | 1 | 1.07mi |
| 611 Pineview Dr Valdosta, GA | 1.0–3.0 | 1.0–2.5 | 1204 | $1,600 | $1.33 | 21d | 3 | 1.13mi |
| 1704 N Patterson St Unit 4 Valdosta, GA | 2.0 | 2.0 | 1100 | $950 | $0.86 | 43d | 1 | 1.17mi |
| 2305 Bemiss Rd Unit T16 Valdosta, GA | 2.0 | 1.5 | 896 | $850 | $0.95 | 43d | 1 | 1.23mi |
| 1010 N Toombs St Valdosta, GA | 2.0 | 1.5 | 1056 | $1,000 | $0.95 | 21d | 3 | 1.25mi |
| 1005 N Oak St Valdosta, GA | 3.0 | 1.0 | 1087 | $795 | $0.73 | 43d | 1 | 1.29mi |
| 1004 N Oak St Valdosta, GA | 1.0–2.0 | 1.0 | 866 | $750 | $0.87 | 21d | 3 | 1.32mi |
| 200 W Cranford Ave Valdosta, GA | 2.0 | 2.0 | 950 | $1,225 | $1.29 | 21d | 3 | 1.33mi |
| 1029 Johnson St Valdosta, GA | 2.0 | 1.0 | 986 | $900 | $0.91 | 43d | 1 | 1.34mi |
| 2437 University Dr Valdosta, GA | 3.0 | 1.0 | 879 | $1,175 | $1.34 | 43d | 1 | 1.44mi |
Listing history 20 events
-
2026-06-19days on market $79,900 Active 32 DOM
-
2026-06-18days on market $79,900 Active 31 DOM
-
2026-06-17days on market $79,900 Active 30 DOM
-
2026-06-16days on market $79,900 Active 29 DOM
-
2026-06-15days on market $79,900 Active 28 DOM
-
2026-06-14days on market $79,900 Active 26 DOM
-
2026-06-13days on market $79,900 Active 25 DOM
-
2026-06-10days on market $79,900 Active 23 DOM
-
2026-06-09days on market $79,900 Active 22 DOM
-
2026-06-08days on market $79,900 Active 21 DOM
-
2026-06-07days on market $79,900 Active 20 DOM
-
2026-06-05days on market $79,900 Active 17 DOM
-
2026-06-03days on market $79,900 Active 16 DOM
-
2026-06-02days on market $79,900 Active 15 DOM
-
2026-06-01days on market $79,900 Active 14 DOM
-
2026-05-31days on market $79,900 Active 13 DOM
-
2026-05-30days on market $79,900 Active 12 DOM
-
2026-05-18$79,900 Active
-
2002-03-26soldstatus $40,500
-
1977-01-27soldstatus $24,500
ⓘ Source: listings_history table (triggers on properties + properties_extension) + one-shot
backfill from property_details.listing_events for pre-trigger history.
Tax reassessment forecast GA · Resets to sale price
- Current annual tax
- $526 · $44/mo
- Projected year-2 tax
- $735 · $61/mo
- Expected delta
- +$209/yr (+$17/mo · 39.7%)
ⓘ Screening estimate from a state-policy table — verify with the county assessor before closing.
Climate risk First Street
- Flood 1/10 Low FEMA zone X (unshaded) · 0% chance over 30 yrs
- Wildfire 4/10 Moderate
- Heat 7/10 Severe 7 d/yr ≥108°F today · 18 d/yr by 30 yrs out
- Wind 8/10 Severe 99% chance of damaging wind over 30 yrs
- Air quality 6/10 Major 10 unhealthy d/yr today · 11 by 30 yrs out
Nearby sold comps map
Loading sold comps map…
Walkable amenities ~0.75 mi
Loading nearby amenities…
Taxation est. · year 1
- Rental income
- $13,433
- − Mortgage interest
- −$4,476
- − Property taxes
- −$526
- − Insurance
- −$400
- − Repairs & maintenance
- −$1,075
- − Management
- −$1,075
- − Depreciation
- −$2,324
- Taxable income
- $3,558
- Est. tax owed @ 24.0%
- −$854
- After-tax cash flow
- $3,805/yr
For passive investors: Depreciation is non-cash, so a rental often shows a tax loss while cash-flowing — sheltering income. Rental losses are passive: they offset passive income freely, and up to $25,000/yr can offset ordinary (W-2) income if you actively participate and your MAGI is under $100k (phasing out to $0 by $150k); unused losses carry forward. On sale, claimed depreciation is recaptured at up to 25%, and gains may owe capital-gains tax (a 1031 exchange can defer both). Figures are a year-1 estimate at your 24.0% rate — not tax advice; consult a CPA.
Schools (NCES district)
- District
- Valdosta City
- NCES district ID
- 1305310
- Math proficiency
- 15% ▼ -12.00%
- Reading proficiency
- 22% ▼ -7.00%
- Median HH income
- $30,634
- Composite
- 14.79/100
- National rank
- #9388
- State rank
- #149 of 174 in GA
Livability — Valdosta
- Score
- 60/100
- State rank
- #392
- US rank
- #19544
Category grades
Schools grade is shown separately in the Schools card above.
Census & demographics
- Census place
- Valdosta, GA
- County
- Lowndes County · 107,801 people
- City population
- 91,859
- Metro
- Valdosta, GA
- Population (ZIP)
- 35,728
- Household income
- $56,939
- Rent vs Own
- Severe rent burden
- 2034.0
Population outlook (Lowndes County) Hauer SSP2
- Today (2025)
- 120,348 people
- By 2030
- 123,469 · +2.6%
- By 2040
- 128,482 · +6.8%
- By 2050
- 131,907 · +9.6%
- By 2075
- 139,080 · +15.6%
- By 2100
- 133,649 · +11.1%
Race, ethnicity, and origin ACS 2023
- Neighborhood character
- Diverse neighborhood (Simpson 0.61)
- Race & ethnicity
- White 45% Black 42% Hispanic / Latino 7% Two or more races 5% Asian 2%
- Hispanic origin (detail)
- Mexican 3% Puerto Rican 1%
- Common ancestry
- Italian 1% Slovak 1% Lithuanian 1%
- Foreign-born
- 4% · Canada
- Languages at home
- 94% English-only · Spanish 3% Other Indo-European 1% French/Haitian/Cajun 1%
Political lean MEDSL · Lowndes
- 2024 margin
- R (+18.0) · D 40.8% · R 58.8%
- 2008→2024 swing
- -8.6pp toward R · 2008: -9.4pp · 2024: -18.0pp
- All cycles
- 2024: R+18.0 2020: R+12.0 2016: R+18.2 2012: R+10.5 2008: R+9.4
Not yet ingested
- Civics
- —
Market trends
- HPI YoY
- ▼ -150.60%
- Current HPI
- 188.2012
- Rent YoY
- ▲ 4.19%
- Metro
- Valdosta, GA
- State GDP YoY
- ▲ 2.66%
- F500 in state
- 28
Industry mix (Fortune 500 HQ in GA)
| Industry | F500 HQs | Revenue |
|---|---|---|
| Paper / Packaging | 2 | $29B |
|
||
| Retail | 1 | $160B |
|
||
| Transportation / Logistics | 1 | $91B |
|
||
| Airlines | 1 | $62B |
|
||
| Consumer Goods | 1 | $47B |
|
||
| Utilities | 1 | $25B |
|
||
Price history
+226.1% since first listed3 events — show timeline
- 2026-05-18 Listed $79,900 SGMLS
- 2002-03-26 Sold (Public Records) $40,500 Public Records
- 1977-01-27 Sold (Public Records) $24,500 Public Records
Property tax history
+5.2%/yrLatest (2025): $526 · +28.9% YoY. Source: county tax records.
Cash-flow waterfall
monthlySold comps — $/sqft
last 12 mo · ≤1 miLoading sold comps…