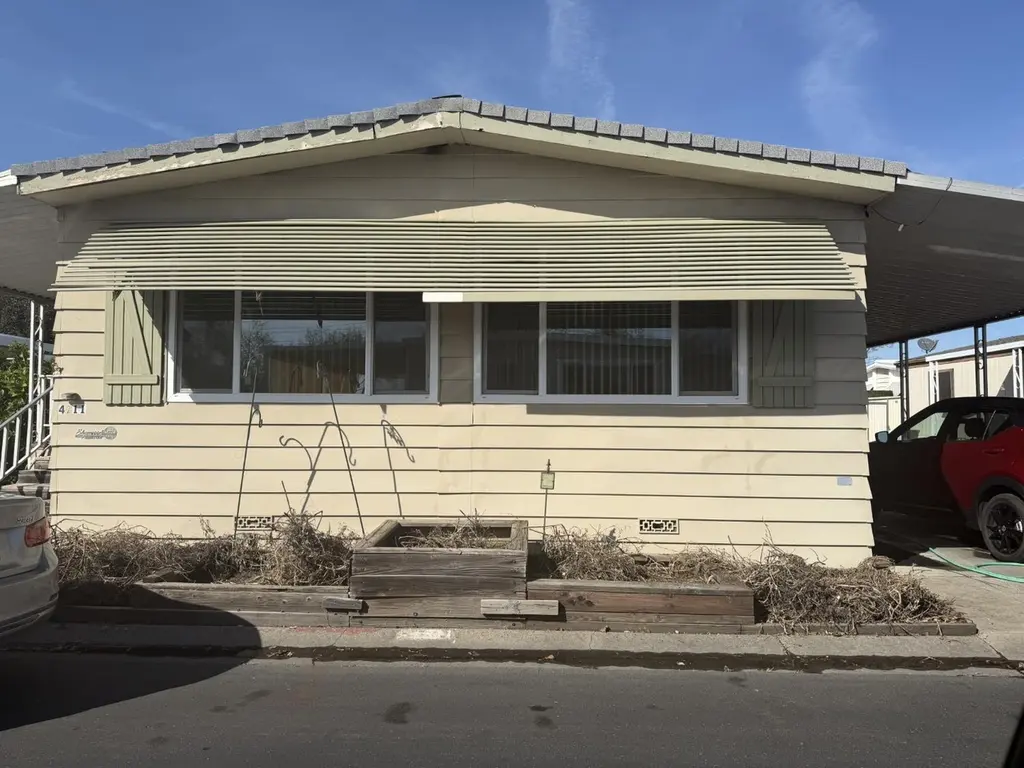
4911 Arbor Dr #22 · Sacramento, CA
Flood risk 4/10 · Minor
- FEMA flood zone
- A99
- Chance of flooding over 30 yrs
- 0.2%
- Est. flood insurance / yr
- $1,009 – $1,996
Fire risk 5/10 · Moderate
- Est. fire insurance / yr
- $659 – $1,223
Heat risk 7/10 · Major
- Hot days now (above 103°F)
- 7 days/yr
- Hot days in 30 yrs
- 14 days/yr
Wind risk 1/10 · Minimal
- Chance of severe wind over 30 yrs
- —
Air-quality risk 10/10 · Severe
- Unhealthy air days now
- 27 days/yr
- Unhealthy air days in 30 yrs
- 33 days/yr
Risk factors via First Street. Map © Google.
Why this score? — see what drove the B+ grade
The composite is a weighted blend of 9 inputs, each scored 0–100. Each bar is that input's sub-score; the figure is the points it added to the 100-point composite (weight × sub-score).
- Cash flow +30.0/30.0
- ARV discount +13.8/15.0
- 1% rule +10.0/10.0
- DSCR +10.0/10.0
- Schools +4.1/10.0
- Livability +3.6/5.0
- Rent growth +2.7/5.0
- Condition / age +2.5/5.0
- Appreciation +0.0/10.0
$74,900
🖨 Deal sheet (PDF) 📄 Offer letter ✓ Due diligence
Listing remarks
LARGE MOBILE HOME IN STADIUM CLUB ESTATES SR. COMMUNITY FOR 55 +. WHAT A GREAT DEAL ! 2 BEDROOM, 2 BATH APPOX 1440 SQ. FT. LARGE LIVING ROOM, FORMAL DINING ROOM AREA PLUS A SEPARATE FAMILY ROOM.
Key facts
- Parking
- Built 1973
- Listed 93 days
Neighborhood map
What this means for you Summary
Snapshot
- This is a 2-bed/2.0-bath manufactured listed at $75k.
Deal economics
- At list price, monthly cash flow is $1k ($17k/yr) — positive.
- The deal already cash-flows at list — no discount required.
- Meets the 1% rule at list price ($3k rent vs $75k).
- Recommended offer: $68k (9.0% below list) — sets the bar for market timing.
- Cap rate 31.5% vs local median 3.0% in Sacramento — top-decile yield for the area; either an underpriced asset or a hidden risk that comps aren't pricing in. Stress-test before assuming the spread holds.
Location & tenants
- Location reads 71/100 on livability (#218 in CA) — a middle-class / working-renter tenant base. Strengths: amenities A+, commute A+, housing A; Watch: schools D+, crime F, cost of living F.
- Natomas Unified (urban): math 33% / reading 60% proficiency, ranked #155 of 517 in CA (top 30%) — families likely to look elsewhere, expect single-tenant / working-renter base with shorter leases.
- Market conditions: Rents flat; 145 active listings in the ZIP; 38 comparable units currently listed for rent nearby; rentals at typical pace (median 16d on market — plan ~3-4 weeks tenant-placement turnaround); solid renter incomes; 6,825 units permitted in Sacramento County in 2024 (1,752 in 5+ unit buildings).
- This rent runs 30% of the median local income ($101k/yr) — at the standard rent-burdened threshold; future hikes will face affordability resistance.
Forward outlook
- Local home prices are declining (-3.0%/yr); year-one equity from $518 of loan paydown is wiped out by about $2k of value loss. Plan a longer hold.
- Sacramento County population projected at +17% by 2050 — long-run rental-demand tailwind backs the buy-and-hold thesis.
- At projected returns (-3.0% appreciation + 0.8% rent growth), your $21k cash investment doubles in ~2 years — after that, you're playing with house money.
Negotiation context
- It's been on market 93 days — a 9% lower offer ($68k) is reasonable based on typical stale-listing flexibility.
Risks & watch-outs
- Watch-outs: flood insurance adds $125/mo.
- Climate carrying-cost: in FEMA flood zone A99 (mandatory federal flood insurance); moderate wildfire risk; extreme-heat days projected 7→14/yr by 2055 (HVAC capex compounding) — expect insurance premiums to compound above CPI over the hold.
Questions for the listing agent
- It's been on market 93 days. Have you received any prior offers? Is the seller open to a 9% concession, seller financing, or rate buy-down credit?
- Built in 1973 — when were the roof, HVAC, electrical panel, plumbing, and water heater last replaced?
- What's the actual annual flood-insurance premium (NFIP or private), and is the property in a SFHA with mandatory coverage?
- Why hasn't it sold? Are there any deal-killer items the seller is aware of (foundation, flood, title, zoning, code violations)?
- Is there a deadline driving the sale (1031 exchange, divorce, estate, relocation)? That informs how much negotiation room exists.
- Schools are D-rated, which usually means shorter tenancies and higher turnover. Who's the typical renter profile here, and what's been the actual vacancy rate?
- Crime grade is F in this area — have there been break-ins, vandalism, or insurance claims at this property in the last 3 years? What carrier currently insures it and at what premium?
- What's the average days-on-market for RENTAL listings here right now (not sales)? A rising rental-DOM trend means longer vacancies and softer asking-rent achievability than the comps imply.
- What's the recent tenant-quality profile in this submarket — average credit score on applications, eviction rate, late-payment / NSF rate, and stable-employment percentage? A property-management company in the area should have these aggregated.
- How much new for-sale + rental construction is in the pipeline within 1–3 miles? Heavy new supply typically softens prices + rents 12–24 months out; constrained supply supports both.
Investment metrics
- 1% rule
- 3.40% ✓
- Cap rate
- 31.47%
- Cash-on-cash
- 89.92%
- DSCR
- 5.00
- GRM
- 2.5
CMA / ARV
- ARV (median comp)
- $87,000
- List price
- $74,900
- Delta
- -13.91%
- Verdict
- UNDERPRICED
- Comps
- 9 within 1.0 mi
Show comp detail 12 sales within ~0.75 mi
| Address | Dist | Beds/Ba | Sqft | Sold | Price | $/sf | Match |
|---|---|---|---|---|---|---|---|
| 4203 Bouquet Way | 0.03mi | 2/2.0 | 1,440 (0%) | 14mo | $120,000 | $83 | 87 |
| 4907 Gardendell Rd #87 | 0.08mi | 3/2.0 (+1) | 1,440 (0%) | 12mo | $145,000 | $101 | 81 |
| 4916 Brookdale Dr #130 | 0.14mi | 2/2.0 | 1,344 (-7%) | 2mo | $40,000 | $30 | 80 |
| 4901 Gardendell Rd #84 | 0.10mi | 2/2.0 | 1,344 (-7%) | 5mo | $119,000 | $89 | 80 |
| 4922 N Brookdale Dr #128 | 0.15mi | 2/2.0 | 1,536 (+7%) | 5mo | $74,900 | $49 | 77 |
| 4872 Brookdale #163 | 0.12mi | 2/2.0 | 1,400 (-3%) | 16mo | $110,000 | $79 | 76 |
| 4208 Bouquet Way #38 | 0.04mi | 1/2.0 (-1) | 1,560 (+8%) | 11mo | $152,000 | $97 | 70 |
| 4229 Bouquet Way | 0.13mi | 2/2.0 | 1,248 (-13%) | 4mo | $47,500 | $38 | 69 |
| 4215 Atrium Way #102 | 0.08mi | 2/2.0 | 1,344 (-7%) | 22mo | $120,000 | $89 | 67 |
| 4211 Brookside Dr #153 | 0.10mi | 2/2.0 | 1,344 (-7%) | 23mo | $105,400 | $78 | 65 |
| 4211 Bouquet Way | 0.06mi | 2/2.0 | 1,300 (-10%) | 23mo | $117,500 | $90 | 62 |
| 4916 Arbor Dr #10 | 0.04mi | 2/2.0 | 1,272 (-12%) | 20mo | $93,000 | $73 | 62 |
Match score weights: distance 35% · size 25% · config 20% · recency 20%. Top-matched comps best support the ARV.
Projected returns pro-forma
-3.0% appreciation · 0.82% rent growth · sell at horizon
- IRR
- 80.5%
- Equity multiple
- 4.56×
- Total profit
- $74,579
- Equity at exit
- $11,168
- IRR
- 83.4%
- Equity multiple
- 8.74×
- Total profit
- $162,362
- Equity at exit
- $6,476
Cash invested: $20,972 (down + closing). Projections, not guarantees.
Landlord ↔ Tenant lean methodology
- Overall (STATE)
- 18 Strongly Tenant-Friendly
- State California
- 18 Strongly Tenant-Friendly · D+13
- County
- — inherits STATE
- City
- — inherits STATE
ZIP-level market 95834
- Home prices YoY
- -13.2%
- Rents YoY
- 0.8%
- Active inventory
- 145
- Price-to-rent
- 2.5×
Monthly cashflow live
- Estimated rent
- $2,545 high interval (Pro) →
- Mortgage (P&I)
- −$393
- Tax from tax record
- −$15 /mo · $183/yr
- Insurance
- −$31
- Flood insurance flood zone
- −$125 /mo · $1,502/yr
- HOA
- −$0
- Vacancy / Maint / Mgmt
- −$534
- Net cashflow
- $1,446
Break-even live
Sensitivity live
| Price | -10% $1,489 | -5% $1,467 | +0% $1,446 | +5% $1,425 | +10% $1,404 |
|---|---|---|---|---|---|
| Rent | -10% $1,245 | -5% $1,346 | +0% $1,446 | +5% $1,547 | +10% $1,647 |
| Rate | -1.0pp $1,484 | -0.5pp $1,465 | base $1,446 | +0.5pp $1,427 | +1.0pp $1,407 |
UW: 25.0% down · 7.5% · 30yr · 1.5% tax · 5.0% vac · 8.0% maint · 8.0% mgmt
Financing live
Cash to close
- Down payment
- $18,725
- Closing costs
- $2,247
- Reserves months
- —
- Total cash needed
- —
Loan-product check · same deal, 3 products live
Conventional
25% down · 7.5% · 30yr
- Down + closing
- —
- Monthly P&I
- —
- Monthly cashflow
- —
- DSCR
- —
- Eligible?
- —
Personal DTI + credit; lowest rate.
DSCR
20% down · 8.5% · 30yr
- Down + closing
- —
- Monthly P&I
- —
- Monthly cashflow
- —
- DSCR
- —
- Eligible?
- —
No personal income docs; deal must DSCR.
Hard money
10% down · 12.0% · 12mo
- Down + closing
- —
- Monthly P&I
- —
- Monthly cashflow
- —
- DSCR
- —
- Eligible?
- —
Short-term bridge; refi at stabilization.
Rent comps 38 comps
| Address | Beds | Baths | Sqft | Rent | $/sqft | DOM | Units | Dist |
|---|---|---|---|---|---|---|---|---|
| 3301 Arena Blvd Sacramento, CA | 1.0–3.0 | 1.0–2.5 | 952 | $2,300 | $2.42 | 2d | 1 | 0.20mi |
| 4032 Vittoria Ln Sacramento, CA | 3.0 | 2.5 | 1601 | $2,795 | $1.75 | 24d | 1 | 0.21mi |
| 4045 Neapolis Ln Sacramento, CA | 3.0 | 2.5 | 1811 | $2,800 | $1.55 | 3d | 1 | 0.29mi |
| 4118 Adriatic Sea Way Sacramento, CA | 3.0 | 2.5 | 1593 | $2,995 | $1.88 | 18d | 1 | 0.32mi |
| 17 Hertford Cir Sacramento, CA | 3.0 | 2.5 | 1511 | $2,450 | $1.62 | 24d | 1 | 0.58mi |
| 4450 El Centro Rd Sacramento, CA | 1.0 | 1.0 | 845 | $2,014 | $2.38 | 2d | 9 | 0.64mi |
| 17 Advantage Ct Sacramento, CA | 3.0 | 2.5 | 1394 | $2,595 | $1.86 | 44d | 1 | 0.77mi |
| 4470 Saone Walk Sacramento, CA | 3.0–4.0 | 2.5–3.5 | 1846 | $2,595 | $1.41 | 2d | 1 | 0.81mi |
| 3635 Poppy Hill Way Sacramento, CA | 3.0 | 2.0 | 1441 | $2,895 | $2.01 | 24d | 1 | 0.82mi |
| 4200 E Commerce Way #1012 Sacramento, CA | 2.0 | 2.0 | 958 | $1,795 | $1.87 | 44d | 1 | 0.83mi |
| 4200 E Commerce Way Sacramento, CA | 1.0–2.0 | 1.0–2.0 | 812 | $1,695 | $2.09 | 5d | 2 | 0.86mi |
| 4190 E Commerce Way Sacramento, CA | 1.0–3.0 | 1.0–2.0 | 940 | $2,675 | $2.85 | 2d | 20 | 0.89mi |
| 3610 Duckhorn Dr Sacramento, CA | 1.0–3.0 | 1.0–2.0 | 927 | $2,635 | $2.84 | 2d | 29 | 0.91mi |
| 3547 Jumilla Way Sacramento, CA | 3.0 | 2.0 | 1323 | $2,650 | $2.00 | 13d | 1 | 0.95mi |
| 4800 Westlake Pkwy Sacramento, CA | 1.0–2.0 | 1.5–2.5 | 1214 | $2,250 | $1.85 | 2d | 3 | 0.95mi |
| 4800 Westlake Pkwy #3008 Sacramento, CA | 2.0 | 2.0 | 1304 | $2,250 | $1.73 | 44d | 1 | 0.99mi |
| 301 Candela Cir Sacramento, CA | 3.0 | 2.5 | 1541 | $2,750 | $1.78 | 15d | 1 | 1.00mi |
| 3791 E Commerce Way Sacramento, CA | 2.0 | 1.0–2.0 | 865 | $2,970 | $3.43 | 3d | 21 | 1.02mi |
| 3900 E Commerce Way Sacramento, CA | 3.0 | 2.0 | 1311 | $2,600 | $1.98 | 44d | 1 | 1.04mi |
| 620 Candela Cir Sacramento, CA | 3.0 | 2.5 | 1681 | $2,595 | $1.54 | 44d | 1 | 1.06mi |
| 3761 E Commerce Way Sacramento, CA | 2.0 | 1.0–2.0 | 865 | $3,231 | $3.74 | 2d | 29 | 1.06mi |
| 3828 Aircraft Way Sacramento, CA | 3.0 | 2.5 | 1826 | $2,395 | $1.31 | 24d | 1 | 1.17mi |
| 5050 Trouville Ln Sacramento, CA | 3.0 | 2.5 | 1583 | $2,950 | $1.86 | 44d | 1 | 1.20mi |
| 2201 Arena Blvd Sacramento, CA | 1.0–2.0 | 1.0–2.0 | 1015 | $2,777 | $2.74 | 3d | 14 | 1.24mi |
| 570 Wapello Cir Sacramento, CA | 3.0 | 2.5 | 1697 | $3,000 | $1.77 | 44d | 1 | 1.27mi |
| 3351 Duckhorn Dr Sacramento, CA | 1.0 | 1.0 | 981 | $2,030 | $2.07 | 2d | 8 | 1.32mi |
| 4800 Kokomo Dr Sacramento, CA | 1.0–3.0 | 1.0–3.5 | 1229 | $2,906 | $2.36 | 2d | 26 | 1.34mi |
| 4101 Innovator Dr Sacramento, CA | 1.0–2.0 | 1.0–2.0 | 950 | $2,695 | $2.84 | 2d | 10 | 1.35mi |
| 260 Wapello Cir Sacramento, CA | 3.0 | 3.0 | 1697 | $2,650 | $1.56 | 8d | 1 | 1.38mi |
| 2490 Quiet Trail Ln Sacramento, CA | 1.0–3.0 | 1.0–2.0 | 1113 | $2,899 | $2.60 | 2d | 14 | 1.38mi |
| 2442 Buzz Aldrin Way Sacramento, CA | 3.0 | 2.5 | 1826 | $2,795 | $1.53 | 15d | 1 | 1.38mi |
| 2445 Buzz Aldrin Way Sacramento, CA | 3.0 | 2.5 | 1826 | $2,895 | $1.59 | 5d | 1 | 1.39mi |
| 2445 Buzz Aldrin Way Sacramento, CA | 3.0 | 2.5 | 1826 | $2,995 | $1.64 | 24d | 1 | 1.39mi |
| 2445 Buzz Aldrin Way Sacramento, CA | 3.0 | 3.0 | 1826 | $2,995 | $1.64 | 22d | 1 | 1.39mi |
| 4100 Innovator Dr Sacramento, CA | 2.0 | 1.0–2.0 | 860 | $2,990 | $3.47 | 2d | 18 | 1.45mi |
| 3301 N Park Dr Sacramento, CA | 3.0 | 2.5 | 1678 | $2,672 | $1.59 | 44d | 2 | 1.46mi |
| 3065 Touchman St Sacramento, CA | 3.0 | 2.5 | 1473 | $2,395 | $1.63 | 21d | 1 | 1.46mi |
| 4000 Innovator Dr Sacramento, CA | 2.0–4.0 | 2.0–3.0 | 1403 | $2,295 | $1.64 | 15d | 1 | 1.49mi |
Listing history 14 events
-
2026-06-18days on market $74,900 Active 93 DOM
-
2026-06-17days on market $74,900 Active 92 DOM
-
2026-06-16days on market $74,900 Active 91 DOM
-
2026-06-15days on market $74,900 Active 90 DOM
-
2026-06-13days on market $74,900 Active 88 DOM
-
2026-06-13days on market $74,900 Active 87 DOM
-
2026-06-09days on market $74,900 Active 84 DOM
-
2026-06-08days on market $74,900 Active 83 DOM
-
2026-06-07days on market $74,900 Active 82 DOM
-
2026-06-05days on market $74,900 Active 79 DOM
-
2026-06-03days on market $74,900 Active 78 DOM
-
2026-06-02days on market $74,900 Active 77 DOM
-
2026-06-01days on market $74,900 Active 76 DOM
-
2026-05-31days on market $74,900 Active 75 DOM
ⓘ Source: listings_history table (triggers on properties + properties_extension) + one-shot
backfill from property_details.listing_events for pre-trigger history.
Tax reassessment forecast CA · Resets to sale price
- Current annual tax
- $183 · $15/mo
- Projected year-2 tax
- $569 · $47/mo
- Expected delta
- +$386/yr (+$32/mo · 210.5%)
ⓘ Screening estimate from a state-policy table — verify with the county assessor before closing.
Climate risk First Street
- Flood 4/10 Moderate FEMA zone A99 · 20% chance over 30 yrs
- Wildfire 5/10 Major
- Heat 7/10 Severe 7 d/yr ≥103°F today · 14 d/yr by 30 yrs out
- Wind 1/10 Low
- Air quality 10/10 Extreme 27 unhealthy d/yr today · 33 by 30 yrs out
Nearby sold comps map
Loading sold comps map…
Walkable amenities ~0.75 mi
Loading nearby amenities…
Taxation est. · year 1
- Rental income
- $30,543
- − Mortgage interest
- −$4,196
- − Property taxes
- −$183
- − Insurance
- −$1,877
- − Repairs & maintenance
- −$2,443
- − Management
- −$2,443
- − Depreciation
- −$2,179
- Taxable income
- $17,221
- Est. tax owed @ 24.0%
- −$4,133
- After-tax cash flow
- $13,222/yr
For passive investors: Depreciation is non-cash, so a rental often shows a tax loss while cash-flowing — sheltering income. Rental losses are passive: they offset passive income freely, and up to $25,000/yr can offset ordinary (W-2) income if you actively participate and your MAGI is under $100k (phasing out to $0 by $150k); unused losses carry forward. On sale, claimed depreciation is recaptured at up to 25%, and gains may owe capital-gains tax (a 1031 exchange can defer both). Figures are a year-1 estimate at your 24.0% rate — not tax advice; consult a CPA.
Schools (NCES district)
- District
- Natomas Unified
- NCES district ID
- 0600036
- Math proficiency
- 33% ▼ -1.00%
- Reading proficiency
- 60% ▲ 13.00%
- Median HH income
- $67,969
- Composite
- 41.49/100
- National rank
- #3457
- State rank
- #155 of 517 in CA
Livability — Sacramento
- Score
- 71/100
- State rank
- #218
- US rank
- #6957
Category grades
Schools grade is shown separately in the Schools card above.
Census & demographics
- Census place
- Sacramento, CA
- County
- Sacramento County · 1,539,646 people
- City population
- 761,410
- Metro
- Sacramento-Roseville-Folsom, CA
- Population (ZIP)
- 36,245
- Household income
- $101,260
- Rent vs Own
- Severe rent burden
- 1444.0
Population outlook (Sacramento County) Hauer SSP2
- Today (2025)
- 1,660,763 people
- By 2030
- 1,732,990 · +4.3%
- By 2040
- 1,855,755 · +11.7%
- By 2050
- 1,941,335 · +16.9%
- By 2075
- 2,046,162 · +23.2%
- By 2100
- 1,961,444 · +18.1%
Race, ethnicity, and origin ACS 2023
- Neighborhood character
- Highly diverse neighborhood (Simpson 0.78)
- Race & ethnicity
- Asian 29% Hispanic / Latino 28% White 19% Two or more races 16% Black 15% Pacific Islander 1%
- Hispanic origin (detail)
- Mexican 21%
- Common ancestry
- Lithuanian 2% Subsaharan African 1% Russian 1%
- Foreign-born
- 30% · Canada, China, Vietnam
- Languages at home
- 58% English-only · Spanish 15% Other Indo-European 14% Other Asian/Pacific 3%
Political lean MEDSL · Sacramento
- 2024 margin
- D (+19.7) · D 58.1% · R 38.4% · Other 3.5%
- 2008→2024 swing
- +0.7pp no change · 2008: 19.0pp · 2024: 19.7pp
- All cycles
- 2024: D+19.7 2020: D+25.3 2016: D+23.7 2012: D+16.3 2008: D+19.0
Not yet ingested
- Civics
- —
Market trends
- HPI YoY
- ▼ -45.12%
- Current HPI
- 295.8305
- Rent YoY
- ▲ 0.82%
- Metro
- Sacramento-Roseville-Folsom, CA
- State GDP YoY
- ▲ 3.21%
- F500 in state
- 116
Industry mix (Fortune 500 HQ in CA)
| Industry | F500 HQs | Revenue |
|---|---|---|
| Technology | 27 | $1,492B |
|
||
| Financial Services | 3 | $174B |
|
||
| Retail | 3 | $44B |
|
||
| Insurance | 3 | $26B |
|
||
| Media / Entertainment | 2 | $115B |
|
||
| Pharmaceuticals / Biotech | 2 | $62B |
|
||
Property tax history
+0.9%/yrLatest (2025): $183 · -9.0% YoY. Source: county tax records.
Cash-flow waterfall
monthlySold comps — $/sqft
last 12 mo · ≤1 miLoading sold comps…