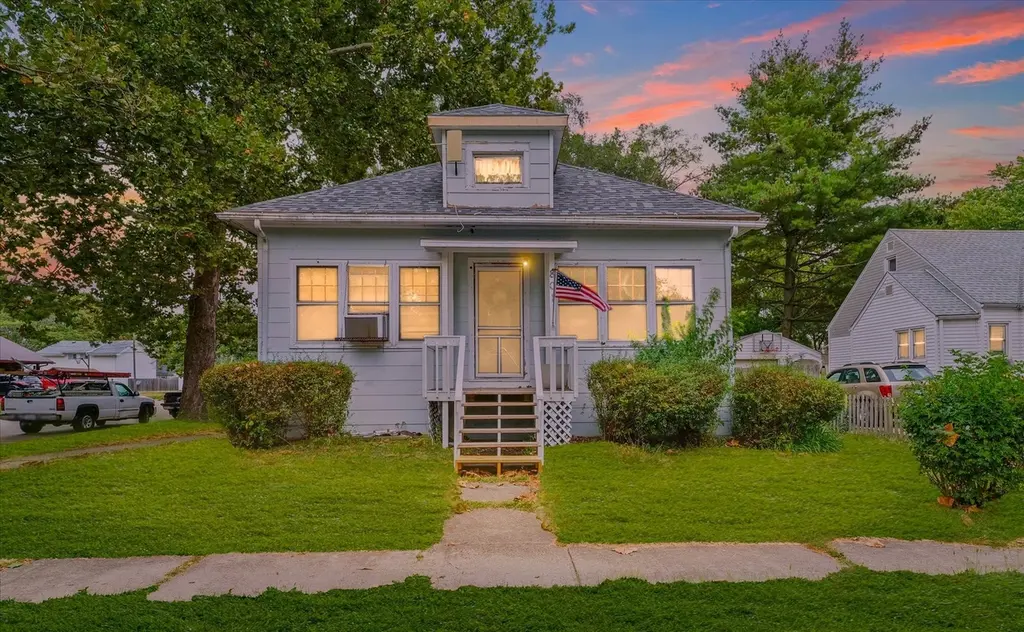
801 E Sangamon Ave · Rantoul, IL
Flood risk 1/10 · Minimal
- FEMA flood zone
- X (unshaded)
- Chance of flooding over 30 yrs
- 0.0%
- Est. flood insurance / yr
- $507 – $1,088
Fire risk 1/10 · Minimal
- Est. fire insurance / yr
- $804 – $1,492
Heat risk 3/10 · Minor
- Hot days now (above 105°F)
- 7 days/yr
- Hot days in 30 yrs
- 18 days/yr
Wind risk 2/10 · Minimal
- Chance of severe wind over 30 yrs
- 1.0%
Air-quality risk 2/10 · Minimal
- Unhealthy air days now
- 0 days/yr
- Unhealthy air days in 30 yrs
- 1 days/yr
Risk factors via First Street. Map © Google.
Why this score? — see what drove the D+ grade
The composite is a weighted blend of 9 inputs, each scored 0–100. Each bar is that input's sub-score; the figure is the points it added to the 100-point composite (weight × sub-score).
- ARV discount +15.0/15.0
- Appreciation +10.0/10.0
- Cash flow +8.3/30.0
- Rent growth +4.1/5.0
- Livability +3.4/5.0
- Condition / age +2.5/5.0
- DSCR +2.3/10.0
- 1% rule +2.0/10.0
- Schools +1.2/10.0
$139,900
🖨 Deal sheet (PDF) 📄 Offer letter ✓ Due diligence
Listing remarks
Welcome to this charming 3-Bed, 2-Bath Home on a Corner Lot in the Heart of Rantoul! This inviting home is full of character and warmth, offering a blend of original details and modern updates. Inside, you'll find spacious living areas that flow naturally, making the home ideal for both everyday living and gatherings. With three bedrooms and two full bathrooms, there's plenty of room to spread out and enjoy. Natural light enhances the character of the home, highlighting its original charm and comfortable design. The property sits on a desirable corner lot with a detached garage, providing both curb appeal and extra convenience. Its prime location is hard to beat-just one block from Rantoul
Key facts
- New plumbing
- Furnace
- Corner lot
Tags
Property features AI
Finance
- Other: Property not currently leased; Built before 1978
- HOA & community: No master association fee required
Exterior
- Parking: Detached garage (owned); Concrete and gravel parking surfaces; 2 total parking spaces, 2 garage spaces
- Utilities: Public water; Public sewer; Public power
- Home design: Detached single-family home; 1.5-story layout; Fee simple ownership
- Construction: Built approximately 91–100 years ago; Vinyl siding; Asphalt roof; Block foundation
- Exterior features: Corner lot; Lot dimensions approximately 108 x 50; Less than 1/4 acre lot
Interior
- Kitchen: Galley kitchen
- Bedrooms: 3 bedrooms total; Master bedroom on main level; Second bedroom on main level (12 x 10); Third bedroom on second level (11 x 12)
- Flooring: Hardwood flooring in several rooms; Laminate flooring in pantry and laundry; Carpet in enclosed porch and some bedrooms
- Bathrooms: 2 full bathrooms
- Heating & cooling: Natural gas heating; Window air conditioning units
- Interior features: First-floor full bathroom; Finished attic; Separate dining room; Full, unfinished basement; Estimated living area
- Laundry & utility: Main-level laundry; Gas dryer hookup
Neighborhood map
What this means for you Summary
Snapshot
- This is a 3-bed/2.0-bath single-family listed at $140k.
Deal economics
- At list price, monthly cash flow is $-128 ($-2k/yr) — negative.
- To cash-flow at today's rent, offer at most $117k (16.2% below list).
- To meet the 1% rule (rent ≥ 1% of price), the offer needs to be $97k (30.3% below list).
- Recommended offer: $97k (30.3% below list) — sets the bar for 1% rule.
- Cap rate 5.2% vs local median 4.3% in Rantoul — meaningfully above typical; check what's discounted (condition, days-on-market, listing class) to confirm the premium yield is real.
Location & tenants
- Location reads 67/100 on livability (#533 in IL) — a middle-class / working-renter tenant base. Strengths: cost of living A+, housing A+, health & safety B; Watch: employment D, schools F, crime F.
- Rantoul Township Hsd 193 (town): math 10% / reading 10% proficiency, ranked #824 of 919 in IL (top 90%) — low school quality limits family demand, transient renter base, plan for 1-2y turnover.
- Market conditions: Rents rising fast (+6.6%/yr); 53 active listings in the ZIP; 3 comparable units currently listed for rent nearby; rentals leasing fast (median 4d on market — plan ~1-2 weeks tenant-placement turnaround); 573 units permitted in Champaign County in 2024 (359 in 5+ unit buildings).
Forward outlook
- In year one you build about $15k of equity ($967 loan paydown + $14k appreciation (10.0% local appreciation)).
- Champaign County population projected at +15% by 2050 — modest demand growth; plan on rents tracking national, not racing it.
- By year 3, paydown + projected appreciation supports a ~$38k cash-out refi (75% LTV) — recoverable capital for the next deal without selling this one.
Negotiation context
- It's been on market 81 days — a 6% lower offer ($132k) is reasonable based on typical stale-listing flexibility.
- 4 sale attempts since 24y ago; this cycle's ask has dropped $15k (10%) from the opening price — seller is motivated, your offer sets the floor, not the list.
- Current owner paid $33k; list at $140k implies a 320% gain — meaningful room to come down on a strong offer.
Questions for the listing agent
- What do current leases actually rent for vs. the listed asking? Can we see a recent rent roll and the last 12 months of T-12 income?
- It's been on market 81 days. Have you received any prior offers? Is the seller open to a 30% concession, seller financing, or rate buy-down credit?
- Why hasn't it sold? Are there any deal-killer items the seller is aware of (foundation, flood, title, zoning, code violations)?
- Is there a deadline driving the sale (1031 exchange, divorce, estate, relocation)? That informs how much negotiation room exists.
- Schools are F-rated, which usually means shorter tenancies and higher turnover. Who's the typical renter profile here, and what's been the actual vacancy rate?
- Crime grade is F in this area — have there been break-ins, vandalism, or insurance claims at this property in the last 3 years? What carrier currently insures it and at what premium?
- The area grade is low — what's the realistic commute time and amenity access for the typical tenant pool here? Any planned neighborhood developments (good or bad) we should know about?
- What's the average days-on-market for RENTAL listings here right now (not sales)? A rising rental-DOM trend means longer vacancies and softer asking-rent achievability than the comps imply.
- What's the recent tenant-quality profile in this submarket — average credit score on applications, eviction rate, late-payment / NSF rate, and stable-employment percentage? A property-management company in the area should have these aggregated.
- How much new for-sale + rental construction is in the pipeline within 1–3 miles? Heavy new supply typically softens prices + rents 12–24 months out; constrained supply supports both.
Investment metrics
- 1% rule
- 0.70% ✗
- Cap rate
- 5.19%
- Cash-on-cash
- -3.92%
- DSCR
- 0.83
- GRM
- 12.0
CMA / ARV
- ARV (on-the-fly)
- $187,530
- Comps found
- 12
Show comp detail 12 sales within ~0.75 mi
| Address | Dist | Beds/Ba | Sqft | Sold | Price | $/sf | Match |
|---|---|---|---|---|---|---|---|
| 517 Illinois Dr | 0.39mi | 3/1.0 | 1,579 (-4%) | 0mo | $121,500 | $77 | 71 |
| 308 Illinois Dr | 0.30mi | 3/1.0 | 1,507 (-8%) | 2mo | $161,200 | $107 | 67 |
| 1055 Pinecrest Dr | 0.65mi | 3/2.0 | 1,632 (-1%) | 7mo | $211,000 | $129 | 63 |
| 409 E Congress Ave | 0.35mi | 3/2.0 | 1,415 (-14%) | 2mo | $180,000 | $127 | 59 |
| 508 E Champaign Ave | 0.32mi | 3/1.5 | 1,416 (-14%) | 4mo | $140,000 | $99 | 56 |
| 120 N Fredrick St | 0.28mi | 3/2.0 | 1,400 (-15%) | 8mo | $187,000 | $134 | 55 |
| 1058 North Dr | 0.73mi | 3/2.0 | 1,564 (-5%) | 5mo | $180,000 | $115 | 54 |
| 1304 Sunset Dr | 0.39mi | 3/2.0 | 1,451 (-12%) | 12mo | $165,000 | $114 | 52 |
| 800 Roselyn Dr | 0.70mi | 3/2.0 | 1,738 (+6%) | 11mo | $135,000 | $78 | 49 |
| 1145 Eastview Dr | 0.69mi | 4/2.0 (+1) | 1,550 (-6%) | 12mo | $152,000 | $98 | 43 |
| 327 E Belle Ave | 0.43mi | 3/1.5 | 1,398 (-15%) | 12mo | $165,000 | $118 | 43 |
| 1045 Briarcliff Dr | 0.60mi | 3/2.0 | 1,416 (-14%) | 11mo | $140,000 | $99 | 40 |
Match score weights: distance 35% · size 25% · config 20% · recency 20%. Top-matched comps best support the ARV.
Projected returns pro-forma
10.0% appreciation · 6.56% rent growth · sell at horizon
- IRR
- 22.5%
- Equity multiple
- 2.83×
- Total profit
- $71,623
- Equity at exit
- $126,033
- IRR
- 20.9%
- Equity multiple
- 6.76×
- Total profit
- $225,748
- Equity at exit
- $271,795
Cash invested: $39,172 (down + closing). Projections, not guarantees.
Landlord ↔ Tenant lean methodology
- Overall (STATE)
- 43 Moderately Tenant-Leaning
- State Illinois
- 43 Moderately Tenant-Leaning · D+7
- County
- — inherits STATE
- City
- — inherits STATE
ZIP-level market 61866
- Home prices YoY
- 10.8%
- Rents YoY
- 6.6%
- Active inventory
- 53
- Price-to-rent
- 12.0×
Monthly cashflow live
- Estimated rent
- $975 medium interval (Pro) →
- Mortgage (P&I)
- −$734
- Tax from tax record
- −$106 /mo · $1,275/yr
- Insurance
- −$58
- HOA
- −$0
- Vacancy / Maint / Mgmt
- −$205
- Net cashflow
- $-128
Break-even live
Sensitivity live
| Price | -10% $-49 | -5% $-89 | +0% $-128 | +5% $-168 | +10% $-207 |
|---|---|---|---|---|---|
| Rent | -10% $-205 | -5% $-167 | +0% $-128 | +5% $-90 | +10% $-51 |
| Rate | -1.0pp $-58 | -0.5pp $-93 | base $-128 | +0.5pp $-164 | +1.0pp $-201 |
UW: 25.0% down · 7.5% · 30yr · 1.5% tax · 5.0% vac · 8.0% maint · 8.0% mgmt
Financing live
Cash to close
- Down payment
- $34,975
- Closing costs
- $4,197
- Reserves months
- —
- Total cash needed
- —
Loan-product check · same deal, 3 products live
Conventional
25% down · 7.5% · 30yr
- Down + closing
- —
- Monthly P&I
- —
- Monthly cashflow
- —
- DSCR
- —
- Eligible?
- —
Personal DTI + credit; lowest rate.
DSCR
20% down · 8.5% · 30yr
- Down + closing
- —
- Monthly P&I
- —
- Monthly cashflow
- —
- DSCR
- —
- Eligible?
- —
No personal income docs; deal must DSCR.
Hard money
10% down · 12.0% · 12mo
- Down + closing
- —
- Monthly P&I
- —
- Monthly cashflow
- —
- DSCR
- —
- Eligible?
- —
Short-term bridge; refi at stabilization.
Rent comps 3 comps
| Address | Beds | Baths | Sqft | Rent | $/sqft | DOM | Units | Dist |
|---|---|---|---|---|---|---|---|---|
| 909 N Maplewood Dr Rantoul, IL | 2.0–3.0 | 1.0 | 950 | $910 | $0.96 | 3d | 8 | 0.81mi |
| 620 Willow Pond Rd Rantoul, IL | 2.0–4.0 | 1.5–2.5 | 1320 | $915 | $0.69 | 3d | 7 | 0.94mi |
| 1505 Hobson Dr Rantoul, IL | 1.0–3.0 | 1.0–1.5 | 925 | $995 | $1.08 | 3d | 7 | 1.26mi |
Listing history 25 events
-
2026-06-18days on market $139,900 Active 81 DOM
-
2026-06-17days on market $139,900 Active 80 DOM
-
2026-06-16days on market $139,900 Active 79 DOM
-
2026-06-15days on market $139,900 Active 78 DOM
-
2026-06-14days on market $139,900 Active 76 DOM
-
2026-06-13days on market $139,900 Active 75 DOM
-
2026-06-10days on market $139,900 Active 73 DOM
-
2026-06-09days on market $139,900 Active 72 DOM
-
2026-06-08days on market $139,900 Active 71 DOM
-
2026-06-07days on market $139,900 Active 70 DOM
-
2026-06-02days on market $139,900 Active 65 DOM
-
2026-06-01days on market $139,900 Active 64 DOM
-
2026-05-31days on market $139,900 Active 63 DOM
-
2026-05-30days on market $139,900 Active 62 DOM
-
2026-05-04price $139,900
-
2026-03-29$155,000 Active
-
2025-12-17historical
-
2025-12-17status Temporarily No Showings
-
2025-12-16historical
-
2025-10-27price
-
2025-10-20price
-
2025-09-26Active
-
2002-11-18historical
-
2002-09-07
-
1992-11-13soldstatus $33,330
ⓘ Source: listings_history table (triggers on properties + properties_extension) + one-shot
backfill from property_details.listing_events for pre-trigger history.
Tax reassessment forecast IL · Partial reset (capped growth)
- Current annual tax
- $1,275 · $106/mo
- Projected year-2 tax
- $2,225 · $185/mo
- Expected delta
- +$950/yr (+$79/mo · 74.5%)
ⓘ Screening estimate from a state-policy table — verify with the county assessor before closing.
Climate risk First Street
- Flood 1/10 Low FEMA zone X (unshaded) · 0% chance over 30 yrs
- Wildfire 1/10 Low
- Heat 3/10 Moderate 7 d/yr ≥105°F today · 18 d/yr by 30 yrs out
- Wind 2/10 Low 100% chance of damaging wind over 30 yrs
- Air quality 2/10 Low 0 unhealthy d/yr today · 1 by 30 yrs out
Nearby sold comps map
Loading sold comps map…
Walkable amenities ~0.75 mi
Loading nearby amenities…
Taxation est. · year 1
- Rental income
- $11,698
- − Mortgage interest
- −$7,837
- − Property taxes
- −$1,275
- − Insurance
- −$700
- − Repairs & maintenance
- −$936
- − Management
- −$936
- − Depreciation
- −$4,070
- Taxable loss
- −$4,055
- Est. tax savings @ 24.0%
- +$973
- After-tax cash flow
- $-564/yr
For passive investors: Depreciation is non-cash, so a rental often shows a tax loss while cash-flowing — sheltering income. Rental losses are passive: they offset passive income freely, and up to $25,000/yr can offset ordinary (W-2) income if you actively participate and your MAGI is under $100k (phasing out to $0 by $150k); unused losses carry forward. On sale, claimed depreciation is recaptured at up to 25%, and gains may owe capital-gains tax (a 1031 exchange can defer both). Figures are a year-1 estimate at your 24.0% rate — not tax advice; consult a CPA.
Schools (NCES district)
- District
- Rantoul Township Hsd 193
- NCES district ID
- 1733240
- Math proficiency
- 10% ▼ -5.00%
- Reading proficiency
- 10% ▬ 0.00%
- Median HH income
- $38,128
- Composite
- 12.14/100
- National rank
- #14582
- State rank
- #824 of 919 in IL
Livability — Rantoul
- Score
- 67/100
- State rank
- #533
- US rank
- #11081
Category grades
Schools grade is shown separately in the Schools card above.
Census & demographics
- Census place
- Rantoul, IL
- County
- Champaign County · 182,148 people
- City population
- 13,470
- Metro
- Champaign-Urbana, IL
- Population (ZIP)
- 13,470
- Household income
- $50,686
- Rent vs Own
- Severe rent burden
- 281.0
Population outlook (Champaign County) Hauer SSP2
- Today (2025)
- 223,848 people
- By 2030
- 231,416 · +3.4%
- By 2040
- 244,321 · +9.1%
- By 2050
- 256,432 · +14.6%
- By 2075
- 285,823 · +27.7%
- By 2100
- 296,406 · +32.4%
Race, ethnicity, and origin ACS 2023
- Neighborhood character
- Diverse neighborhood (Simpson 0.69)
- Race & ethnicity
- White 48% Two or more races 23% Hispanic / Latino 21% Black 20%
- Hispanic origin (detail)
- Mexican 16% Puerto Rican 3%
- Common ancestry
- Romanian 1% Iranian 1% Slovak 1%
- Foreign-born
- 9% · Canada, Jamaica
- Languages at home
- 84% English-only · Spanish 14% Russian/Polish/Slavic 1%
Political lean MEDSL · Champaign
- 2024 margin
- Strong D (+24.1) · D 61.3% · R 37.2% · Other 1.5%
- 2008→2024 swing
- +6.6pp toward D · 2008: 17.5pp · 2024: 24.1pp
- All cycles
- 2024: D+24.1 2020: D+22.8 2016: D+18.4 2012: D+6.8 2008: D+17.5
Not yet ingested
- Civics
- —
Market trends
- HPI YoY
- ▲ 26.49%
- Current HPI
- 272.2527
- Rent YoY
- ▲ 6.56%
- Metro
- Champaign-Urbana, IL
- State GDP YoY
- ▲ 1.59%
- F500 in state
- 60
Industry mix (Fortune 500 HQ in IL)
| Industry | F500 HQs | Revenue |
|---|---|---|
| Insurance | 4 | $201B |
|
||
| Consumer Goods | 4 | $87B |
|
||
| Industrial Machinery | 3 | $64B |
|
||
| Healthcare | 2 | $55B |
|
||
| Retail / Pharmacy | 1 | $148B |
|
||
| Agriculture / Food | 1 | $86B |
|
||
Price history
+319.7% since first listed11 events — show timeline
- 2026-05-04 Price Changed $139,900 MRED as Distributed by MLS Grid
- 2026-03-29 Listed $155,000 MRED as Distributed by MLS Grid
- 2025-12-17 Listing Removed — MRED as Distributed by MLS Grid
- 2025-12-17 Relisted — MRED as Distributed by MLS Grid
- 2025-12-16 Listing Removed — MRED as Distributed by MLS Grid
- 2025-10-27 Price Changed — MRED as Distributed by MLS Grid
- 2025-10-20 Price Changed — MRED as Distributed by MLS Grid
- 2025-09-26 Listed — MRED as Distributed by MLS Grid
- 2002-11-18 Listing Removed — MRED as Distributed by MLS Grid
- 2002-09-07 Listed — MRED as Distributed by MLS Grid
- 1992-11-13 Sold (Public Records) $33,330 Public Records
Property tax history
+5.0%/yrLatest (2024): $1,275 · +11.6% YoY. Source: county tax records.
Cash-flow waterfall
monthlySold comps — $/sqft
last 12 mo · ≤1 miLoading sold comps…