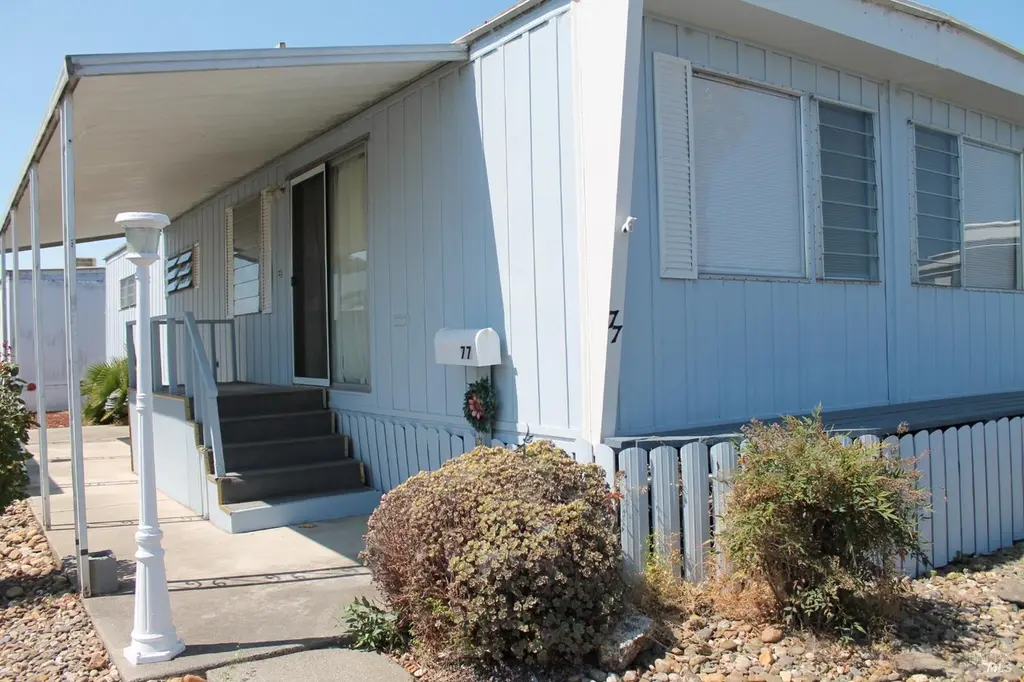
77 Heliotrope St · Vallejo, CA
Flood risk 4/10 · Minor
- FEMA flood zone
- X (shaded)
- Chance of flooding over 30 yrs
- 0.22%
- Est. flood insurance / yr
- $507 – $1,088
Fire risk 4/10 · Minor
- Est. fire insurance / yr
- $659 – $1,223
Heat risk 4/10 · Minor
- Hot days now (above 93°F)
- 7 days/yr
- Hot days in 30 yrs
- 13 days/yr
Wind risk 1/10 · Minimal
- Chance of severe wind over 30 yrs
- —
Air-quality risk 8/10 · Major
- Unhealthy air days now
- 13 days/yr
- Unhealthy air days in 30 yrs
- 13 days/yr
Risk factors via First Street. Map © Google.
Why this score? — see what drove the C+ grade
The composite is a weighted blend of 9 inputs, each scored 0–100. Each bar is that input's sub-score; the figure is the points it added to the 100-point composite (weight × sub-score).
- Cash flow +30.0/30.0
- 1% rule +10.0/10.0
- DSCR +10.0/10.0
- Rent growth +3.9/5.0
- Livability +3.4/5.0
- Schools +2.6/10.0
- Condition / age +2.2/5.0
- ARV discount +0.0/15.0
- Appreciation +0.0/10.0
$134,000
🖨 Deal sheet (PDF) 📄 Offer letter ✓ Due diligence
Listing remarks MLS
Welcome to your new home in Vallejo! This cozy mobile home is in a great spot near Highway 37, perfect for anyone commuting. Located in a friendly mobile home park with the lowest rent in town, it's an affordable option for families. The home has a few updates, like newer flooring and fresh paint, so it's in good shape and ready for you to move in. Plus, there's convenient two-car parking right outside. Don't miss out on this chance to own a home in a clean family friendly Mobile Home Park community.
Key facts
- Clubhouse
- Basketball court
- Private bathroom
Tags
Neighborhood map
What this means for you Summary
Snapshot
- This is a 2-bed/2.0-bath manufactured listed at $134k. Condition is rated fair.
Deal economics
- At list price, monthly cash flow is $857 ($10k/yr) — positive.
- The deal already cash-flows at list — no discount required.
- Meets the 1% rule at list price ($2k rent vs $134k).
- Recommended offer: $118k (12.0% below list) — sets the bar for market timing.
- Cap rate 14.0% vs local median 3.1% in Vallejo — top-decile yield for the area; either an underpriced asset or a hidden risk that comps aren't pricing in. Stress-test before assuming the spread holds.
Location & tenants
- Location reads 67/100 on livability (#304 in CA) — a middle-class / working-renter tenant base. Strengths: commute A+, housing A+, health & safety A+; Watch: schools D-, crime F, cost of living F.
- Vallejo City Unified (urban): math 20% / reading 30% proficiency, ranked #1,124 of 1,400 in CA (top 80%) — low school quality limits family demand, transient renter base, plan for 1-2y turnover; 62% free/reduced lunch — lower-income household profile, screen leases tightly.
- Market conditions: Rents rising fast (+5.5%/yr); 70 active listings in the ZIP; 32 comparable units currently listed for rent nearby; rentals at typical pace (median 24d on market — plan ~3-4 weeks tenant-placement turnaround); solid renter incomes; 1,472 units permitted in Solano County in 2024 (131 in 5+ unit buildings).
Forward outlook
- Local home prices are declining (-3.0%/yr); year-one equity from $926 of loan paydown is wiped out by about $4k of value loss. Plan a longer hold.
- Solano County population projected at +15% by 2050 — modest demand growth; plan on rents tracking national, not racing it.
- At projected returns (-3.0% appreciation + 5.5% rent growth), your $38k cash investment doubles in ~5 years — after that, you're playing with house money.
Negotiation context
- It's been on market 302 days — a 12% lower offer ($118k) is reasonable based on typical stale-listing flexibility.
Questions for the listing agent
- It's been on market 302 days. Have you received any prior offers? Is the seller open to a 12% concession, seller financing, or rate buy-down credit?
- Have any recent inspections been done? Can we get a copy of the seller's disclosures and any deferred-maintenance estimates?
- Built in 1965 — when were the roof, HVAC, electrical panel, plumbing, and water heater last replaced?
- Why hasn't it sold? Are there any deal-killer items the seller is aware of (foundation, flood, title, zoning, code violations)?
- Is there a deadline driving the sale (1031 exchange, divorce, estate, relocation)? That informs how much negotiation room exists.
- Schools are D-rated, which usually means shorter tenancies and higher turnover. Who's the typical renter profile here, and what's been the actual vacancy rate?
- Crime grade is F in this area — have there been break-ins, vandalism, or insurance claims at this property in the last 3 years? What carrier currently insures it and at what premium?
- What's the average days-on-market for RENTAL listings here right now (not sales)? A rising rental-DOM trend means longer vacancies and softer asking-rent achievability than the comps imply.
- What's the recent tenant-quality profile in this submarket — average credit score on applications, eviction rate, late-payment / NSF rate, and stable-employment percentage? A property-management company in the area should have these aggregated.
- How much new for-sale + rental construction is in the pipeline within 1–3 miles? Heavy new supply typically softens prices + rents 12–24 months out; constrained supply supports both.
Investment metrics
- 1% rule
- 1.68% ✓
- Cap rate
- 13.97%
- Cash-on-cash
- 27.41%
- DSCR
- 2.22
- GRM
- 4.9
CMA / ARV
- ARV (median comp)
- $97,536
- List price
- $134,000
- Delta
- 37.39%
- Verdict
- OVERPRICED
- Comps
- 5 within 1.0 mi
Show comp detail 5 sales within ~0.75 mi
| Address | Dist | Beds/Ba | Sqft | Sold | Price | $/sf | Match |
|---|---|---|---|---|---|---|---|
| 88 Juniper Dr | 0.03mi | 3/2.0 (+1) | 1,060 (+0%) | 23mo | $150,000 | $142 | 74 |
| 117 Mimosa Ave | 0.07mi | 3/2.0 (+1) | 1,040 (-2%) | 22mo | $185,000 | $178 | 70 |
| 87 Juniper Dr | 0.04mi | 2/1.0 | 900 (-15%) | 10mo | $79,000 | $88 | 62 |
| 82 Juniper Dr | 0.03mi | 2/1.0 | 900 (-15%) | 23mo | $100,000 | $111 | 51 |
| 1740 Broadway #6 | 0.56mi | 2/2.0 | 900 (-15%) | 18mo | $139,000 | $154 | 34 |
Match score weights: distance 35% · size 25% · config 20% · recency 20%. Top-matched comps best support the ARV.
Projected returns pro-forma
-3.0% appreciation · 5.46% rent growth · sell at horizon
- IRR
- 24.2%
- Equity multiple
- 2.03×
- Total profit
- $38,633
- Equity at exit
- $19,980
- IRR
- 33.6%
- Equity multiple
- 4.43×
- Total profit
- $128,774
- Equity at exit
- $11,586
Cash invested: $37,520 (down + closing). Projections, not guarantees.
Landlord ↔ Tenant lean methodology
- Overall (STATE)
- 18 Strongly Tenant-Friendly
- State California
- 18 Strongly Tenant-Friendly · D+13
- County
- — inherits STATE
- City
- — inherits STATE
ZIP-level market 94589
- Rents YoY
- 5.5%
- Active inventory
- 70
- Price-to-rent
- 4.9×
Monthly cashflow live
- Estimated rent
- $2,257 high interval (Pro) →
- Mortgage (P&I)
- −$703
- Tax est. 1.5%
- −$168 /mo · $2,010/yr
- Insurance
- −$56
- HOA
- −$0
- Vacancy / Maint / Mgmt
- −$474
- Net cashflow
- $857
Break-even live
Sensitivity live
| Price | -10% $950 | -5% $903 | +0% $857 | +5% $811 | +10% $764 |
|---|---|---|---|---|---|
| Rent | -10% $679 | -5% $768 | +0% $857 | +5% $946 | +10% $1,035 |
| Rate | -1.0pp $925 | -0.5pp $891 | base $857 | +0.5pp $822 | +1.0pp $787 |
UW: 25.0% down · 7.5% · 30yr · 1.5% tax · 5.0% vac · 8.0% maint · 8.0% mgmt
Financing live
Cash to close
- Down payment
- $33,500
- Closing costs
- $4,020
- Reserves months
- —
- Total cash needed
- —
Loan-product check · same deal, 3 products live
Conventional
25% down · 7.5% · 30yr
- Down + closing
- —
- Monthly P&I
- —
- Monthly cashflow
- —
- DSCR
- —
- Eligible?
- —
Personal DTI + credit; lowest rate.
DSCR
20% down · 8.5% · 30yr
- Down + closing
- —
- Monthly P&I
- —
- Monthly cashflow
- —
- DSCR
- —
- Eligible?
- —
No personal income docs; deal must DSCR.
Hard money
10% down · 12.0% · 12mo
- Down + closing
- —
- Monthly P&I
- —
- Monthly cashflow
- —
- DSCR
- —
- Eligible?
- —
Short-term bridge; refi at stabilization.
Rent comps 32 comps
| Address | Beds | Baths | Sqft | Rent | $/sqft | DOM | Units | Dist |
|---|---|---|---|---|---|---|---|---|
| 45 Baldwin St Vallejo, CA | 3.0 | 1.0 | 988 | $1,999 | $2.02 | 14d | 1 | 0.64mi |
| 445 Redwood St Vallejo, CA | 1.0–2.0 | 1.0 | 618 | $1,732 | $2.80 | 14d | 1 | 0.68mi |
| 15 Werden St Vallejo, CA | 3.0 | 1.0 | 988 | $2,100 | $2.13 | 24d | 1 | 0.72mi |
| 88 Valle Vista Ave Vallejo, CA | 1.0–3.0 | 1.0–2.0 | 1019 | $2,302 | $2.26 | 14d | 10 | 0.80mi |
| 511 Lighthouse Dr Vallejo, CA | 1.0 | 1.0 | 718 | $1,800 | $2.51 | 14d | 1 | 0.85mi |
| 322 Pecan St Vallejo, CA | 2.0 | 1.0 | 852 | $2,600 | $3.05 | 44d | 1 | 0.85mi |
| 1101 N Camino Alto Vallejo, CA | 1.0–2.0 | 1.0–2.0 | 910 | $2,469 | $2.71 | 14d | 8 | 0.88mi |
| 70 Parrott St Vallejo, CA | 3.0 | 1.0 | 988 | $2,075 | $2.10 | 44d | 1 | 0.88mi |
| 55 Valle Vista Ave Vallejo, CA | 1.0–2.0 | 1.0–2.0 | 769 | $2,217 | $2.88 | 14d | 20 | 0.91mi |
| 321 Lighthouse Dr Vallejo, CA | 2.0 | 1.0 | 840 | $2,300 | $2.74 | 24d | 1 | 0.94mi |
| 125 Hibiscus Ct Vallejo, CA | 3.0 | 1.0 | 1000 | $2,709 | $2.71 | 44d | 1 | 1.00mi |
| 265 Voyager Dr Vallejo, CA | 3.0 | 2.5 | 1444 | $3,200 | $2.22 | 44d | 1 | 1.00mi |
| 245 Voyager Dr Vallejo, CA | 2.0 | 1.0 | 820 | $2,650 | $3.23 | 14d | 1 | 1.02mi |
| 165 Oddstad Dr #2 Vallejo, CA | 2.0 | 1.5 | 1180 | $2,300 | $1.95 | 14d | 1 | 1.05mi |
| 2420 Alameda St Vallejo, CA | 3.0 | 2.0 | 1184 | $2,600 | $2.20 | 44d | 1 | 1.05mi |
| 50 Frey Pl Unit 5 Vallejo, CA | 2.0 | 1.0 | 825 | $1,575 | $1.91 | 21d | 1 | 1.06mi |
| 50 Frey Pl Unit 12 Vallejo, CA | 2.0 | 1.0 | 825 | $1,700 | $2.06 | 44d | 1 | 1.06mi |
| 165 Oddstad Dr Vallejo, CA | 2.0 | 1.5 | 1140 | $2,280 | $2.00 | 14d | 2 | 1.11mi |
| 355 Parkview Ter Apt H5 Vallejo, CA | 2.0 | 1.0 | 918 | $1,800 | $1.96 | 21d | 1 | 1.16mi |
| 355 Parkview Ter Unit E-2 Vallejo, CA | 1.0 | 1.0 | 720 | $1,750 | $2.43 | 14d | 1 | 1.16mi |
| 69 B St Vallejo, CA | 3.0 | 1.0 | 1056 | $2,000 | $1.89 | 14d | 1 | 1.18mi |
| 1455 N Camino Alto Vallejo, CA | 1.0 | 1.0 | 900 | $1,895 | $2.11 | 21d | 1 | 1.21mi |
| 10 Lee St Unit 7 Vallejo, CA | 2.0 | 1.0 | 950 | $1,695 | $1.78 | 24d | 1 | 1.22mi |
| 10 Lee St Unit 4 Vallejo, CA | 2.0 | 1.0 | 950 | $1,595 | $1.68 | 44d | 1 | 1.22mi |
| 11 B St Vallejo, CA | 2.0 | 1.0 | 986 | $2,200 | $2.23 | 24d | 1 | 1.23mi |
| 226 Nigh St Vallejo, CA | 3.0 | 2.0 | 1020 | $2,950 | $2.89 | 44d | 1 | 1.25mi |
| 1457 N Camino Alto Vallejo, CA | 2.0 | 2.0 | 1000 | $2,200 | $2.20 | 44d | 1 | 1.26mi |
| 1910 Marin St Vallejo, CA | 2.0 | 1.0 | 725 | $2,550 | $3.52 | 44d | 1 | 1.26mi |
| 424 Corcoran Ave Vallejo, CA | 2.0 | 1.0 | 1200 | $2,300 | $1.92 | 14d | 1 | 1.40mi |
| 165 Georgetown Ct Vallejo, CA | 3.0 | 2.0 | 1144 | $2,695 | $2.36 | 24d | 1 | 1.40mi |
| 514 Indiana St Vallejo, CA | 3.0 | 2.0 | 1100 | $2,800 | $2.55 | 24d | 1 | 1.47mi |
| 123 David Ct Vallejo, CA | 3.0 | 2.0 | 1323 | $3,149 | $2.38 | 14d | 1 | 1.49mi |
Listing history 18 events
-
2026-06-18days on market $134,000 Active 302 DOM
-
2026-06-17days on market $134,000 Active 301 DOM
-
2026-06-16days on market $134,000 Active 300 DOM
-
2026-06-15days on market $134,000 Active 299 DOM
-
2026-06-14days on market $134,000 Active 297 DOM
-
2026-06-10days on market $134,000 Active 294 DOM
-
2026-06-09days on market $134,000 Active 293 DOM
-
2026-06-08days on market $134,000 Active 292 DOM
-
2026-06-07days on market $134,000 Active 291 DOM
-
2026-06-05days on market $134,000 Active 288 DOM
-
2026-06-03days on market $134,000 Active 287 DOM
-
2026-06-02days on market $134,000 Active 286 DOM
-
2026-06-01days on market $134,000 Active 285 DOM
-
2026-05-31days on market $134,000 Active 284 DOM
-
2026-05-30days on market $134,000 Active 283 DOM
-
2025-04-29soldstatus $137,000 Closed 505-char remark
Show marketing remark (505 chars)
Welcome to your new home in Vallejo! This cozy mobile home is in a great spot near Highway 37, perfect for anyone commuting. Located in a friendly mobile home park with the lowest rent in town, it's an affordable option for families. The home has a few updates, like newer flooring and fresh paint, so it's in good shape and ready for you to move in. Plus, there's convenient two-car parking right outside. Don't miss out on this chance to own a home in a clean family friendly Mobile Home Park community.
-
2025-02-05price $142,500 505-char remark
Show marketing remark (505 chars)
Welcome to your new home in Vallejo! This cozy mobile home is in a great spot near Highway 37, perfect for anyone commuting. Located in a friendly mobile home park with the lowest rent in town, it's an affordable option for families. The home has a few updates, like newer flooring and fresh paint, so it's in good shape and ready for you to move in. Plus, there's convenient two-car parking right outside. Don't miss out on this chance to own a home in a clean family friendly Mobile Home Park community.
-
2024-11-23$145,000 Active 505-char remark
Show marketing remark (505 chars)
Welcome to your new home in Vallejo! This cozy mobile home is in a great spot near Highway 37, perfect for anyone commuting. Located in a friendly mobile home park with the lowest rent in town, it's an affordable option for families. The home has a few updates, like newer flooring and fresh paint, so it's in good shape and ready for you to move in. Plus, there's convenient two-car parking right outside. Don't miss out on this chance to own a home in a clean family friendly Mobile Home Park community.
ⓘ Source: listings_history table (triggers on properties + properties_extension) + one-shot
backfill from property_details.listing_events for pre-trigger history.
Climate risk First Street
- Flood 4/10 Moderate FEMA zone X (shaded) · 22% chance over 30 yrs
- Wildfire 4/10 Moderate
- Heat 4/10 Moderate 7 d/yr ≥93°F today · 13 d/yr by 30 yrs out
- Wind 1/10 Low
- Air quality 8/10 Severe 13 unhealthy d/yr today · 13 by 30 yrs out
Nearby sold comps map
Loading sold comps map…
Walkable amenities ~0.75 mi
Loading nearby amenities…
Taxation est. · year 1
- Rental income
- $27,086
- − Mortgage interest
- −$7,506
- − Property taxes
- −$2,010
- − Insurance
- −$670
- − Repairs & maintenance
- −$2,167
- − Management
- −$2,167
- − Depreciation
- −$3,898
- Taxable income
- $8,668
- Est. tax owed @ 24.0%
- −$2,080
- After-tax cash flow
- $8,205/yr
For passive investors: Depreciation is non-cash, so a rental often shows a tax loss while cash-flowing — sheltering income. Rental losses are passive: they offset passive income freely, and up to $25,000/yr can offset ordinary (W-2) income if you actively participate and your MAGI is under $100k (phasing out to $0 by $150k); unused losses carry forward. On sale, claimed depreciation is recaptured at up to 25%, and gains may owe capital-gains tax (a 1031 exchange can defer both). Figures are a year-1 estimate at your 24.0% rate — not tax advice; consult a CPA.
Condition & rehab AI · 7 photos
This mobile home requires moderate repairs and updates to its kitchen and exterior to improve its value and appeal to buyers and renters.
Repairs flagged
- Moderate kitchen cabinets — dated and in need of replacement
- Moderate kitchen appliances — outdated and in need of replacement
- Minor bathroom fixtures — standard fixtures
Value-add opportunities
- Both update kitchen cabinets and appliances — modernizing the kitchen would appeal to both buyers and renters
- Both paint exterior — fresh paint would improve curb appeal and home value
- Both repair siding — repairing the siding would improve the home's appearance and value
Renovation cost estimate screening
| Repair item | Severity | Est. cost |
|---|---|---|
| kitchen cabinets · dated and in need of replacement | Moderate | $3,000–15,000 |
| kitchen appliances · outdated and in need of replacement | Moderate | $3,000–15,000 |
| bathroom fixtures · standard fixtures | Minor | $500–3,000 |
| Total estimated repair cost · 3 items | $6,500–33,000 |
Value-add ROI direction
- Both update kitchen cabinets and appliances — modernizing the kitchen would appeal to both buyers and renters ↑
- Both paint exterior — fresh paint would improve curb appeal and home value ↑
- Both repair siding — repairing the siding would improve the home's appearance and value ↑
ⓘ Cost ranges are severity-bucket heuristics (US national rule-of-thumb). Get contractor quotes + a written scope before underwriting a rehab budget.
Schools (NCES district)
- District
- Vallejo City Unified
- NCES district ID
- 0640740
- Math proficiency
- 20% ▬ 0.00%
- Reading proficiency
- 30% ▬ 0.00%
- Median HH income
- $59,919
- Composite
- 26.02/100
- National rank
- #12743
- State rank
- #1124 of 1400 in CA
Livability — Vallejo
- Score
- 67/100
- State rank
- #304
- US rank
- #10215
Category grades
Schools grade is shown separately in the Schools card above.
Census & demographics
- Census place
- Vallejo, CA
- County
- Solano County · 433,239 people
- City population
- 125,311
- Metro
- Vallejo, CA
- Population (ZIP)
- 29,990
- Household income
- $92,735
- Rent vs Own
- Severe rent burden
- 1317.0
Population outlook (Solano County) Hauer SSP2
- Today (2025)
- 478,685 people
- By 2030
- 497,974 · +4.0%
- By 2040
- 528,515 · +10.4%
- By 2050
- 549,115 · +14.7%
- By 2075
- 587,229 · +22.7%
- By 2100
- 571,378 · +19.4%
Race, ethnicity, and origin ACS 2023
- Neighborhood character
- Highly diverse neighborhood (Simpson 0.75)
- Race & ethnicity
- Hispanic / Latino 39% Asian 23% Black 15% White 15% Two or more races 12% Pacific Islander 3%
- Hispanic origin (detail)
- Mexican 25% Puerto Rican 1%
- Common ancestry
- Russian 1% Portuguese 1% Lithuanian 1%
- Foreign-born
- 33% · Canada, Vietnam, Jamaica
- Languages at home
- 50% English-only · Spanish 29% Tagalog/Filipino 14% Other Asian/Pacific 2%
Political lean MEDSL · Solano
- 2024 margin
- Strong D (+23.0) · D 60.0% · R 37.1% · Other 2.9%
- 2008→2024 swing
- -5.6pp toward R · 2008: 28.6pp · 2024: 23.0pp
- All cycles
- 2024: D+23.0 2020: D+30.3 2016: D+30.5 2012: D+28.1 2008: D+28.6
Not yet ingested
- Civics
- —
Market trends
- HPI YoY
- ▼ -421.47%
- Current HPI
- 280.1352
- Rent YoY
- ▲ 5.46%
- Metro
- Vallejo, CA
- State GDP YoY
- ▲ 3.21%
- F500 in state
- 116
Industry mix (Fortune 500 HQ in CA)
| Industry | F500 HQs | Revenue |
|---|---|---|
| Technology | 27 | $1,492B |
|
||
| Financial Services | 3 | $174B |
|
||
| Retail | 3 | $44B |
|
||
| Insurance | 3 | $26B |
|
||
| Media / Entertainment | 2 | $115B |
|
||
| Pharmaceuticals / Biotech | 2 | $62B |
|
||
Price history
-5.5% since first listed3 events — show timeline
- 2025-04-29 Sold (MLS) $137,000 BAREIS
- 2025-02-05 Price Changed $142,500 BAREIS
- 2024-11-23 Listed $145,000 BAREIS
Cash-flow waterfall
monthlySold comps — $/sqft
last 12 mo · ≤1 miLoading sold comps…