 🏗️ New Construction
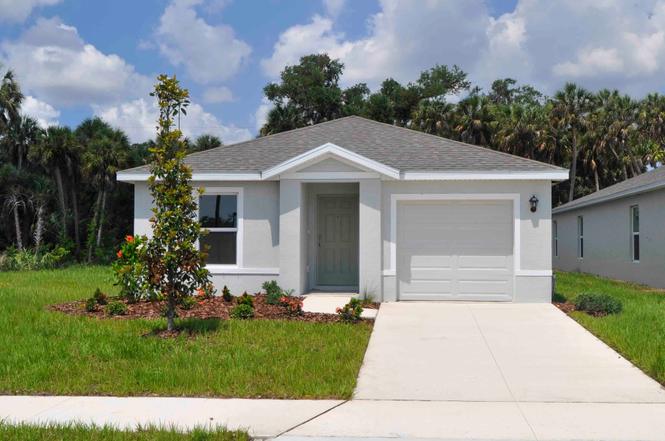
ALFORD Plan · Lakewood Ranch, FL
Flood risk No data
- FEMA flood zone
- —
- Chance of flooding over 30 yrs
- —
- Est. flood insurance / yr
- —
Fire risk No data
- Est. fire insurance / yr
- —
Heat risk No data
- Hot days now (above threshold)
- —
- Hot days in 30 yrs
- —
Wind risk No data
- Chance of severe wind over 30 yrs
- —
Air-quality risk No data
- Unhealthy air days now
- —
- Unhealthy air days in 30 yrs
- —
Risk factors via First Street. Map © Google.
Why this score? — see what drove the D- grade
The composite is a weighted blend of 9 inputs, each scored 0–100. Each bar is that input's sub-score; the figure is the points it added to the 100-point composite (weight × sub-score).
- Cash flow +11.3/30.0
- ARV discount +7.5/15.0
- Schools +4.4/10.0
- 1% rule +3.3/10.0
- DSCR +3.3/10.0
- Livability +2.5/5.0
- Condition / age +2.5/5.0
- Rent growth +2.3/5.0
- Appreciation +0.0/10.0
$343,990
🖨 Deal sheet 📄 Offer letter ✓ Due diligence
Listing remarks
The Alford is a one-story home that balances style, space, and comfort. Offering 5 bedrooms, 2 bathrooms, and 1,739 square feet, this floor plan provides plenty of room for families of all sizes. Its open-concept layout seamlessly connects the kitchen, dining, and living areas, creating a welcoming space that's ideal for gatherings or everyday living. The primary suite is tucked at the back of the home for added privacy, featuring a walk-in closet and a private bathroom with dual vanities and a separate space for the shower and toilet. Four additional bedrooms at the front of the home offer flexibility for family, guests, or even a home office. The kitchen is a standout with shaker-style ca
Key facts
- Garage
- Listed 138 days
Property features AI
Finance
- Financial info: List price $343,990
Exterior
- Parking: 1 covered garage space (1 total parking space)
- Home design: Single-family plan (ALFORD); Active new construction listing
- Construction: Living area approximately 1,739; Built as part of 2026 inventory (plan-based)
- Exterior features: Listed address: Parrish, FL 34219
Interior
- Bedrooms: 5 bedrooms
- Bathrooms: 2 full bathrooms
- Interior features: Plan ALFORD (new construction plan)
Neighborhood map
What this means for you Summary
Snapshot
- This is a 5-bed/2.0-bath single-family listed at $344k.
Deal economics
- At list price, monthly cash flow is $-133 ($-2k/yr) — negative.
- The deal already cash-flows at list — no discount required.
- To meet the 1% rule (rent ≥ 1% of price), the offer needs to be $307k (10.7% below list).
- Recommended offer: $303k (12.0% below list) — sets the bar for market timing.
- Cap rate 5.9% vs local median 3.3% in Lakewood Ranch — top-decile yield for the area; either an underpriced asset or a hidden risk that comps aren't pricing in. Stress-test before assuming the spread holds.
Location & tenants
- Location reads: area grade D — affects rentability + tenant quality, not the cash-flow math above.
- Manatee (suburban): math 54% / reading 50% proficiency, ranked #26 of 73 in FL (top 36%) — acceptable for families but not a draw, mixed tenant base, ~2y average lease.
- Market conditions: Rents soft (-0.9%/yr); 2170 active listings in the ZIP; 1 comparable units currently listed for rent nearby; high-income renter base; 7,472 units permitted in Manatee County in 2024 (1,782 in 5+ unit buildings).
- This rent runs 32% of the median local income ($114k/yr) — at the standard rent-burdened threshold; future hikes will face affordability resistance.
Forward outlook
- Local home prices are declining (-3.0%/yr); year-one equity from $3k of loan paydown is wiped out by about $11k of value loss. Plan a longer hold.
- Manatee County population projected at +43% by 2050 — long-run rental-demand tailwind backs the buy-and-hold thesis.
Negotiation context
- It's been on market 138 days — a 12% lower offer ($303k) is reasonable based on typical stale-listing flexibility.
Questions for the listing agent
- What do current leases actually rent for vs. the listed asking? Can we see a recent rent roll and the last 12 months of T-12 income?
- It's been on market 138 days. Have you received any prior offers? Is the seller open to a 12% concession, seller financing, or rate buy-down credit?
- Why hasn't it sold? Are there any deal-killer items the seller is aware of (foundation, flood, title, zoning, code violations)?
- Is there a deadline driving the sale (1031 exchange, divorce, estate, relocation)? That informs how much negotiation room exists.
- The area grade is low — what's the realistic commute time and amenity access for the typical tenant pool here? Any planned neighborhood developments (good or bad) we should know about?
- What's the average days-on-market for RENTAL listings here right now (not sales)? A rising rental-DOM trend means longer vacancies and softer asking-rent achievability than the comps imply.
- What's the recent tenant-quality profile in this submarket — average credit score on applications, eviction rate, late-payment / NSF rate, and stable-employment percentage? A property-management company in the area should have these aggregated.
- How much new for-sale + rental construction is in the pipeline within 1–3 miles? Heavy new supply typically softens prices + rents 12–24 months out; constrained supply supports both.
Investment metrics
- 1% rule
- 0.83% ✗
- Cap rate
- 5.86%
- Cash-on-cash
- -1.53%
- DSCR
- 0.93
- GRM
- 10.0
CMA / ARV
- ARV (on-the-fly)
- $370,407
- Comps found
- 12
Show comp detail 12 sales within ~0.75 mi
| Address | Dist | Beds/Ba | Sqft | Sold | Price | $/sf | Match |
|---|---|---|---|---|---|---|---|
| 17213 Wheatberry Blvd | 0.12mi | 4/2.0 (-1) | 1,828 (+5%) | 3mo | $390,000 | $213 | 78 |
| 17435 Whiskey Creek Trl | 0.18mi | 4/2.0 (-1) | 1,665 (-4%) | 2mo | $334,000 | $201 | 78 |
| 17431 Whiskey Creek Trl | 0.17mi | 4/2.0 (-1) | 1,665 (-4%) | 3mo | $362,610 | $218 | 78 |
| 17393 Whiskey Creek Trl | 0.10mi | 4/2.0 (-1) | 1,665 (-4%) | 7mo | $341,000 | $205 | 77 |
| 17933 Wheat Stack Ct | 0.62mi | 5/2.0 | 1,708 (-2%) | 1mo | $365,000 | $214 | 68 |
| 17016 James Trl | 0.70mi | 4/2.0 (-1) | 1,828 (+5%) | 2mo | $370,000 | $202 | 52 |
| 1717 Cobb Trl | 0.73mi | 4/2.0 (-1) | 1,828 (+5%) | 3mo | $375,000 | $205 | 50 |
| 1770 Cobb Trl | 0.73mi | 4/2.0 (-1) | 1,828 (+5%) | 3mo | $375,000 | $205 | 49 |
| 17024 James Trl | 0.71mi | 4/2.0 (-1) | 1,828 (+5%) | 6mo | $375,000 | $205 | 48 |
| 17028 James Trl | 0.72mi | 4/2.0 (-1) | 1,828 (+5%) | 6mo | $394,305 | $216 | 48 |
| 17909 Wheat Stack Ct | 0.62mi | 4/2.0 (-1) | 1,498 (-14%) | 1mo | $329,000 | $220 | 42 |
| 17921 Wheat Stack Ct | 0.62mi | 4/2.0 (-1) | 1,498 (-14%) | 1mo | $339,000 | $226 | 42 |
Match score weights: distance 35% · size 25% · config 20% · recency 20%. Top-matched comps best support the ARV.
Projected returns pro-forma
-3.0% appreciation · 0.0% rent growth · sell at horizon
- IRR
- -22.2%
- Equity multiple
- 0.25×
- Total profit
- $-77,420
- Equity at exit
- $55,229
- IRR
- -26.2%
- Equity multiple
- -0.09×
- Total profit
- $-112,895
- Equity at exit
- $32,026
Cash invested: $103,714 (down + closing). Projections, not guarantees.
Landlord ↔ Tenant lean methodology
- Overall (STATE)
- 87 Strongly Landlord-Friendly
- State Florida
- 87 Strongly Landlord-Friendly · R+3
- County
- — inherits STATE
- City
- — inherits STATE
ZIP-level market 34219
- Home prices YoY
- -23.7%
- Rents YoY
- -0.9%
- Active inventory
- 2170
- Price-to-rent
- 9.3×
Monthly cashflow live
- Estimated rent
- $3,072 medium interval (Pro) →
- Mortgage (P&I)
- −$1,942
- Tax est. 1.5%
- −$463 /mo · $5,556/yr
- Insurance
- −$154
- HOA
- −$0
- Vacancy / Maint / Mgmt
- −$645
- Net cashflow
- $-133
Break-even live
UW: 25.0% down · 7.5% · 30yr · 1.5% tax · 5.0% vac · 8.0% maint · 8.0% mgmt
Financing live
Cash to close
- Down payment
- $92,602
- Closing costs
- $11,112
- Reserves months
- —
- Total cash needed
- —
Loan-product check · same deal, 3 products live
Conventional
25% down · 7.5% · 30yr
- Down + closing
- —
- Monthly P&I
- —
- Monthly cashflow
- —
- DSCR
- —
- Eligible?
- —
Personal DTI + credit; lowest rate.
DSCR
20% down · 8.5% · 30yr
- Down + closing
- —
- Monthly P&I
- —
- Monthly cashflow
- —
- DSCR
- —
- Eligible?
- —
No personal income docs; deal must DSCR.
Hard money
10% down · 12.0% · 12mo
- Down + closing
- —
- Monthly P&I
- —
- Monthly cashflow
- —
- DSCR
- —
- Eligible?
- —
Short-term bridge; refi at stabilization.
Rent comps 1 comps
| Address | Beds | Baths | Sqft | Rent | $/sqft | DOM | Units | Dist |
|---|---|---|---|---|---|---|---|---|
| 15769 High Bell Pl Bradenton, FL | 4.0 | 2.0 | 1828 | $2,500 | $1.37 | 14d | 1 | 1.36mi |
Listing history 14 events
-
2026-06-18days on market $343,990 Active 138 DOM
-
2026-06-17days on market $343,990 Active 137 DOM
-
2026-06-16days on market $343,990 Active 136 DOM
-
2026-06-15days on market $343,990 Active 135 DOM
-
2026-06-13days on market $343,990 Active 133 DOM
-
2026-06-13days on market $343,990 Active 132 DOM
-
2026-06-10days on market $343,990 Active 130 DOM
-
2026-06-09days on market $343,990 Active 129 DOM
-
2026-06-08days on market $343,990 Active 128 DOM
-
2026-06-08days on market $343,990 Active 127 DOM
-
2026-06-03days on market $343,990 Active 123 DOM
-
2026-06-02days on market $343,990 Active 122 DOM
-
2026-06-01days on market $343,990 Active 121 DOM
-
2026-05-31days on market $343,990 Active 120 DOM
ⓘ Source: listings_history table (triggers on properties + properties_extension) + one-shot
backfill from property_details.listing_events for pre-trigger history.
Nearby sold comps map
Loading sold comps map…
Walkable amenities ~0.75 mi
Loading nearby amenities…
Taxation est. · year 1
- Rental income
- $36,870
- − Mortgage interest
- −$20,749
- − Property taxes
- −$5,556
- − Insurance
- −$1,852
- − Repairs & maintenance
- −$2,950
- − Management
- −$2,950
- − Depreciation
- −$10,775
- Taxable loss
- −$7,961
- Est. tax savings @ 24.0%
- +$1,911
- After-tax cash flow
- $320/yr
For passive investors: Depreciation is non-cash, so a rental often shows a tax loss while cash-flowing — sheltering income. Rental losses are passive: they offset passive income freely, and up to $25,000/yr can offset ordinary (W-2) income if you actively participate and your MAGI is under $100k (phasing out to $0 by $150k); unused losses carry forward. On sale, claimed depreciation is recaptured at up to 25%, and gains may owe capital-gains tax (a 1031 exchange can defer both). Figures are a year-1 estimate at your 24.0% rate — not tax advice; consult a CPA.
Schools (NCES district)
- District
- Manatee
- NCES district ID
- 1201230
- Math proficiency
- 54% ▼ -6.00%
- Reading proficiency
- 50% ▼ -2.00%
- Median HH income
- $49,607
- Composite
- 44.43/100
- National rank
- #2806
- State rank
- #26 of 73 in FL
Livability — Lakewood Ranch
No livability data for this city. (Only ~50 U.S. cities are tracked.)
Census & demographics
- County
- Manatee County · 416,364 people
- City population
- 52,177
- Metro
- North Port-Sarasota-Bradenton, FL
- Population (ZIP)
- 33,296
- Household income
- $113,773
- Rent vs Own
- Severe rent burden
- 219.0
Population outlook (Manatee County) Hauer SSP2
- Today (2025)
- 447,342 people
- By 2030
- 488,911 · +9.3%
- By 2040
- 567,934 · +27.0%
- By 2050
- 637,995 · +42.6%
- By 2075
- 781,970 · +74.8%
- By 2100
- 848,272 · +89.6%
Race, ethnicity, and origin ACS 2023
- Neighborhood character
- Predominantly White (75%)
- Race & ethnicity
- White 75% Hispanic / Latino 11% Two or more races 8% Black 8% Asian 2%
- Hispanic origin (detail)
- Mexican 2% Puerto Rican 3%
- Common ancestry
- Romanian 4% Hispanic 2% Russian 2%
- Foreign-born
- 10% · Canada, Dominican Republic, Jamaica
- Languages at home
- 88% English-only · Spanish 7% French/Haitian/Cajun 2% Other Asian/Pacific 1%
Political lean MEDSL · Manatee
- 2024 margin
- Strong R (+23.5) · D 37.9% · R 61.4%
- 2008→2024 swing
- -16.5pp toward R · 2008: -7.0pp · 2024: -23.5pp
- All cycles
- 2024: R+23.5 2020: R+16.1 2016: R+17.1 2012: R+12.5 2008: R+7.0
Not yet ingested
- Civics
- —
Market trends
- HPI YoY
- ▼ -84.45%
- Current HPI
- 271.7131
- Rent YoY
- ▼ -0.95%
- Metro
- North Port-Sarasota-Bradenton, FL
- State GDP YoY
- ▲ 3.28%
- F500 in state
- 36
Industry mix (Fortune 500 HQ in FL)
| Industry | F500 HQs | Revenue |
|---|---|---|
| Industrial Technology | 2 | $29B |
|
||
| Insurance | 2 | $17B |
|
||
| Retail | 1 | $60B |
|
||
| Technology Distribution | 1 | $58B |
|
||
| Homebuilding | 1 | $35B |
|
||
| Technology Manufacturing | 1 | $35B |
|
||
Cash-flow waterfall
monthlySold comps — $/sqft
last 12 mo · ≤1 miLoading sold comps…