 Duplex
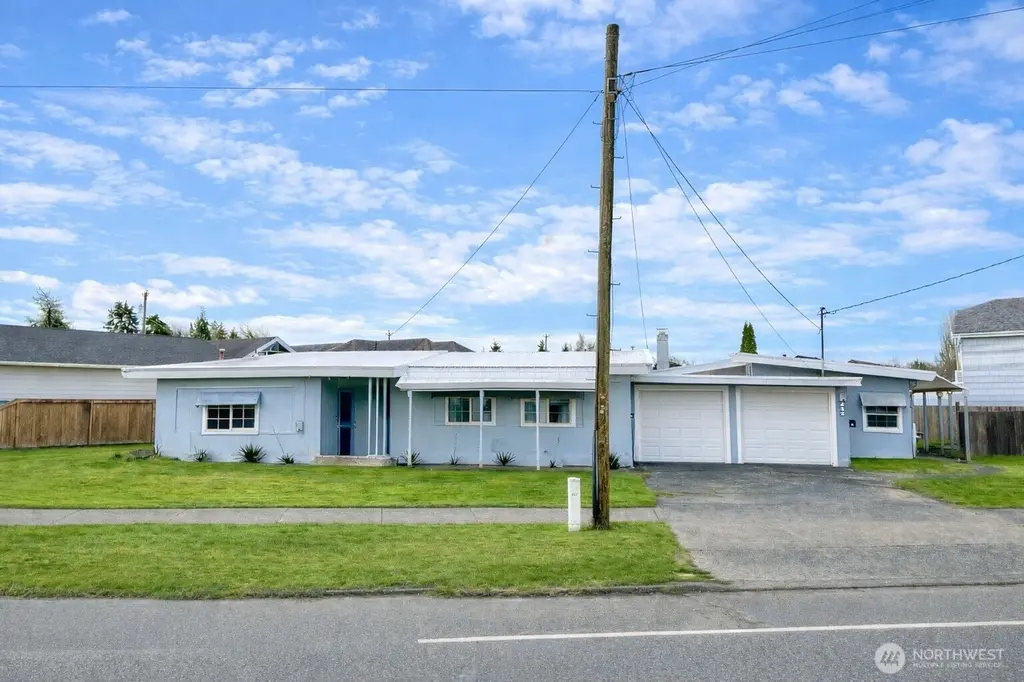
244 Emerson Ave · Hoquiam, WA
Flood risk 8/10 · Major
- FEMA flood zone
- AE
- Chance of flooding over 30 yrs
- 0.99%
- Est. flood insurance / yr
- $1,737 – $8,500
Fire risk 1/10 · Minimal
- Est. fire insurance / yr
- $604 – $1,122
Heat risk 1/10 · Minimal
- Hot days now (above 75°F)
- 8 days/yr
- Hot days in 30 yrs
- 18 days/yr
Wind risk 1/10 · Minimal
- Chance of severe wind over 30 yrs
- —
Air-quality risk 6/10 · Moderate
- Unhealthy air days now
- 6 days/yr
- Unhealthy air days in 30 yrs
- 6 days/yr
Risk factors via First Street. Map © Google.
Why this score? — see what drove the D+ grade
The composite is a weighted blend of 9 inputs, each scored 0–100. Each bar is that input's sub-score; the figure is the points it added to the 100-point composite (weight × sub-score).
- Cash flow +24.6/30.0
- DSCR +7.9/10.0
- 1% rule +5.2/10.0
- Livability +3.8/5.0
- Schools +3.2/10.0
- Rent growth +2.5/5.0
- Condition / age +2.5/5.0
- ARV discount +0.0/15.0
- Appreciation +0.0/10.0
$340,000
🖨 Deal sheet (PDF) 📄 Offer letter ✓ Due diligence
Multi-family units
County records classify this as Multi-Family (2-4 Unit). Listing-text estimate: 2 units. confirmed
Listing remarks
Well maintained duplex offering a solid investment opportunity with immediate income. Both units are currently tenant occupied, offering built in cash flow from day one. Each unit features a functional layout with separate entrances, making this an ideal option for investors or owner occupants looking to offset their mortgage. Conveniently located near schools, shopping, and local amenities with easy access to Hwy 101. Low-maintenance property in a growing rental market don’t miss this value add opportunity.
Key facts
- Functional layout
- Separate entrances
- Conveniently located
Tags
Neighborhood map
What this means for you Summary
Snapshot
- This is a 2 × 2-bed/1.0-bath units multifamily listed at $340k.
Deal economics
- At list price, monthly cash flow is $276 ($3k/yr) — positive. Per door: $138/mo.
- The deal already cash-flows at list — no discount required.
- Meets the 1% rule at list price ($3k rent vs $340k).
- Recommended offer: $299k (12.0% below list) — sets the bar for market timing.
- Cap rate 8.8% vs local median 3.8% in Hoquiam — top-decile yield for the area; either an underpriced asset or a hidden risk that comps aren't pricing in. Stress-test before assuming the spread holds.
Location & tenants
- Location reads 75/100 on livability (#171 in WA, #4,268 nationally) — a middle-class / working-renter tenant base. Strengths: commute A+, cost of living A+, housing A+; Watch: health & safety C-, employment D, schools D-.
- Hoquiam School District (town): math 30% / reading 41% proficiency, ranked #250 of 291 in WA (top 86%) — families likely to look elsewhere, expect single-tenant / working-renter base with shorter leases.
- Market conditions: 154 active listings in the ZIP; 1 comparable units currently listed for rent nearby; 297 units permitted in Grays Harbor County in 2024 (17 in 5+ unit buildings).
- At $3,473/mo this rent would consume 76% of the median local household income ($55k/yr) (locally 438% of renters already pay >50% of income on rent) — very limited rent-growth headroom before tenants either downsize or default.
Forward outlook
- Local home prices are declining (-3.0%/yr); year-one equity from $2k of loan paydown is wiped out by about $10k of value loss. Plan a longer hold.
- Grays Harbor County population projected at -24% by 2050 — secular population decline; favor cash flow + early exit over multi-decade hold.
Negotiation context
- It's been on market 128 days — a 12% lower offer ($299k) is reasonable based on typical stale-listing flexibility.
- 2 sale attempts since 4y ago with the ask held roughly flat each time — persistent listings suggest the price (not the market) is what's stuck; bring a comps-based counter.
- Current owner paid $150k; list at $340k implies a 127% gain — meaningful room to come down on a strong offer.
Risks & watch-outs
- Watch-outs: flood insurance adds $427/mo; built in 1949 — expect roof / HVAC / electrical / plumbing capex.
- Climate carrying-cost: in FEMA flood zone AE (mandatory federal flood insurance) — expect insurance premiums to compound above CPI over the hold.
Questions for the listing agent
- It's been on market 128 days. Have you received any prior offers? Is the seller open to a 12% concession, seller financing, or rate buy-down credit?
- Can we see the unit-by-unit rent roll, current vacancy, and any below-market leases? What's the average tenancy length?
- What capital expenditures (roof, boiler, parking lot, exteriors) have been made in the last 5 years, and what's planned in the next 2?
- Built in 1949 — when were the roof, HVAC, electrical panel, plumbing, and water heater last replaced?
- What's the actual annual flood-insurance premium (NFIP or private), and is the property in a SFHA with mandatory coverage?
- Why hasn't it sold? Are there any deal-killer items the seller is aware of (foundation, flood, title, zoning, code violations)?
- Is there a deadline driving the sale (1031 exchange, divorce, estate, relocation)? That informs how much negotiation room exists.
- Schools are D-rated, which usually means shorter tenancies and higher turnover. Who's the typical renter profile here, and what's been the actual vacancy rate?
- The area grade is low — what's the realistic commute time and amenity access for the typical tenant pool here? Any planned neighborhood developments (good or bad) we should know about?
- What's the average days-on-market for RENTAL listings here right now (not sales)? A rising rental-DOM trend means longer vacancies and softer asking-rent achievability than the comps imply.
- What's the recent tenant-quality profile in this submarket — average credit score on applications, eviction rate, late-payment / NSF rate, and stable-employment percentage? A property-management company in the area should have these aggregated.
- How much new apartment / multifamily construction is in the pipeline within 1–3 miles? Heavy new supply (>2% of stock underway) typically softens rents 12–24 months out; light construction supports rent growth.
Investment metrics
- 1% rule
- 1.02% ✓
- Cap rate
- 8.77%
- Cash-on-cash
- 8.86%
- DSCR
- 1.39
- GRM
- 8.2
CMA / ARV
- ARV (median comp)
- $245,918
- List price
- $340,000
- Delta
- 38.26%
- Verdict
- OVERPRICED
- Comps
- 4 within 1.0 mi
Projected returns pro-forma
-3.0% appreciation · 3.0% rent growth · sell at horizon
- IRR
- -10.8%
- Equity multiple
- 0.61×
- Total profit
- $-37,372
- Equity at exit
- $50,695
- IRR
- -1.4%
- Equity multiple
- 0.90×
- Total profit
- $-9,376
- Equity at exit
- $29,397
Cash invested: $95,200 (down + closing). Projections, not guarantees.
Landlord ↔ Tenant lean methodology
- Overall (STATE)
- 28 Tenant-Leaning
- State Washington
- 28 Tenant-Leaning · D+8
- County
- — inherits STATE
- City
- — inherits STATE
ZIP-level market 98550
- Active inventory
- 154
- Price-to-rent
- 16.3×
Monthly cashflow live
- Estimated rent
- $3,473 medium interval (Pro) →
- Mortgage (P&I)
- −$1,783
- Tax from tax record
- −$116 /mo · $1,394/yr
- Insurance
- −$142
- Flood insurance flood zone
- −$427 /mo · $5,118/yr
- HOA
- −$0
- Vacancy / Maint / Mgmt
- −$729
- Net cashflow
- $276
Break-even live
Sensitivity live
| Price | -10% $469 | -5% $373 | +0% $276 | +5% $180 | +10% $84 |
|---|---|---|---|---|---|
| Rent | -10% $2 | -5% $139 | +0% $276 | +5% $413 | +10% $551 |
| Rate | -1.0pp $448 | -0.5pp $363 | base $276 | +0.5pp $188 | +1.0pp $99 |
2-unit breakdown (identical units grouped — click to expand)
| Units | Beds | Baths | Est. rent |
|---|---|---|---|
| 2× units | 2 | 1 | $3,474 |
| #1 | 2 | 1 | $1,737 |
| #2 | 2 | 1 | $1,737 |
| Total (2 units) | $3,473 | ||
UW: 25.0% down · 7.5% · 30yr · 1.5% tax · 5.0% vac · 8.0% maint · 8.0% mgmt
Financing live
Cash to close
- Down payment
- $85,000
- Closing costs
- $10,200
- Reserves months
- —
- Total cash needed
- —
Loan-product check · same deal, 3 products live
Conventional
25% down · 7.5% · 30yr
- Down + closing
- —
- Monthly P&I
- —
- Monthly cashflow
- —
- DSCR
- —
- Eligible?
- —
Personal DTI + credit; lowest rate.
DSCR
20% down · 8.5% · 30yr
- Down + closing
- —
- Monthly P&I
- —
- Monthly cashflow
- —
- DSCR
- —
- Eligible?
- —
No personal income docs; deal must DSCR.
Hard money
10% down · 12.0% · 12mo
- Down + closing
- —
- Monthly P&I
- —
- Monthly cashflow
- —
- DSCR
- —
- Eligible?
- —
Short-term bridge; refi at stabilization.
Rent comps 1 comps
| Address | Beds | Baths | Sqft | Rent | $/sqft | DOM | Units | Dist |
|---|---|---|---|---|---|---|---|---|
| 829 Emerson Ave Hoquiam, WA | 4.0 | 2.0 | 1800 | $1,800 | $1.00 | 44d | 1 | 0.52mi |
Listing history 23 events
-
2026-06-19days on market $340,000 Active 128 DOM
-
2026-06-18days on market $340,000 Active 127 DOM
-
2026-06-17days on market $340,000 Active 126 DOM
-
2026-06-16days on market $340,000 Active 125 DOM
-
2026-06-15days on market $340,000 Active 124 DOM
-
2026-06-14days on market $340,000 Active 122 DOM
-
2026-06-12days on market $340,000 Active 121 DOM
-
2026-06-09days on market $340,000 Active 118 DOM
-
2026-06-08days on market $340,000 Active 117 DOM
-
2026-06-07days on market $340,000 Active 116 DOM
-
2026-06-05days on market $340,000 Active 113 DOM
-
2026-06-03days on market $340,000 Active 112 DOM
-
2026-06-02days on market $340,000 Active 111 DOM
-
2026-06-01days on market $340,000 Active 110 DOM
-
2026-05-31days on market $340,000 Active 109 DOM
-
2026-05-30days on market $340,000 Active 108 DOM
-
2026-02-11$340,000 Active
-
2023-02-10soldstatus $150,000 Closed
-
2023-01-24status Pending
-
2022-11-25price $180,000
-
2022-10-16$210,000 Active
-
2014-03-26soldstatus $26,300
-
2007-06-20soldstatus $100,000
ⓘ Source: listings_history table (triggers on properties + properties_extension) + one-shot
backfill from property_details.listing_events for pre-trigger history.
Tax reassessment forecast WA · Resets to sale price
- Current annual tax
- $1,394 · $116/mo
- Projected year-2 tax
- $3,332 · $278/mo
- Expected delta
- +$1,938/yr (+$162/mo · 139.0%)
ⓘ Screening estimate from a state-policy table — verify with the county assessor before closing.
Climate risk First Street
- Flood 8/10 Severe FEMA zone AE · 99% chance over 30 yrs
- Wildfire 1/10 Low
- Heat 1/10 Low 8 d/yr ≥75°F today · 18 d/yr by 30 yrs out
- Wind 1/10 Low
- Air quality 6/10 Major 6 unhealthy d/yr today · 6 by 30 yrs out
Nearby sold comps map
Loading sold comps map…
Walkable amenities ~0.75 mi
Loading nearby amenities…
Taxation est. · year 1
- Rental income
- $41,676
- − Mortgage interest
- −$19,045
- − Property taxes
- −$1,394
- − Insurance
- −$6,818
- − Repairs & maintenance
- −$3,334
- − Management
- −$3,334
- − Depreciation
- −$9,891
- Taxable loss
- −$2,141
- Est. tax savings @ 24.0%
- +$514
- After-tax cash flow
- $3,829/yr
For passive investors: Depreciation is non-cash, so a rental often shows a tax loss while cash-flowing — sheltering income. Rental losses are passive: they offset passive income freely, and up to $25,000/yr can offset ordinary (W-2) income if you actively participate and your MAGI is under $100k (phasing out to $0 by $150k); unused losses carry forward. On sale, claimed depreciation is recaptured at up to 25%, and gains may owe capital-gains tax (a 1031 exchange can defer both). Figures are a year-1 estimate at your 24.0% rate — not tax advice; consult a CPA.
Schools (NCES district)
- District
- Hoquiam School District
- NCES district ID
- 5303660
- Math proficiency
- 30% ▬ 0.00%
- Reading proficiency
- 41% ▲ 1.00%
- Median HH income
- $39,039
- Composite
- 32.31/100
- National rank
- #10914
- State rank
- #250 of 291 in WA
Livability — Hoquiam
- Score
- 75/100
- State rank
- #171
- US rank
- #4268
Category grades
Schools grade is shown separately in the Schools card above.
Census & demographics
- Census place
- Hoquiam, WA
- County
- Grays Harbor County · 44,693 people
- City population
- 12,316
- Metro
- Aberdeen, WA
- Population (ZIP)
- 12,316
- Household income
- $55,040
- Rent vs Own
- Severe rent burden
- 438.0
Population outlook (Grays Harbor County) Hauer SSP2
- Today (2025)
- 66,443 people
- By 2030
- 63,255 · -4.8%
- By 2040
- 56,466 · -15.0%
- By 2050
- 50,516 · -24.0%
- By 2075
- 39,296 · -40.9%
- By 2100
- 31,142 · -53.1%
Race, ethnicity, and origin ACS 2023
- Neighborhood character
- Predominantly White (82%)
- Race & ethnicity
- White 82% Hispanic / Latino 6% Two or more races 6% Native American 4% Asian 2% Black 1%
- Hispanic origin (detail)
- Mexican 5%
- Common ancestry
- Portuguese 6% Romanian 4% Slovak 3%
- Foreign-born
- 4% · Canada, China
- Languages at home
- 94% English-only · Spanish 4% Chinese 1% Russian/Polish/Slavic 1%
Political lean MEDSL · Grays Harbor
- 2024 margin
- Lean R (+6.0) · D 45.6% · R 51.6% · Other 2.8%
- 2008→2024 swing
- -20.6pp toward R · 2008: 14.6pp · 2024: -6.0pp
- All cycles
- 2024: R+6.0 2020: R+6.6 2016: R+7.1 2012: D+14.0 2008: D+14.6
Not yet ingested
- Civics
- —
Market trends
- HPI YoY
- ▼ -136.94%
- Current HPI
- 249.3102
- Rent YoY
- —
- Metro
- Aberdeen, WA
- State GDP YoY
- ▲ 4.65%
- F500 in state
- 22
Industry mix (Fortune 500 HQ in WA)
| Industry | F500 HQs | Revenue |
|---|---|---|
| Retail | 2 | $269B |
|
||
| Technology / Retail | 1 | $638B |
|
||
| Technology | 1 | $245B |
|
||
| Telecommunications | 1 | $38B |
|
||
| Food / Beverage | 1 | $36B |
|
||
| Automotive / Trucks | 1 | $34B |
|
||
Price history
+240.0% since first listed7 events — show timeline
- 2026-02-11 Listed $340,000 NWMLS as Distributed by MLS Grid
- 2023-02-10 Sold (MLS) $150,000 NWMLS as Distributed by MLS Grid
- 2023-01-24 Pending — NWMLS as Distributed by MLS Grid
- 2022-11-25 Price Changed $180,000 NWMLS as Distributed by MLS Grid
- 2022-10-16 Listed $210,000 NWMLS as Distributed by MLS Grid
- 2014-03-26 Sold (Public Records) $26,300 Public Records
- 2007-06-20 Sold (Public Records) $100,000 Public Records
Property tax history
+2.5%/yrLatest (2026): $1,394 · +8.9% YoY. Source: county tax records.
Cash-flow waterfall
monthlySold comps — $/sqft
last 12 mo · ≤1 miLoading sold comps…