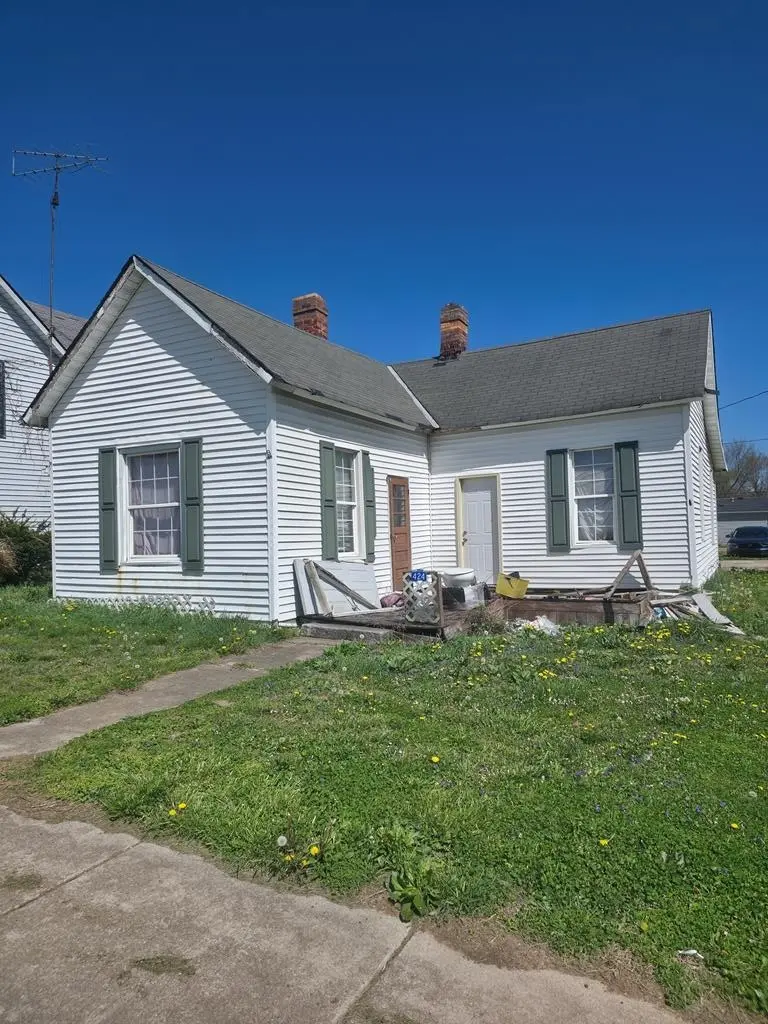
424 N Main St · Hamden, OH
Flood risk 1/10 · Minimal
- FEMA flood zone
- X
- Chance of flooding over 30 yrs
- 0.0%
- Est. flood insurance / yr
- $507 – $1,088
Fire risk 4/10 · Minor
- Est. fire insurance / yr
- $713 – $1,323
Heat risk 4/10 · Minor
- Hot days now (above 101°F)
- 7 days/yr
- Hot days in 30 yrs
- 19 days/yr
Wind risk 2/10 · Minimal
- Chance of severe wind over 30 yrs
- 1.0%
Air-quality risk 2/10 · Minimal
- Unhealthy air days now
- 0 days/yr
- Unhealthy air days in 30 yrs
- 1 days/yr
Risk factors via First Street. Map © Google.
Why this score? — see what drove the B+ grade
The composite is a weighted blend of 9 inputs, each scored 0–100. Each bar is that input's sub-score; the figure is the points it added to the 100-point composite (weight × sub-score).
- Cash flow +30.0/30.0
- 1% rule +10.0/10.0
- DSCR +10.0/10.0
- ARV discount +7.5/15.0
- Appreciation +6.5/10.0
- Schools +3.9/10.0
- Livability +3.1/5.0
- Rent growth +2.5/5.0
- Condition / age +2.5/5.0
$39,000
🖨 Deal sheet (PDF) 📄 Offer letter ✓ Due diligence
Listing remarks MLS
If you have been looking for a project to do this year, this is it!! House is ready for you to come in and fix it up!
Key facts
- Rental investment
- Detached garage
- Fixer-upper
Tags
Property features AI
Finance
- Other: Residential property; Total rooms: 7
Exterior
- Parking: Detached garage; Open parking; Concrete parking surfaces
- Utilities: Public water; Public sewer; 100 amp electric service
- Home design: Single-family residence; One story
- Construction: Vinyl siding
- Exterior features: No subdivision; Directions: From Wellston, take State Route 93 north into Vinton County; once entering Hamden the house will be on the right
Interior
- Kitchen: Electric water heater
- Bedrooms: 2 main-level bedrooms
- Flooring: Carpet; Vinyl; Wood
- Bathrooms: 1 full bathroom (main level)
- Heating & cooling: Electric forced-air heating
- Interior features: Eat-in kitchen; Double pane windows; Crawl space basement
- Laundry & utility: Dedicated laundry room
Neighborhood map
What this means for you Summary
Snapshot
- This is a 2-bed/1.0-bath single-family listed at $39k.
Deal economics
- At list price, monthly cash flow is $466 ($6k/yr) — positive.
- The deal already cash-flows at list — no discount required.
- Meets the 1% rule at list price ($957 rent vs $39k).
- Recommended offer: $38k (3.0% below list) — sets the bar for market timing.
Location & tenants
- Location reads 62/100 on livability (#893 in OH) — a middle-class / working-renter tenant base. Strengths: cost of living A+, housing A+; Watch: health & safety C-, crime D-, amenities F.
- Vinton County Local (rural): math 45% / reading 48% proficiency, ranked #495 of 656 in OH (top 76%) — families likely to look elsewhere, expect single-tenant / working-renter base with shorter leases.
- Zoned schools: Vinton County Middle School (math 37% / reading 42%, grade F, #519 of 654 statewide, top 80%, 403 students, 0% FRL); Vinton County High School (math 27% / reading 47%, grade F, #564 of 781 statewide, top 74%, 547 students, 0% FRL) — zoned schools average 0% FRL vs 60% district-wide (60 pts lower); this property's tenant base skews higher-income than the district average.
- Market conditions: 16 active listings in the ZIP.
Forward outlook
- In year one you build about $1k of equity ($270 loan paydown + $1k appreciation (3.0% local appreciation)).
- Vinton County population projected at -22% by 2050 — secular population decline; favor cash flow + early exit over multi-decade hold.
- At projected returns (3.0% appreciation + 3.0% rent growth), your $11k cash investment doubles in ~2 years — after that, you're playing with house money.
Negotiation context
- It's been on market 40 days — a 3% lower offer ($38k) is reasonable based on typical stale-listing flexibility.
- 2 sale attempts since 3y ago with the ask held roughly flat each time — persistent listings suggest the price (not the market) is what's stuck; bring a comps-based counter.
- Current owner paid $17k; list at $39k implies a 129% gain — meaningful room to come down on a strong offer.
Risks & watch-outs
- Watch-outs: built in 1941 — expect roof / HVAC / electrical / plumbing capex.
Questions for the listing agent
- It's been on market 40 days. Have you received any prior offers? Is the seller open to a 3% concession, seller financing, or rate buy-down credit?
- Built in 1941 — when were the roof, HVAC, electrical panel, plumbing, and water heater last replaced?
- Is there a deadline driving the sale (1031 exchange, divorce, estate, relocation)? That informs how much negotiation room exists.
- Crime grade is D in this area — have there been break-ins, vandalism, or insurance claims at this property in the last 3 years? What carrier currently insures it and at what premium?
- What's the average days-on-market for RENTAL listings here right now (not sales)? A rising rental-DOM trend means longer vacancies and softer asking-rent achievability than the comps imply.
- What's the recent tenant-quality profile in this submarket — average credit score on applications, eviction rate, late-payment / NSF rate, and stable-employment percentage? A property-management company in the area should have these aggregated.
- How much new for-sale + rental construction is in the pipeline within 1–3 miles? Heavy new supply typically softens prices + rents 12–24 months out; constrained supply supports both.
Investment metrics
- 1% rule
- 2.45% ✓
- Cap rate
- 20.63%
- Cash-on-cash
- 51.22%
- DSCR
- 3.28
- GRM
- 3.4
CMA / ARV
- ARV (median comp)
- $121,555
- List price
- $39,000
- Delta
- -67.92%
- Verdict
- UNDERPRICED
- Comps
- 10 within 1.0 mi
Show comp detail 2 sales within ~0.75 mi
| Address | Dist | Beds/Ba | Sqft | Sold | Price | $/sf | Match |
|---|---|---|---|---|---|---|---|
| 155 N Mckinnis Ave | 0.16mi | 2/1.0 | 1,008 (-3%) | 22mo | $110,000 | $109 | 70 |
| 128 Church St | 0.29mi | 2/1.0 | 955 (-8%) | 23mo | $97,000 | $102 | 54 |
Match score weights: distance 35% · size 25% · config 20% · recency 20%. Top-matched comps best support the ARV.
Projected returns pro-forma
3.02% appreciation · 3.0% rent growth · sell at horizon
- IRR
- 56.4%
- Equity multiple
- 4.16×
- Total profit
- $34,462
- Equity at exit
- $17,591
- IRR
- 56.0%
- Equity multiple
- 8.42×
- Total profit
- $81,057
- Equity at exit
- $27,153
Cash invested: $10,920 (down + closing). Projections, not guarantees.
Landlord ↔ Tenant lean methodology
- Overall (STATE)
- 73 Landlord-Friendly
- State Ohio
- 73 Landlord-Friendly · R+6
- County
- — inherits STATE
- City
- — inherits STATE
ZIP-level market 45634
- Home prices YoY
- 2.1%
- Active inventory
- 16
- Price-to-rent
- 3.4×
Monthly cashflow live
- Estimated rent
- $957 medium interval (Pro) →
- Mortgage (P&I)
- −$205
- Tax from tax record
- −$69 /mo · $828/yr
- Insurance
- −$16
- HOA
- −$0
- Vacancy / Maint / Mgmt
- −$201
- Net cashflow
- $466
Break-even live
Sensitivity live
| Price | -10% $488 | -5% $477 | +0% $466 | +5% $455 | +10% $444 |
|---|---|---|---|---|---|
| Rent | -10% $390 | -5% $428 | +0% $466 | +5% $504 | +10% $542 |
| Rate | -1.0pp $486 | -0.5pp $476 | base $466 | +0.5pp $456 | +1.0pp $446 |
UW: 25.0% down · 7.5% · 30yr · 1.5% tax · 5.0% vac · 8.0% maint · 8.0% mgmt
Financing live
Cash to close
- Down payment
- $9,750
- Closing costs
- $1,170
- Reserves months
- —
- Total cash needed
- —
Loan-product check · same deal, 3 products live
Conventional
25% down · 7.5% · 30yr
- Down + closing
- —
- Monthly P&I
- —
- Monthly cashflow
- —
- DSCR
- —
- Eligible?
- —
Personal DTI + credit; lowest rate.
DSCR
20% down · 8.5% · 30yr
- Down + closing
- —
- Monthly P&I
- —
- Monthly cashflow
- —
- DSCR
- —
- Eligible?
- —
No personal income docs; deal must DSCR.
Hard money
10% down · 12.0% · 12mo
- Down + closing
- —
- Monthly P&I
- —
- Monthly cashflow
- —
- DSCR
- —
- Eligible?
- —
Short-term bridge; refi at stabilization.
Listing history 18 events
-
2026-06-21days on market $39,000 Active 40 DOM
-
2026-06-18days on market $39,000 Active 38 DOM
-
2026-06-17days on market $39,000 Active 37 DOM
-
2026-06-16days on market $39,000 Active 36 DOM
-
2026-06-15days on market $39,000 Active 35 DOM
-
2026-06-13days on market $39,000 Active 33 DOM
-
2026-06-12days on market $39,000 Active 32 DOM
-
2026-06-09days on market $39,000 Active 29 DOM
-
2026-06-08days on market $39,000 Active 28 DOM
-
2026-06-08days on market $39,000 Active 27 DOM
-
2026-06-04days on market $39,000 Active 23 DOM
-
2026-06-02days on market $39,000 Active 22 DOM
-
2026-06-01days on market $39,000 Active 21 DOM
-
2026-05-31days on market $39,000 Active 20 DOM
-
2026-05-11$39,000 Active 532-char remark
-
2023-02-22soldstatus $17,000 117-char remark
Show marketing remark (117 chars)
If you have been looking for a project to do this year, this is it!! House is ready for you to come in and fix it up!
-
2023-01-19$17,000 117-char remark
Show marketing remark (117 chars)
If you have been looking for a project to do this year, this is it!! House is ready for you to come in and fix it up!
-
2011-10-26soldstatus $18,000
ⓘ Source: listings_history table (triggers on properties + properties_extension) + one-shot
backfill from property_details.listing_events for pre-trigger history.
Tax reassessment forecast OH · Partial reset (capped growth)
- Current annual tax
- $828 · $69/mo
- Projected year-2 tax
- $828 · $69/mo
- Expected delta
- $0/yr ($0/mo · 0.0%)
ⓘ Screening estimate from a state-policy table — verify with the county assessor before closing.
Climate risk First Street
- Flood 1/10 Low FEMA zone X · 0% chance over 30 yrs
- Wildfire 4/10 Moderate
- Heat 4/10 Moderate 7 d/yr ≥101°F today · 19 d/yr by 30 yrs out
- Wind 2/10 Low 100% chance of damaging wind over 30 yrs
- Air quality 2/10 Low 0 unhealthy d/yr today · 1 by 30 yrs out
Nearby sold comps map
Loading sold comps map…
Walkable amenities ~0.75 mi
Loading nearby amenities…
Taxation est. · year 1
- Rental income
- $11,482
- − Mortgage interest
- −$2,185
- − Property taxes
- −$828
- − Insurance
- −$195
- − Repairs & maintenance
- −$919
- − Management
- −$919
- − Depreciation
- −$1,135
- Taxable income
- $5,302
- Est. tax owed @ 24.0%
- −$1,273
- After-tax cash flow
- $4,321/yr
For passive investors: Depreciation is non-cash, so a rental often shows a tax loss while cash-flowing — sheltering income. Rental losses are passive: they offset passive income freely, and up to $25,000/yr can offset ordinary (W-2) income if you actively participate and your MAGI is under $100k (phasing out to $0 by $150k); unused losses carry forward. On sale, claimed depreciation is recaptured at up to 25%, and gains may owe capital-gains tax (a 1031 exchange can defer both). Figures are a year-1 estimate at your 24.0% rate — not tax advice; consult a CPA.
Schools (NCES district)
- District
- Vinton County Local
- NCES district ID
- 3905039
- Math proficiency
- 45% ▼ -15.00%
- Reading proficiency
- 48% ▼ -14.00%
- Median HH income
- $37,809
- Composite
- 38.71/100
- National rank
- #4139
- State rank
- #495 of 656 in OH
Livability — Hamden
- Score
- 62/100
- State rank
- #893
- US rank
- #16927
Category grades
Schools grade is shown separately in the Schools card above.
Census & demographics
- Census place
- Hamden, OH
- County
- Vinton · 12,723 people
- Population (ZIP)
- 1,562
- Household income
- $52,879
- Rent vs Own
- Severe rent burden
- 10.1
Population outlook (Vinton County) Hauer SSP2
- Today (2025)
- 12,330 people
- By 2030
- 11,849 · -3.9%
- By 2040
- 10,752 · -12.8%
- By 2050
- 9,625 · -21.9%
- By 2075
- 7,265 · -41.1%
- By 2100
- 5,520 · -55.2%
Race, ethnicity, and origin ACS 2023
- Neighborhood character
- Predominantly White (98%)
- Race & ethnicity
- White 98% Two or more races 1%
- Common ancestry
- Portuguese 2% Slovak 2% Scandinavian 2%
- Foreign-born
- 2%
Political lean MEDSL · Vinton
- 2024 margin
- Solid R (+58.6) · D 20.4% · R 79.0%
- 2008→2024 swing
- -48.7pp toward R · 2008: -9.9pp · 2024: -58.6pp
- All cycles
- 2024: R+58.6 2020: R+54.8 2016: R+45.7 2012: R+7.8 2008: R+9.9
Not yet ingested
- Civics
- —
Market trends
- HPI YoY
- ▲ 3.02%
- Current HPI
- 145.8483
- Rent YoY
- —
- Metro
- —
- State GDP YoY
- ▲ 1.98%
- F500 in state
- 48
Industry mix (Fortune 500 HQ in OH)
| Industry | F500 HQs | Revenue |
|---|---|---|
| Insurance | 3 | $145B |
|
||
| Industrial Machinery | 3 | $49B |
|
||
| Financial Services | 3 | $24B |
|
||
| Consumer Goods | 2 | $93B |
|
||
| Aerospace / Defense | 2 | $47B |
|
||
| Utilities | 2 | $33B |
|
||
Price history
+116.7% since first listed4 events — show timeline
- 2026-05-11 Listed $39,000 SVAR
- 2023-02-22 Sold (MLS) $17,000 ACBOR
- 2023-01-19 Listed $17,000 ACBOR
- 2011-10-26 Sold (Public Records) $18,000 Public Records
Property tax history
+4.9%/yrLatest (2025): $828 · -0.3% YoY. Source: county tax records.
Cash-flow waterfall
monthlySold comps — $/sqft
last 12 mo · ≤1 miLoading sold comps…