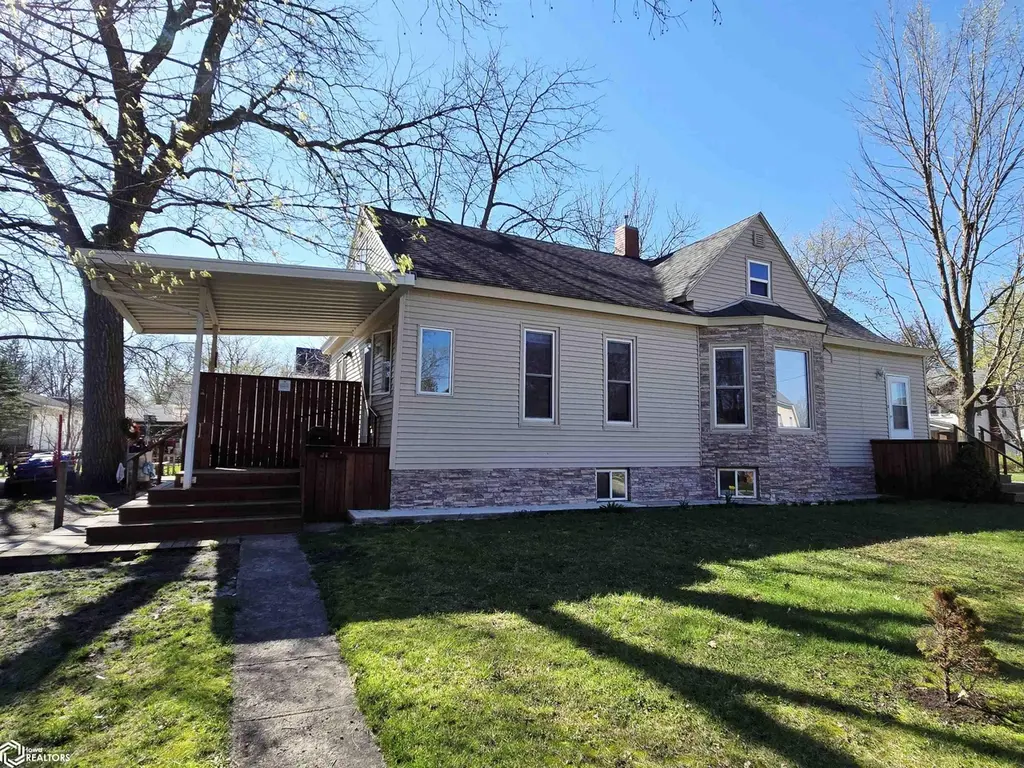
1403 Des Moines St · Webster City, IA
Flood risk 1/10 · Minimal
- FEMA flood zone
- X (unshaded)
- Chance of flooding over 30 yrs
- 0.0%
- Est. flood insurance / yr
- $473 – $860
Fire risk 4/10 · Minor
- Est. fire insurance / yr
- $902 – $1,676
Heat risk 2/10 · Minimal
- Hot days now (above 102°F)
- 7 days/yr
- Hot days in 30 yrs
- 16 days/yr
Wind risk 2/10 · Minimal
- Chance of severe wind over 30 yrs
- —
Air-quality risk 1/10 · Minimal
- Unhealthy air days now
- 0 days/yr
- Unhealthy air days in 30 yrs
- 0 days/yr
Risk factors via First Street. Map © Google.
Why this score? — see what drove the B+ grade
The composite is a weighted blend of 9 inputs, each scored 0–100. Each bar is that input's sub-score; the figure is the points it added to the 100-point composite (weight × sub-score).
- Cash flow +30.0/30.0
- ARV discount +14.5/15.0
- 1% rule +10.0/10.0
- DSCR +10.0/10.0
- Schools +5.1/10.0
- Livability +3.9/5.0
- Rent growth +2.5/5.0
- Condition / age +2.5/5.0
- Appreciation +0.0/10.0
$148,000
🖨 Deal sheet 📄 Offer letter ✓ Due diligence
Listing remarks MLS
This well-maintained 4-bedroom, 1.5-bath home sits on a large corner lot and offers an impressive garage with abundant storage and workshop space. The spacious kitchen features eat-in dining and flows seamlessly into the comfortable family room. The main floor includes two bedrooms and a beautifully updated ¾ bathroom. Upstairs, you’ll find two additional bedrooms, a versatile living area, and a convenient half bath. Numerous exterior updates enhance both curb appeal and long-term value. Don’t miss this fantastic opportunity, call today to schedule your private showing!
Key facts
- Workshop space
- Large corner lot
- Spacious kitchen
Tags
Neighborhood map
What this means for you Summary
Snapshot
- This is a 4-bed/1.5-bath single-family listed at $148k.
Deal economics
- At list price, monthly cash flow is $982 ($12k/yr) — positive.
- The deal already cash-flows at list — no discount required.
- Meets the 1% rule at list price ($2k rent vs $148k).
- Recommended offer: $144k (3.0% below list) — sets the bar for market timing.
- Cap rate 14.3% vs local median 4.3% in Webster City — top-decile yield for the area; either an underpriced asset or a hidden risk that comps aren't pricing in. Stress-test before assuming the spread holds.
Location & tenants
- Location reads 78/100 on livability (#137 in IA, #2,493 nationally) — a middle-class / working-renter tenant base. Strengths: cost of living A+, housing A+, health & safety A+; Watch: amenities F, commute F.
- Webster City Community School District (town): math 60% / reading 60% proficiency, ranked #250 of 289 in IA (top 86%) — acceptable for families but not a draw, mixed tenant base, ~2y average lease.
- Market conditions: 83 active listings in the ZIP; 1 comparable units currently listed for rent nearby; 29 units permitted in Hamilton County in 2024 (5 in 5+ unit buildings).
Forward outlook
- Local home prices are declining (-3.0%/yr); year-one equity from $1k of loan paydown is wiped out by about $4k of value loss. Plan a longer hold.
- Hamilton County population projected at -15% by 2050 — secular population decline; favor cash flow + early exit over multi-decade hold.
- At projected returns (-3.0% appreciation + 3.0% rent growth), your $41k cash investment doubles in ~5 years — after that, you're playing with house money.
Negotiation context
- It's been on market 59 days — a 3% lower offer ($144k) is reasonable based on typical stale-listing flexibility.
- 3 sale attempts since 5y ago with the ask held roughly flat each time — persistent listings suggest the price (not the market) is what's stuck; bring a comps-based counter.
- Current owner paid $95k; list at $148k implies a 56% gain — meaningful room to come down on a strong offer.
Risks & watch-outs
- Watch-outs: built in 1888 — expect roof / HVAC / electrical / plumbing capex.
Questions for the listing agent
- It's been on market 59 days. Have you received any prior offers? Is the seller open to a 3% concession, seller financing, or rate buy-down credit?
- Built in 1888 — when were the roof, HVAC, electrical panel, plumbing, and water heater last replaced?
- Is there a deadline driving the sale (1031 exchange, divorce, estate, relocation)? That informs how much negotiation room exists.
- Schools are B-rated — typically a magnet for longer-tenancy family renters. What's the average tenant stay here, and is there a school-zone premium baked into asking?
- What's the average days-on-market for RENTAL listings here right now (not sales)? A rising rental-DOM trend means longer vacancies and softer asking-rent achievability than the comps imply.
- What's the recent tenant-quality profile in this submarket — average credit score on applications, eviction rate, late-payment / NSF rate, and stable-employment percentage? A property-management company in the area should have these aggregated.
- How much new for-sale + rental construction is in the pipeline within 1–3 miles? Heavy new supply typically softens prices + rents 12–24 months out; constrained supply supports both.
Investment metrics
- 1% rule
- 1.69% ✓
- Cap rate
- 14.26%
- Cash-on-cash
- 28.44%
- DSCR
- 2.27
- GRM
- 4.9
CMA / ARV
- ARV (median comp)
- $175,401
- List price
- $148,000
- Delta
- -15.62%
- Verdict
- UNDERPRICED
- Comps
- 20 within 1.0 mi
Show comp detail 12 sales within ~0.75 mi
| Address | Dist | Beds/Ba | Sqft | Sold | Price | $/sf | Match |
|---|---|---|---|---|---|---|---|
| 714 Walnut St | 0.07mi | 3/2.0 (-1) | 2,018 (+2%) | 10mo | $157,000 | $78 | 79 |
| 907 Walnut St | 0.28mi | 4/2.5 | 1,973 (-1%) | 4mo | $180,000 | $91 | 78 |
| 637 Boone St | 0.05mi | 4/2.5 | 1,838 (-8%) | 4mo | $165,000 | $90 | 78 |
| 1314 Des Moines St | 0.05mi | 3/2.5 (-1) | 2,102 (+6%) | 6mo | $180,000 | $86 | 74 |
| 808 Elm St | 0.19mi | 3/2.0 (-1) | 2,073 (+4%) | 5mo | $185,000 | $89 | 73 |
| 1418 Willson Ave | 0.15mi | 3/1.5 (-1) | 1,764 (-11%) | 6mo | $74,000 | $42 | 64 |
| 805 Cedar St | 0.13mi | 3/2.0 (-1) | 1,755 (-12%) | 6mo | $187,000 | $107 | 63 |
| 924 Walnut St | 0.31mi | 3/2.0 (-1) | 1,724 (-13%) | 2mo | $63,050 | $37 | 55 |
| 1110 Elm St | 0.53mi | 5/1.5 (+1) | 1,828 (-8%) | 4mo | $135,000 | $74 | 54 |
| 1409 Grove St | 0.37mi | 3/2.0 (-1) | 1,724 (-13%) | 3mo | $235,000 | $136 | 51 |
| 1021 Water St | 0.47mi | 3/1.5 (-1) | 1,752 (-12%) | 9mo | $145,000 | $83 | 46 |
| 115 Parkview Dr | 0.63mi | 3/3.0 (-1) | 1,904 (-4%) | 10mo | $210,000 | $110 | 44 |
Match score weights: distance 35% · size 25% · config 20% · recency 20%. Top-matched comps best support the ARV.
Projected returns pro-forma
-3.0% appreciation · 3.0% rent growth · sell at horizon
- IRR
- 22.7%
- Equity multiple
- 1.93×
- Total profit
- $38,584
- Equity at exit
- $22,067
- IRR
- 30.7%
- Equity multiple
- 3.76×
- Total profit
- $114,215
- Equity at exit
- $12,796
Cash invested: $41,440 (down + closing). Projections, not guarantees.
Landlord ↔ Tenant lean methodology
- Overall (STATE)
- 83 Strongly Landlord-Friendly
- State Iowa
- 83 Strongly Landlord-Friendly · R+6
- County
- — inherits STATE
- City
- — inherits STATE
ZIP-level market 50595
- Home prices YoY
- -20.7%
- Active inventory
- 83
- Price-to-rent
- 4.9×
Monthly cashflow live
- Estimated rent
- $2,500 medium interval (Pro) →
- Mortgage (P&I)
- −$776
- Tax from tax record
- −$155 /mo · $1,862/yr
- Insurance
- −$62
- HOA
- −$0
- Vacancy / Maint / Mgmt
- −$525
- Net cashflow
- $982
Break-even live
UW: 25.0% down · 7.5% · 30yr · 1.5% tax · 5.0% vac · 8.0% maint · 8.0% mgmt
Financing live
Cash to close
- Down payment
- $37,000
- Closing costs
- $4,440
- Reserves months
- —
- Total cash needed
- —
Loan-product check · same deal, 3 products live
Conventional
25% down · 7.5% · 30yr
- Down + closing
- —
- Monthly P&I
- —
- Monthly cashflow
- —
- DSCR
- —
- Eligible?
- —
Personal DTI + credit; lowest rate.
DSCR
20% down · 8.5% · 30yr
- Down + closing
- —
- Monthly P&I
- —
- Monthly cashflow
- —
- DSCR
- —
- Eligible?
- —
No personal income docs; deal must DSCR.
Hard money
10% down · 12.0% · 12mo
- Down + closing
- —
- Monthly P&I
- —
- Monthly cashflow
- —
- DSCR
- —
- Eligible?
- —
Short-term bridge; refi at stabilization.
Rent comps 1 comps
| Address | Beds | Baths | Sqft | Rent | $/sqft | DOM | Units | Dist |
|---|---|---|---|---|---|---|---|---|
| 2505 N Terrace Dr Webster City, IA | 3.0 | 2.0 | 1583 | $2,500 | $1.58 | 43d | 1 | 0.93mi |
Listing history 22 events
-
2026-06-19days on market $148,000 Active 59 DOM
-
2026-06-18days on market $148,000 Active 58 DOM
-
2026-06-17days on market $148,000 Active 57 DOM
-
2026-06-16days on market $148,000 Active 56 DOM
-
2026-06-15days on market $148,000 Active 55 DOM
-
2026-06-14pricedays on market $148,000 Active 53 DOM
-
2026-06-12days on market $150,000 Active 52 DOM
-
2026-06-09days on market $150,000 Active 49 DOM
-
2026-06-08days on market $150,000 Active 48 DOM
-
2026-06-07days on market $150,000 Active 47 DOM
-
2026-06-03days on market $150,000 Active 43 DOM
-
2026-06-02days on market $150,000 Active 42 DOM
-
2026-06-01days on market $150,000 Active 41 DOM
-
2026-05-31days on market $150,000 Active 40 DOM
-
2026-05-30days on market $150,000 Active 39 DOM
-
2026-04-30price $150,000 595-char remark
Show marketing remark (595 chars)
This well-maintained 4-bedroom, 1.5-bath home sits on a large corner lot and offers an impressive garage with abundant storage and workshop space. The spacious kitchen features eat-in dining and flows seamlessly into the comfortable family room. The main floor includes two bedrooms and a beautifully updated ¾ bathroom. Upstairs, you’ll find two additional bedrooms, a versatile living area, and a convenient half bath. Numerous exterior updates enhance both curb appeal and long-term value. Don’t miss this fantastic opportunity, call today to schedule your private showing!
-
2026-04-16$155,000 Active 595-char remark
Show marketing remark (595 chars)
This well-maintained 4-bedroom, 1.5-bath home sits on a large corner lot and offers an impressive garage with abundant storage and workshop space. The spacious kitchen features eat-in dining and flows seamlessly into the comfortable family room. The main floor includes two bedrooms and a beautifully updated ¾ bathroom. Upstairs, you’ll find two additional bedrooms, a versatile living area, and a convenient half bath. Numerous exterior updates enhance both curb appeal and long-term value. Don’t miss this fantastic opportunity, call today to schedule your private showing!
-
2026-03-09price $155,000
-
2026-01-16$160,000 Active
-
2021-06-30soldstatus $95,000
-
2021-06-30soldstatus $95,000
-
2021-05-27$108,900
ⓘ Source: listings_history table (triggers on properties + properties_extension) + one-shot
backfill from property_details.listing_events for pre-trigger history.
Tax reassessment forecast IA · Partial reset (capped growth)
- Current annual tax
- $1,862 · $155/mo
- Projected year-2 tax
- $2,093 · $174/mo
- Expected delta
- +$231/yr (+$19/mo · 12.4%)
ⓘ Screening estimate from a state-policy table — verify with the county assessor before closing.
Climate risk First Street
- Flood 1/10 Low FEMA zone X (unshaded) · 0% chance over 30 yrs
- Wildfire 4/10 Moderate
- Heat 2/10 Low 7 d/yr ≥102°F today · 16 d/yr by 30 yrs out
- Wind 2/10 Low
- Air quality 1/10 Low 0 unhealthy d/yr today · 0 by 30 yrs out
Nearby sold comps map
Loading sold comps map…
Walkable amenities ~0.75 mi
Loading nearby amenities…
Taxation est. · year 1
- Rental income
- $30,000
- − Mortgage interest
- −$8,290
- − Property taxes
- −$1,862
- − Insurance
- −$740
- − Repairs & maintenance
- −$2,400
- − Management
- −$2,400
- − Depreciation
- −$4,305
- Taxable income
- $10,002
- Est. tax owed @ 24.0%
- −$2,401
- After-tax cash flow
- $9,384/yr
For passive investors: Depreciation is non-cash, so a rental often shows a tax loss while cash-flowing — sheltering income. Rental losses are passive: they offset passive income freely, and up to $25,000/yr can offset ordinary (W-2) income if you actively participate and your MAGI is under $100k (phasing out to $0 by $150k); unused losses carry forward. On sale, claimed depreciation is recaptured at up to 25%, and gains may owe capital-gains tax (a 1031 exchange can defer both). Figures are a year-1 estimate at your 24.0% rate — not tax advice; consult a CPA.
Schools (NCES district)
- District
- Webster City Community School District
- NCES district ID
- 1930630
- Math proficiency
- 60% ▼ -7.00%
- Reading proficiency
- 60% ▲ 2.00%
- Median HH income
- $45,510
- Composite
- 50.65/100
- National rank
- #1831
- State rank
- #250 of 289 in IA
Livability — Webster City
- Score
- 78/100
- State rank
- #137
- US rank
- #2493
Category grades
Schools grade is shown separately in the Schools card above.
Census & demographics
- Census place
- Webster City, IA
- City population
- 8,768
- Population (ZIP)
- 8,768
Population outlook (Hamilton County) Hauer SSP2
- Today (2025)
- 14,602 people
- By 2030
- 14,210 · -2.7%
- By 2040
- 13,312 · -8.8%
- By 2050
- 12,469 · -14.6%
- By 2075
- 11,449 · -21.6%
- By 2100
- 10,806 · -26.0%
Race, ethnicity, and origin ACS 2023
- Neighborhood character
- Predominantly White (79%)
- Race & ethnicity
- White 79% Hispanic / Latino 15% Two or more races 8% Asian 2% Black 2%
- Hispanic origin (detail)
- Mexican 11%
- Common ancestry
- Portuguese 10% Lithuanian 2% Iranian 2%
- Foreign-born
- 9% · Canada, China
- Languages at home
- 85% English-only · Spanish 13% Other Asian/Pacific 1% German/W. Germanic 1%
Political lean MEDSL · Hamilton
- 2024 margin
- Solid R (+33.3) · D 32.8% · R 66.1% · Other 1.1%
- 2008→2024 swing
- -34.6pp toward R · 2008: 1.3pp · 2024: -33.3pp
- All cycles
- 2024: R+33.3 2020: R+26.6 2016: R+22.9 2012: R+2.7 2008: D+1.3
Not yet ingested
- Civics
- —
Market trends
- HPI YoY
- ▼ -47.55%
- Current HPI
- 182.2704
- Rent YoY
- —
- Metro
- —
- State GDP YoY
- ▲ 2.48%
- F500 in state
- 4
Industry mix (Fortune 500 HQ in IA)
| Industry | F500 HQs | Revenue |
|---|---|---|
| Financial Services | 1 | $16B |
|
||
| Retail / Convenience | 1 | $15B |
|
||
Price history
+37.7% since first listed7 events — show timeline
- 2026-04-30 Price Changed $150,000 IAR
- 2026-04-16 Listed $155,000 IAR
- 2026-03-09 Price Changed $155,000 IAR
- 2026-01-16 Listed $160,000 IAR
- 2021-06-30 Sold (Public Records) $95,000 Public Records
- 2021-06-30 Sold (MLS) $95,000 IAR
- 2021-05-27 Listed $108,900 IAR
Property tax history
+7.5%/yrLatest (2025): $1,862 · +0.4% YoY. Source: county tax records.
Cash-flow waterfall
monthlySold comps — $/sqft
last 12 mo · ≤1 miLoading sold comps…