 Duplex
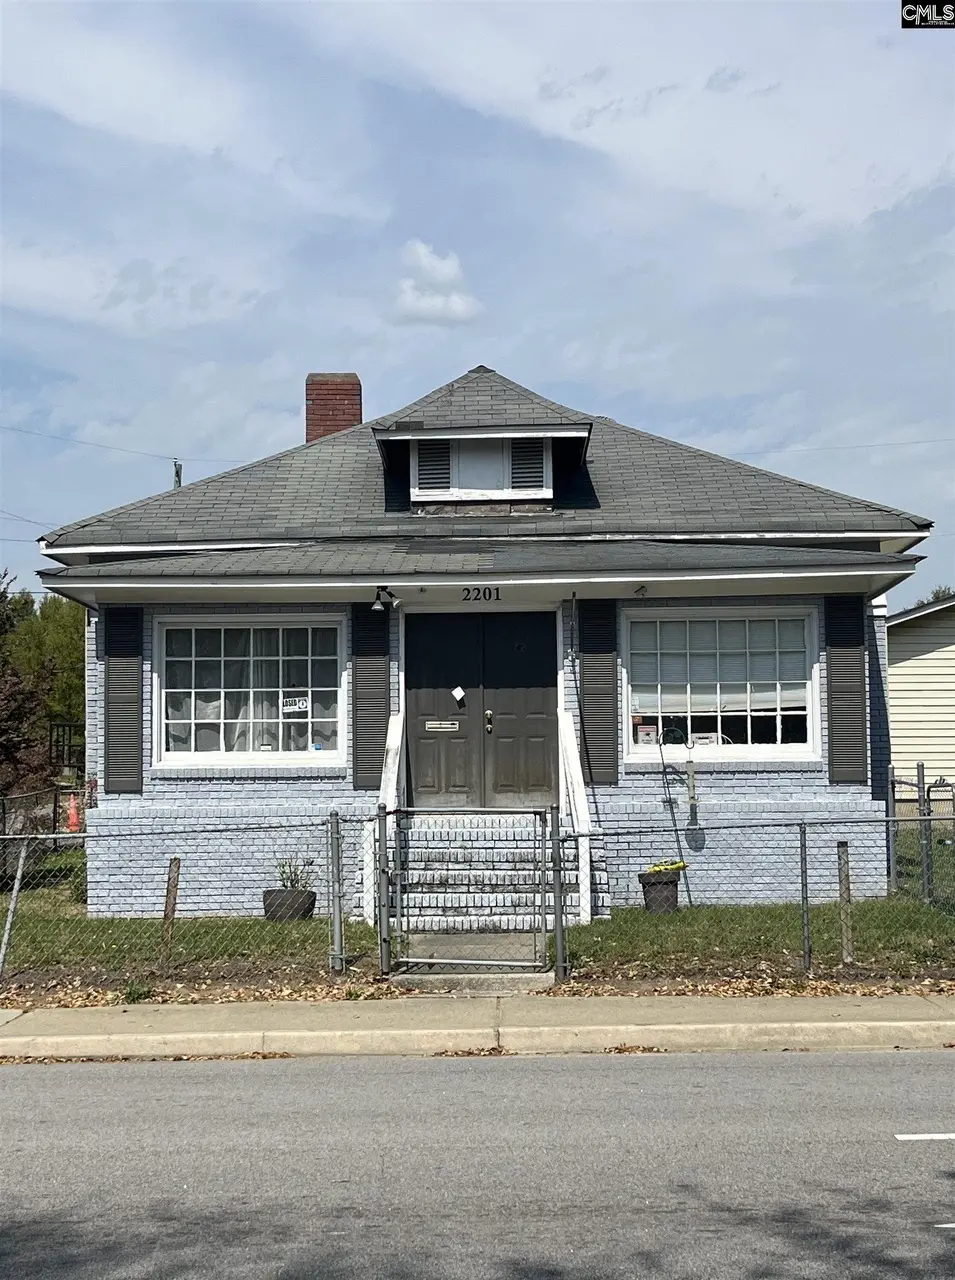
2201 Marshall St · Columbia, SC
Flood risk No data
- FEMA flood zone
- —
- Chance of flooding over 30 yrs
- —
- Est. flood insurance / yr
- —
Fire risk No data
- Est. fire insurance / yr
- —
Heat risk No data
- Hot days now (above threshold)
- —
- Hot days in 30 yrs
- —
Wind risk No data
- Chance of severe wind over 30 yrs
- —
Air-quality risk No data
- Unhealthy air days now
- —
- Unhealthy air days in 30 yrs
- —
Risk factors via First Street. Map © Google.
Why this score? — see what drove the D+ grade
The composite is a weighted blend of 9 inputs, each scored 0–100. Each bar is that input's sub-score; the figure is the points it added to the 100-point composite (weight × sub-score).
- Cash flow +19.1/30.0
- ARV discount +7.5/15.0
- DSCR +6.0/10.0
- 1% rule +5.1/10.0
- Livability +3.9/5.0
- Rent growth +3.1/5.0
- Schools +2.6/10.0
- Condition / age +2.5/5.0
- Appreciation +0.0/10.0
$320,000
🖨 Deal sheet 📄 Offer letter ✓ Due diligence
Multi-family units
County records classify this as Multi-Family (2-4 Unit). Listing-text estimate: 2 units. confirmed
Listing remarks
The opportunity of a lifetime to get into this upwardly appreciating neighborhood with income-producing units close the new USC medical facility being built less than a mile from the office in the Bull Street District!! This particular duplex with adjoining office has SO MUCH potential and income will only increase over time. The duplex has served as an Airbnb rental (SEE PICS) with income average at least $1500/month per unit, but currently has long term tenants renting for $1000 and $1200/month with the office that could provide (minimal) $1500 once rented. In Office, there are hardwoods underneath all rooms (except front waiting area and back laundry room/storage/bath). HVAC in office ar
Key facts
- New window units
- Airbnb rental
- New electric panels
Tags
Property features AI
Finance
- Other: Property used as multifamily with three units
- Financial info: Unit 1 rent: $1,000; Unit 2 rent: $1,200; Unit 3 rent: not listed
Exterior
- Parking: Five parking spaces (unassigned/shared parking)
- Utilities: Public water; Public sewer (owner pays sewer); Trash service paid by owner
- Home design: Single-story building
- Construction: Foundation: crawlspace and slab
- Exterior features: Paved road access; Exterior finished with asbestos, partial brick above foundation, and vinyl
Interior
- Kitchen: No appliance details provided
- Bedrooms: Unit 1: 2 bedrooms; Unit 2: 2 bedrooms; Unit 3: 2 bedrooms
- Bathrooms: Total full bathrooms: 2; Unit 1: 1 full bath; Unit 2: 1 full bath; Unit 3: 1 half bath
- Heating & cooling: Baseboard heating; Electric heating; Other heating features (see remarks); Window unit cooling; Heating paid by tenants
- Interior features: Three total units; Owner handles lawn maintenance; Pest control provided by owner
- Laundry & utility: Electricity paid by tenants; Water paid by tenants
Neighborhood map
What this means for you Summary
Snapshot
- This is a 2 × 3-bed/1.0-bath units multifamily listed at $320k. Condition is rated fair.
Deal economics
- At list price, monthly cash flow is $342 ($4k/yr) — positive. Per door: $171/mo.
- The deal already cash-flows at list — no discount required.
- Meets the 1% rule at list price ($3k rent vs $320k).
- Recommended offer: $301k (6.0% below list) — sets the bar for market timing.
- Cap rate 7.6% vs local median 5.0% in Columbia — top-decile yield for the area; either an underpriced asset or a hidden risk that comps aren't pricing in. Stress-test before assuming the spread holds.
Location & tenants
- Location reads 78/100 on livability (#18 in SC, #2,436 nationally) — a middle-class / working-renter tenant base. Strengths: amenities A+, commute A+, cost of living A+; Watch: employment D, crime F.
- Richland 01 (urban): math 26% / reading 36% proficiency, ranked #54 of 80 in SC (top 68%) — families likely to look elsewhere, expect single-tenant / working-renter base with shorter leases; 64% free/reduced lunch — lower-income household profile, screen leases tightly.
- Zoned schools: Watkins-Nance Elementary (math 17% / reading 27%, grade F, #475 of 597 statewide, top 81%, 383 students, 100% FRL); C. A. Johnson High (math 34% / reading 84%, grade C+, #110 of 196 statewide, top 58%, 364 students, 100% FRL) — zoned schools average 100% FRL vs 64% district-wide (36 pts higher); higher-poverty schools than district average — tighter screening recommended.
- Market conditions: Rents rising (+2.5%/yr); 238 active listings in the ZIP; 3,472 units permitted in Richland County in 2024 (1,096 in 5+ unit buildings).
- At $3,232/mo this rent would consume 84% of the median local household income ($46k/yr) (locally 1980% of renters already pay >50% of income on rent) — very limited rent-growth headroom before tenants either downsize or default.
Forward outlook
- Local home prices are declining (-3.0%/yr); year-one equity from $2k of loan paydown is wiped out by about $10k of value loss. Plan a longer hold.
- Richland County population projected at +30% by 2050 — long-run rental-demand tailwind backs the buy-and-hold thesis.
Negotiation context
- It's been on market 86 days — a 6% lower offer ($301k) is reasonable based on typical stale-listing flexibility.
Questions for the listing agent
- It's been on market 86 days. Have you received any prior offers? Is the seller open to a 6% concession, seller financing, or rate buy-down credit?
- Can we see the unit-by-unit rent roll, current vacancy, and any below-market leases? What's the average tenancy length?
- What capital expenditures (roof, boiler, parking lot, exteriors) have been made in the last 5 years, and what's planned in the next 2?
- Have any recent inspections been done? Can we get a copy of the seller's disclosures and any deferred-maintenance estimates?
- Why hasn't it sold? Are there any deal-killer items the seller is aware of (foundation, flood, title, zoning, code violations)?
- Is there a deadline driving the sale (1031 exchange, divorce, estate, relocation)? That informs how much negotiation room exists.
- Schools are D-rated, which usually means shorter tenancies and higher turnover. Who's the typical renter profile here, and what's been the actual vacancy rate?
- Crime grade is F in this area — have there been break-ins, vandalism, or insurance claims at this property in the last 3 years? What carrier currently insures it and at what premium?
- The area grade is low — what's the realistic commute time and amenity access for the typical tenant pool here? Any planned neighborhood developments (good or bad) we should know about?
- What's the average days-on-market for RENTAL listings here right now (not sales)? A rising rental-DOM trend means longer vacancies and softer asking-rent achievability than the comps imply.
- What's the recent tenant-quality profile in this submarket — average credit score on applications, eviction rate, late-payment / NSF rate, and stable-employment percentage? A property-management company in the area should have these aggregated.
- How much new apartment / multifamily construction is in the pipeline within 1–3 miles? Heavy new supply (>2% of stock underway) typically softens rents 12–24 months out; light construction supports rent growth.
Investment metrics
- 1% rule
- 1.01% ✓
- Cap rate
- 7.57%
- Cash-on-cash
- 4.58%
- DSCR
- 1.20
- GRM
- 8.3
CMA / ARV
No comps found within radius.
Projected returns pro-forma
-3.0% appreciation · 2.5% rent growth · sell at horizon
- IRR
- -9.7%
- Equity multiple
- 0.65×
- Total profit
- $-31,652
- Equity at exit
- $47,713
- IRR
- -1.0%
- Equity multiple
- 0.93×
- Total profit
- $-5,902
- Equity at exit
- $27,668
Cash invested: $89,600 (down + closing). Projections, not guarantees.
Landlord ↔ Tenant lean methodology
- Overall (STATE)
- 90 Strongly Landlord-Friendly
- State South Carolina
- 90 Strongly Landlord-Friendly · R+6
- County
- — inherits STATE
- City
- — inherits STATE
ZIP-level market 29203
- Home prices YoY
- -31.6%
- Rents YoY
- 2.5%
- Active inventory
- 238
- Price-to-rent
- 16.5×
Monthly cashflow live
- Estimated rent
- $3,232 high interval (Pro) →
- Mortgage (P&I)
- −$1,678
- Tax est. 1.5%
- −$400 /mo · $4,800/yr
- Insurance
- −$133
- HOA
- −$0
- Vacancy / Maint / Mgmt
- −$679
- Net cashflow
- $342
Break-even live
2-unit breakdown (identical units grouped — click to expand)
| Units | Beds | Baths | Est. rent |
|---|---|---|---|
| 2× units | 3 | 1 | $3,232 |
| #1 | 3 | 1 | $1,616 |
| #2 | 3 | 1 | $1,616 |
| Total (2 units) | $3,232 | ||
UW: 25.0% down · 7.5% · 30yr · 1.5% tax · 5.0% vac · 8.0% maint · 8.0% mgmt
Financing live
Cash to close
- Down payment
- $80,000
- Closing costs
- $9,600
- Reserves months
- —
- Total cash needed
- —
Loan-product check · same deal, 3 products live
Conventional
25% down · 7.5% · 30yr
- Down + closing
- —
- Monthly P&I
- —
- Monthly cashflow
- —
- DSCR
- —
- Eligible?
- —
Personal DTI + credit; lowest rate.
DSCR
20% down · 8.5% · 30yr
- Down + closing
- —
- Monthly P&I
- —
- Monthly cashflow
- —
- DSCR
- —
- Eligible?
- —
No personal income docs; deal must DSCR.
Hard money
10% down · 12.0% · 12mo
- Down + closing
- —
- Monthly P&I
- —
- Monthly cashflow
- —
- DSCR
- —
- Eligible?
- —
Short-term bridge; refi at stabilization.
Listing history 16 events
-
2026-06-19price $320,000 Active 86 DOM
-
2026-06-18days on market $325,000 Active 86 DOM
-
2026-06-17days on market $325,000 Active 85 DOM
-
2026-06-16days on market $325,000 Active 84 DOM
-
2026-06-15days on market $325,000 Active 83 DOM
-
2026-06-14days on market $325,000 Active 81 DOM
-
2026-06-10days on market $325,000 Active 78 DOM
-
2026-06-09days on market $325,000 Active 77 DOM
-
2026-06-08days on market $325,000 Active 76 DOM
-
2026-06-07days on market $325,000 Active 75 DOM
-
2026-06-03pricedays on market $325,000 Active 71 DOM
-
2026-06-03days on market $340,000 Active 70 DOM
-
2026-06-01days on market $340,000 Active 69 DOM
-
2026-05-31days on market $340,000 Active 68 DOM
-
2026-05-07price $340,000
-
2026-03-23$350,000 Active
ⓘ Source: listings_history table (triggers on properties + properties_extension) + one-shot
backfill from property_details.listing_events for pre-trigger history.
Nearby sold comps map
Loading sold comps map…
Walkable amenities ~0.75 mi
Loading nearby amenities…
Taxation est. · year 1
- Rental income
- $38,784
- − Mortgage interest
- −$17,925
- − Property taxes
- −$4,800
- − Insurance
- −$1,600
- − Repairs & maintenance
- −$3,103
- − Management
- −$3,103
- − Depreciation
- −$9,309
- Taxable loss
- −$1,056
- Est. tax savings @ 24.0%
- +$253
- After-tax cash flow
- $4,355/yr
For passive investors: Depreciation is non-cash, so a rental often shows a tax loss while cash-flowing — sheltering income. Rental losses are passive: they offset passive income freely, and up to $25,000/yr can offset ordinary (W-2) income if you actively participate and your MAGI is under $100k (phasing out to $0 by $150k); unused losses carry forward. On sale, claimed depreciation is recaptured at up to 25%, and gains may owe capital-gains tax (a 1031 exchange can defer both). Figures are a year-1 estimate at your 24.0% rate — not tax advice; consult a CPA.
Condition & rehab AI · 13 photos
This multi-family property requires moderate repairs and maintenance, particularly to the exterior and interior walls. Upgrading the exterior and interior appearance would significantly increase its resale and rental value.
Repairs flagged
- Major roof — Aged appearance suggests potential leaks or structural issues.
- Major exterior siding — Weathered appearance indicates need for repainting or replacement.
- Minor interior walls — Faded paint suggests touch-up or repainting is needed.
- Minor bathroom tiles — Worn appearance indicates cleaning or minor repairs are needed.
Value-add opportunities
- Both Painting and updating exterior siding — Enhances curb appeal and property value.
- Both Interior painting and minor repairs — Improves interior appearance and functionality.
- Both Landscaping and curb appeal improvements — Enhances property value and attracts potential buyers/tenants.
Renovation cost estimate screening
| Repair item | Severity | Est. cost |
|---|---|---|
| roof · Aged appearance suggests potential leaks or structural issues. | Major | $15,000–50,000 |
| exterior siding · Weathered appearance indicates need for repainting or replacement. | Major | $15,000–50,000 |
| interior walls · Faded paint suggests touch-up or repainting is needed. | Minor | $500–3,000 |
| bathroom tiles · Worn appearance indicates cleaning or minor repairs are needed. | Minor | $500–3,000 |
| Total estimated repair cost · 4 items | $31,000–106,000 |
Value-add ROI direction
- Both Painting and updating exterior siding — Enhances curb appeal and property value. ↑
- Both Interior painting and minor repairs — Improves interior appearance and functionality. ↑
- Both Landscaping and curb appeal improvements — Enhances property value and attracts potential buyers/tenants. ↑
ⓘ Cost ranges are severity-bucket heuristics (US national rule-of-thumb). Get contractor quotes + a written scope before underwriting a rehab budget.
Schools (NCES district)
- District
- Richland 01
- NCES district ID
- 4503360
- Math proficiency
- 26% ▼ -7.00%
- Reading proficiency
- 36% ▼ -5.00%
- Median HH income
- $38,931
- Composite
- 25.94/100
- National rank
- #7335
- State rank
- #54 of 80 in SC
Livability — Columbia
- Score
- 78/100
- State rank
- #18
- US rank
- #2436
Category grades
Schools grade is shown separately in the Schools card above.
Census & demographics
- Census place
- Columbia, SC
- County
- Richland County · 389,530 people
- City population
- 335,994
- Metro
- Columbia, SC
- Population (ZIP)
- 40,653
- Household income
- $46,054
- Rent vs Own
- Severe rent burden
- 1980.0
Population outlook (Richland County) Hauer SSP2
- Today (2025)
- 459,667 people
- By 2030
- 487,524 · +6.1%
- By 2040
- 542,035 · +17.9%
- By 2050
- 595,371 · +29.5%
- By 2075
- 732,998 · +59.5%
- By 2100
- 820,415 · +78.5%
Race, ethnicity, and origin ACS 2023
- Neighborhood character
- Predominantly Black (80%)
- Race & ethnicity
- Black 80% White 13% Hispanic / Latino 5% Two or more races 2%
- Common ancestry
- Serbian 1%
- Foreign-born
- 3% · Canada
- Languages at home
- 93% English-only · Spanish 5%
Political lean MEDSL · Richland
- 2024 margin
- Solid D (+34.6) · D 66.4% · R 31.8% · Other 1.8%
- 2008→2024 swing
- +5.7pp toward D · 2008: 28.9pp · 2024: 34.6pp
- All cycles
- 2024: D+34.6 2020: D+38.3 2016: D+32.9 2012: D+33.3 2008: D+28.9
Not yet ingested
- Civics
- —
Market trends
- HPI YoY
- ▼ -77.52%
- Current HPI
- 168.2114
- Rent YoY
- ▲ 2.50%
- Metro
- Columbia, SC
- State GDP YoY
- ▲ 4.51%
- F500 in state
- 2
Industry mix (Fortune 500 HQ in SC)
| Industry | F500 HQs | Revenue |
|---|---|---|
| Packaging | 1 | $7B |
|
||
Price history
-2.9% since first listed2 events — show timeline
- 2026-05-07 Price Changed $340,000 Consolidated MLS
- 2026-03-23 Listed $350,000 Consolidated MLS
Cash-flow waterfall
monthlySold comps — $/sqft
last 12 mo · ≤1 miLoading sold comps…