 🏷️ Likely Rental
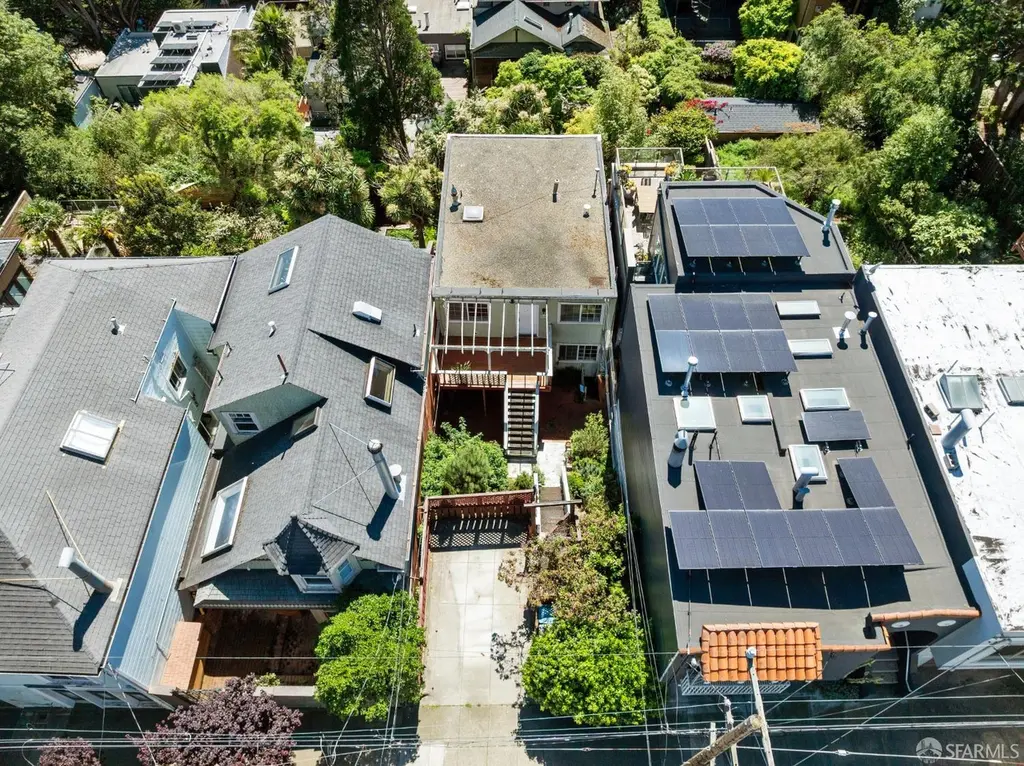
543-545 28th St · San Francisco, CA
Flood risk 1/10 · Minimal
- FEMA flood zone
- X (unshaded)
- Chance of flooding over 30 yrs
- 0.0%
- Est. flood insurance / yr
- $507 – $1,088
Fire risk 1/10 · Minimal
- Est. fire insurance / yr
- $659 – $1,223
Heat risk 2/10 · Minimal
- Hot days now (above 76°F)
- 7 days/yr
- Hot days in 30 yrs
- 17 days/yr
Wind risk 1/10 · Minimal
- Chance of severe wind over 30 yrs
- —
Air-quality risk 7/10 · Major
- Unhealthy air days now
- 13 days/yr
- Unhealthy air days in 30 yrs
- 13 days/yr
Risk factors via First Street. Map © Google.
Why this score? — see what drove the C+ grade
The composite is a weighted blend of 9 inputs, each scored 0–100. Each bar is that input's sub-score; the figure is the points it added to the 100-point composite (weight × sub-score).
- Cash flow +20.4/30.0
- ARV discount +15.0/15.0
- DSCR +6.5/10.0
- Rent growth +5.0/5.0
- Schools +5.0/10.0
- 1% rule +4.4/10.0
- Livability +3.8/5.0
- Condition / age +2.5/5.0
- Appreciation +0.0/10.0
$999,000
🖨 Deal sheet 📄 Offer letter ✓ Due diligence
Multi-family units
County records classify this as Multi-Family (2-4 Unit). Listing-text estimate: 2 units. confirmed
Listing remarks MLS
A property with great upside and potential for investors and owner-occupiers that features a 1,750 sq. ft. two unit building, carport, front and rear yards, and nice views on a special Noe Valley block with multimillion dollar homes. The big 2,850 sq. ft. lot presents a value-add opportunity for a ground-up reimagining, expansion, or an owner-occupied renovation. The upper unit is vacant and the lower unit is tenant occupied. The bright upper unit has 2 bedrooms, 1 bathroom, open living and dining area with a fireplace and skylight, kitchen, and views of hills, trees, and the Bay. The lower unit has 2 bedrooms, 1 bathroom, open living and dining area, kitchen, and views of the garden and trees. There are spacious storage areas and a laundry area below the lower unit. Blocks from the beloved Noe Valley 24th St. corridor with its many popular restaurants, cafes, and shops. By multiple parks and open spaces. Near Glen Park and Bernal Heights. Access to public transportation and freeways. This property has been loved by the owners for decades and hasn't been on the market in over 40 years. Expansion and development possibilities should be independently verified by buyers and not guaranteed by sellers or listing agents.
Key facts
- 2,850 sq ft lot
- Parking
- Listed 65 days
Neighborhood map
What this means for you Summary
Snapshot
- This is a 2 × 2-bed/1.0-bath units multifamily listed at $999k.
Deal economics
- At list price, monthly cash flow is $1k ($16k/yr) — positive. Per door: $647/mo.
- The deal already cash-flows at list — no discount required.
- To meet the 1% rule (rent ≥ 1% of price), the offer needs to be $938k (6.1% below list).
- Recommended offer: $938k (6.1% below list) — sets the bar for 1% rule.
- Cap rate 7.8% vs local median 2.1% in San Francisco — top-decile yield for the area; either an underpriced asset or a hidden risk that comps aren't pricing in. Stress-test before assuming the spread holds.
Location & tenants
- Location reads 76/100 on livability (#90 in CA, #3,143 nationally) — a middle-class / working-renter tenant base. Strengths: amenities A+, commute A+, employment A+; Watch: crime F, cost of living F.
- San Francisco Unified (urban): math 50% / reading 56% proficiency, ranked #322 of 1,400 in CA (top 23%) — acceptable for families but not a draw, mixed tenant base, ~2y average lease.
- Market conditions: Rents rising fast (+14.1%/yr); 94 active listings in the ZIP; 22 comparable units currently listed for rent nearby; rentals lingering (median 44d on market — plan ~5-8 weeks vacancy on turnover, expect pricing pressure); 50% of comp listings sitting > 30 days — soft ceiling on asking rent; high-income renter base; 750 units permitted in San Francisco County in 2024 (688 in 5+ unit buildings).
- At $9,381/mo this rent would consume 57% of the median local household income ($199k/yr) (locally 865% of renters already pay >50% of income on rent) — very limited rent-growth headroom before tenants either downsize or default.
Forward outlook
- Local home prices are declining (-3.0%/yr); year-one equity from $7k of loan paydown is wiped out by about $30k of value loss. Plan a longer hold.
- San Francisco County population projected at +39% by 2050 — long-run rental-demand tailwind backs the buy-and-hold thesis.
- At projected returns (-3.0% appreciation + 8.0% rent growth), your $280k cash investment doubles in ~9 years — after that, you're playing with house money.
Negotiation context
- It's been on market 65 days — a 6% lower offer ($939k) is reasonable based on typical stale-listing flexibility.
Risks & watch-outs
- Watch-outs: built in 1910 — expect roof / HVAC / electrical / plumbing capex.
Questions for the listing agent
- It's been on market 65 days. Have you received any prior offers? Is the seller open to a 6% concession, seller financing, or rate buy-down credit?
- Can we see the unit-by-unit rent roll, current vacancy, and any below-market leases? What's the average tenancy length?
- What capital expenditures (roof, boiler, parking lot, exteriors) have been made in the last 5 years, and what's planned in the next 2?
- Built in 1910 — when were the roof, HVAC, electrical panel, plumbing, and water heater last replaced?
- Why hasn't it sold? Are there any deal-killer items the seller is aware of (foundation, flood, title, zoning, code violations)?
- Is there a deadline driving the sale (1031 exchange, divorce, estate, relocation)? That informs how much negotiation room exists.
- Schools are B-rated — typically a magnet for longer-tenancy family renters. What's the average tenant stay here, and is there a school-zone premium baked into asking?
- Crime grade is F in this area — have there been break-ins, vandalism, or insurance claims at this property in the last 3 years? What carrier currently insures it and at what premium?
- What's the average days-on-market for RENTAL listings here right now (not sales)? A rising rental-DOM trend means longer vacancies and softer asking-rent achievability than the comps imply.
- What's the recent tenant-quality profile in this submarket — average credit score on applications, eviction rate, late-payment / NSF rate, and stable-employment percentage? A property-management company in the area should have these aggregated.
- How much new apartment / multifamily construction is in the pipeline within 1–3 miles? Heavy new supply (>2% of stock underway) typically softens rents 12–24 months out; light construction supports rent growth.
Investment metrics
- 1% rule
- 0.94% ✗
- Cap rate
- 7.85%
- Cash-on-cash
- 5.56%
- DSCR
- 1.25
- GRM
- 8.9
CMA / ARV
- ARV (median comp)
- $1,455,004
- List price
- $999,000
- Delta
- -31.34%
- Verdict
- UNDERPRICED
- Comps
- 20 within 1.0 mi
Show comp detail 6 sales within ~0.75 mi
| Address | Dist | Beds/Ba | Sqft | Sold | Price | $/sf | Match |
|---|---|---|---|---|---|---|---|
| 449 27th St | 0.26mi | 3/2.0 (-1) | 1,785 (+2%) | 9mo | $1,204,000 | $675 | 72 |
| 1635-1637 Sanchez St | 0.34mi | 4/2.0 | 1,771 (+1%) | 20mo | $1,250,000 | $706 | 66 |
| 79-81 Homestead St | 0.44mi | 4/— | 1,950 (+11%) | 10mo | $1,300,000 | $667 | 52 |
| 236-236B 27th St | 0.48mi | 4/3.0 | 1,864 (+6%) | 13mo | $1,735,000 | $931 | 52 |
| 3821-3823 26th St | 0.56mi | 4/3.0 | 1,840 (+5%) | 12mo | $1,275,000 | $693 | 51 |
| 330 Chattanooga St | 0.64mi | 3/3.0 (-1) | 1,660 (-5%) | 17mo | $1,260,000 | $759 | 38 |
Match score weights: distance 35% · size 25% · config 20% · recency 20%. Top-matched comps best support the ARV.
Projected returns pro-forma
-3.0% appreciation · 8.0% rent growth · sell at horizon
- IRR
- -2.7%
- Equity multiple
- 0.89×
- Total profit
- $-30,173
- Equity at exit
- $148,954
- IRR
- 11.4%
- Equity multiple
- 2.09×
- Total profit
- $304,175
- Equity at exit
- $86,375
Cash invested: $279,720 (down + closing). Projections, not guarantees.
Landlord ↔ Tenant lean methodology
- Overall (CITY)
- 0 Strongly Tenant-Friendly
- State California
- 18 Strongly Tenant-Friendly · D+13
- County
- — inherits STATE
- City San Francisco
- 0 Strongly Tenant-Friendly · D+57
ZIP-level market 94131
- Rents YoY
- 14.1%
- Active inventory
- 94
- Price-to-rent
- 17.7×
Monthly cashflow live
- Estimated rent
- $9,381 high interval (Pro) →
- Mortgage (P&I)
- −$5,239
- Tax from tax record
- −$461 /mo · $5,532/yr
- Insurance
- −$416
- HOA
- −$0
- Vacancy / Maint / Mgmt
- −$1,970
- Net cashflow
- $1,295
Break-even live
2-unit breakdown (identical units grouped — click to expand)
| Units | Beds | Baths | Est. rent |
|---|---|---|---|
| 2× units | 2 | 1 | $9,380 |
| #1 | 2 | 1 | $4,690 |
| #2 | 2 | 1 | $4,690 |
| Total (2 units) | $9,381 | ||
UW: 25.0% down · 7.5% · 30yr · 1.5% tax · 5.0% vac · 8.0% maint · 8.0% mgmt
Financing live
Cash to close
- Down payment
- $249,750
- Closing costs
- $29,970
- Reserves months
- —
- Total cash needed
- —
Loan-product check · same deal, 3 products live
Conventional
25% down · 7.5% · 30yr
- Down + closing
- —
- Monthly P&I
- —
- Monthly cashflow
- —
- DSCR
- —
- Eligible?
- —
Personal DTI + credit; lowest rate.
DSCR
20% down · 8.5% · 30yr
- Down + closing
- —
- Monthly P&I
- —
- Monthly cashflow
- —
- DSCR
- —
- Eligible?
- —
No personal income docs; deal must DSCR.
Hard money
10% down · 12.0% · 12mo
- Down + closing
- —
- Monthly P&I
- —
- Monthly cashflow
- —
- DSCR
- —
- Eligible?
- —
Short-term bridge; refi at stabilization.
Rent comps 22 comps
| Address | Beds | Baths | Sqft | Rent | $/sqft | DOM | Units | Dist |
|---|---|---|---|---|---|---|---|---|
| 1626 Noe St San Francisco, CA | 3.0 | 2.0 | 1870 | $12,000 | $6.42 | 24d | 1 | 0.21mi |
| 1059 Noe St San Francisco, CA | 3.0 | 2.5 | 2545 | $14,000 | $5.50 | 43d | 1 | 0.50mi |
| 65 High St Unit NA San Francisco, CA | 4.0 | 3.0 | 2315 | $9,950 | $4.30 | 43d | 1 | 0.56mi |
| 753 Castro St San Francisco, CA | 4.0 | 3.0 | 2467 | $10,950 | $4.44 | 43d | 1 | 0.81mi |
| 79 Coleridge St San Francisco, CA | 3.0 | 2.0 | 1850 | $9,750 | $5.27 | 24d | 1 | 0.82mi |
| 22 Mountview Ct San Francisco, CA | 4.0 | 2.0 | 1900 | $7,400 | $3.89 | 43d | 1 | 0.91mi |
| 4058 20th St San Francisco, CA | 3.0 | 2.0 | 1794 | $13,975 | $7.79 | 24d | 1 | 0.91mi |
| 270 Eureka St San Francisco, CA | 3.0 | 1.0 | 2024 | $6,995 | $3.46 | 2d | 1 | 0.92mi |
| 2 Fair Oaks St #4 San Francisco, CA | 3.0 | 1.0 | 1513 | $9,900 | $6.54 | 18d | 1 | 0.95mi |
| 61 Marview Way San Francisco, CA | 3.0 | 2.0 | 1581 | $8,200 | $5.19 | 7d | 1 | 1.08mi |
| 61 Marview Way San Francisco, CA | 3.0 | 2.0 | 1581 | $8,450 | $5.34 | 24d | 1 | 1.08mi |
| 922 Valencia St Unit A San Francisco, CA | 3.0 | 2.5 | 1250 | $8,450 | $6.76 | 43d | 1 | 1.13mi |
| 922 Valencia St Apt C San Francisco, CA | 3.0 | 2.5 | 1300 | $7,950 | $6.12 | 43d | 1 | 1.13mi |
| 725 Capp St San Francisco, CA | 4.0 | 2.0 | 1350 | $5,490 | $4.07 | 43d | 1 | 1.14mi |
| 372 Cresta Vista Dr San Francisco, CA | 3.0 | 2.0 | 1581 | $9,400 | $5.95 | 43d | 1 | 1.18mi |
| 143 Corbett Ave San Francisco, CA | 4.0 | 4.0 | 2500 | $10,500 | $4.20 | 43d | 1 | 1.21mi |
| 569-571 Capp St San Francisco, CA | 3.0 | 1.0 | 1600 | $6,995 | $4.37 | 2d | 1 | 1.25mi |
| 3436 19th St Unit A San Francisco, CA | 3.0 | 2.0 | 1250 | $7,225 | $5.78 | 19d | 1 | 1.30mi |
| 230 Ridgewood Ave San Francisco, CA | 3.0 | 1.5 | 1932 | $5,750 | $2.98 | 43d | 1 | 1.38mi |
| 13 Warren Dr San Francisco, CA | 3.0 | 3.0 | 1900 | $8,750 | $4.61 | 43d | 1 | 1.40mi |
| 1265 Stanyan St San Francisco, CA | 3.0 | 2.0 | 2005 | $13,900 | $6.93 | 7d | 1 | 1.45mi |
| 454 Holladay Ave San Francisco, CA | 4.0 | 2.0 | 1500 | $8,500 | $5.67 | 18d | 1 | 1.46mi |
Listing history 16 events
-
2026-06-18status $999,000 Pending 65 DOM
-
2026-06-18days on market $999,000 Active 65 DOM
-
2026-06-17days on market $999,000 Active 64 DOM
-
2026-06-16days on market $999,000 Active 63 DOM
-
2026-06-15days on market $999,000 Active 62 DOM
-
2026-06-13days on market $999,000 Active 60 DOM
-
2026-06-13days on market $999,000 Active 59 DOM
-
2026-06-09days on market $999,000 Active 56 DOM
-
2026-06-08days on market $999,000 Active 55 DOM
-
2026-06-07days on market $999,000 Active 54 DOM
-
2026-06-04days on market $999,000 Active 51 DOM
-
2026-06-03days on market $999,000 Active 50 DOM
-
2026-06-02days on market $999,000 Active 49 DOM
-
2026-06-01days on market $999,000 Active 48 DOM
-
2026-05-31days on market $999,000 Active 47 DOM
-
2026-04-14$999,000 Active 1234-char remark
Show marketing remark (1234 chars)
A property with great upside and potential for investors and owner-occupiers that features a 1,750 sq. ft. two unit building, carport, front and rear yards, and nice views on a special Noe Valley block with multimillion dollar homes. The big 2,850 sq. ft. lot presents a value-add opportunity for a ground-up reimagining, expansion, or an owner-occupied renovation. The upper unit is vacant and the lower unit is tenant occupied. The bright upper unit has 2 bedrooms, 1 bathroom, open living and dining area with a fireplace and skylight, kitchen, and views of hills, trees, and the Bay. The lower unit has 2 bedrooms, 1 bathroom, open living and dining area, kitchen, and views of the garden and trees. There are spacious storage areas and a laundry area below the lower unit. Blocks from the beloved Noe Valley 24th St. corridor with its many popular restaurants, cafes, and shops. By multiple parks and open spaces. Near Glen Park and Bernal Heights. Access to public transportation and freeways. This property has been loved by the owners for decades and hasn't been on the market in over 40 years. Expansion and development possibilities should be independently verified by buyers and not guaranteed by sellers or listing agents.
ⓘ Source: listings_history table (triggers on properties + properties_extension) + one-shot
backfill from property_details.listing_events for pre-trigger history.
Tax reassessment forecast CA · Resets to sale price
- Current annual tax
- $5,532 · $461/mo
- Projected year-2 tax
- $7,592 · $633/mo
- Expected delta
- +$2,061/yr (+$172/mo · 37.3%)
ⓘ Screening estimate from a state-policy table — verify with the county assessor before closing.
Climate risk First Street
- Flood 1/10 Low FEMA zone X (unshaded) · 0% chance over 30 yrs
- Wildfire 1/10 Low
- Heat 2/10 Low 7 d/yr ≥76°F today · 17 d/yr by 30 yrs out
- Wind 1/10 Low
- Air quality 7/10 Severe 13 unhealthy d/yr today · 13 by 30 yrs out
Nearby sold comps map
Loading sold comps map…
Walkable amenities ~0.75 mi
Loading nearby amenities…
Taxation est. · year 1
- Rental income
- $112,572
- − Mortgage interest
- −$55,960
- − Property taxes
- −$5,532
- − Insurance
- −$4,995
- − Repairs & maintenance
- −$9,006
- − Management
- −$9,006
- − Depreciation
- −$29,062
- Taxable loss
- −$987
- Est. tax savings @ 24.0%
- +$237
- After-tax cash flow
- $15,776/yr
For passive investors: Depreciation is non-cash, so a rental often shows a tax loss while cash-flowing — sheltering income. Rental losses are passive: they offset passive income freely, and up to $25,000/yr can offset ordinary (W-2) income if you actively participate and your MAGI is under $100k (phasing out to $0 by $150k); unused losses carry forward. On sale, claimed depreciation is recaptured at up to 25%, and gains may owe capital-gains tax (a 1031 exchange can defer both). Figures are a year-1 estimate at your 24.0% rate — not tax advice; consult a CPA.
Schools (NCES district)
- District
- San Francisco Unified
- NCES district ID
- 0634410
- Math proficiency
- 50% ▬ 0.00%
- Reading proficiency
- 56% ▲ 1.00%
- Median HH income
- $81,249
- Composite
- 50.14/100
- National rank
- #4088
- State rank
- #322 of 1400 in CA
Livability — San Francisco
- Score
- 76/100
- State rank
- #90
- US rank
- #3143
Category grades
Schools grade is shown separately in the Schools card above.
Census & demographics
- Census place
- San Francisco, CA
- County
- San Francisco County · 827,552 people
- City population
- 827,552
- Metro
- San Francisco-Oakland-Berkeley, CA
- Population (ZIP)
- 28,504
- Household income
- $199,211
- Rent vs Own
- Severe rent burden
- 865.0
Population outlook (San Francisco County) Hauer SSP2
- Today (2025)
- 1,030,936 people
- By 2030
- 1,110,409 · +7.7%
- By 2040
- 1,270,010 · +23.2%
- By 2050
- 1,435,001 · +39.2%
- By 2075
- 1,779,074 · +72.6%
- By 2100
- 1,966,767 · +90.8%
Race, ethnicity, and origin ACS 2023
- Neighborhood character
- Diverse neighborhood (Simpson 0.66)
- Race & ethnicity
- White 51% Asian 23% Hispanic / Latino 13% Two or more races 13% Black 4%
- Hispanic origin (detail)
- Mexican 6%
- Common ancestry
- Lithuanian 4% Italian 4% Scotch-Irish 3%
- Foreign-born
- 25% · China, Canada, South Korea
- Languages at home
- 72% English-only · Chinese 8% Spanish 8% Other Indo-European 4%
Political lean MEDSL · San Francisco
- 2024 margin
- Solid D (+64.8) · D 80.3% · R 15.5% · Other 4.1%
- 2008→2024 swing
- -5.7pp toward R · 2008: 70.5pp · 2024: 64.8pp
- All cycles
- 2024: D+64.8 2020: D+72.5 2016: D+76.1 2012: D+70.2 2008: D+70.5
Not yet ingested
- Civics
- —
Market trends
- HPI YoY
- ▼ -1249.94%
- Current HPI
- 268.447
- Rent YoY
- ▲ 14.12%
- Metro
- San Francisco-Oakland-Berkeley, CA
- State GDP YoY
- ▲ 3.21%
- F500 in state
- 116
Industry mix (Fortune 500 HQ in CA)
| Industry | F500 HQs | Revenue |
|---|---|---|
| Technology | 27 | $1,492B |
|
||
| Financial Services | 3 | $174B |
|
||
| Retail | 3 | $44B |
|
||
| Insurance | 3 | $26B |
|
||
| Media / Entertainment | 2 | $115B |
|
||
| Pharmaceuticals / Biotech | 2 | $62B |
|
||
Price history
1 event — show timeline
- 2026-04-14 Listed $999,000 San Francisco MLS
Property tax history
+2.5%/yrLatest (2025): $5,532 · +4.0% YoY. Source: county tax records.
Cash-flow waterfall
monthlySold comps — $/sqft
last 12 mo · ≤1 miLoading sold comps…