4785 Mud Lake Rd · Constableville, NY
Flood risk 1/10 · Minimal
- FEMA flood zone
- X
- Chance of flooding over 30 yrs
- 0.0%
- Est. flood insurance / yr
- $473 – $860
Fire risk 3/10 · Minor
- Est. fire insurance / yr
- $691 – $1,283
Heat risk 1/10 · Minimal
- Hot days now (above 89°F)
- 7 days/yr
- Hot days in 30 yrs
- 16 days/yr
Wind risk 1/10 · Minimal
- Chance of severe wind over 30 yrs
- —
Air-quality risk 2/10 · Minimal
- Unhealthy air days now
- 0 days/yr
- Unhealthy air days in 30 yrs
- 1 days/yr
Risk factors via First Street. Map © Google.
Why this score? — see what drove the B- grade
The composite is a weighted blend of 9 inputs, each scored 0–100. Each bar is that input's sub-score; the figure is the points it added to the 100-point composite (weight × sub-score).
- Cash flow +25.8/30.0
- 1% rule +9.6/10.0
- DSCR +8.6/10.0
- ARV discount +7.5/15.0
- Appreciation +5.7/10.0
- Schools +4.1/10.0
- Livability +3.0/5.0
- Rent growth +2.5/5.0
- Condition / age +2.5/5.0
$85,000
🖨 Deal sheet 📄 Offer letter ✓ Due diligence
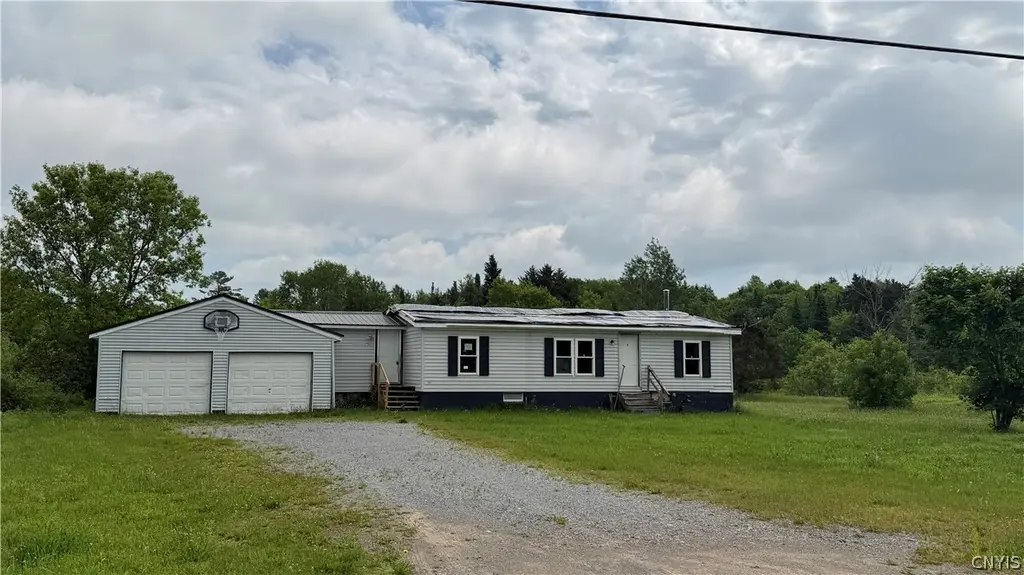
Listing remarks MLS
OPEN HOUSE - JULY 23, 2011 10:00AM - 12:00 NOON STOP IN AN VISIT. Updated double wide with a full walkout basement. Replacement windows and furnace since 2007.New doors. Nice back deck, fence in yard. Two stall garage, is insulated, electric heat, with garage door openers. All appliances will be staying, and if buyer wants furniture.
Key facts
- Eat in kitchen
- Large living room
- 5 acres of land
Tags
Property features AI
Exterior
- Parking: Attached garage; Two garage spaces
- Utilities: Electricity connected; Well water; Septic tank
- Home design: Single-story double-wide mobile home; Existing construction; Shingle roof
- Construction: Vinyl siding; Block foundation
- Exterior features: Gravel driveway; Rectangular, rural lot; Main thoroughfare road frontage
Interior
- Kitchen: Eat-in kitchen
- Bedrooms: Three main-level bedrooms
- Bathrooms: Two full bathrooms (both on the main level)
- Heating & cooling: Propane heating; Forced air heating
- Interior features: Eat-in kitchen; Separate formal living room; Primary bedroom with private bath; Bedroom on main level; Full basement
- Laundry & utility: Main-level laundry; Propane water heater
Neighborhood map
What this means for you Summary
Snapshot
- This is a 3-bed/1.5-bath manufactured listed at $85k.
Deal economics
- At list price, monthly cash flow is $207 ($2k/yr) — positive.
- The deal already cash-flows at list — no discount required.
- Meets the 1% rule at list price ($1k rent vs $85k).
Location & tenants
- Location reads 59/100 on livability (#1,019 in NY) — a working-class tenant base; expect higher turnover. Strengths: cost of living A+, housing A+; Watch: employment C-, health & safety C-, schools F.
- Adirondack Central School District (rural): math 41% / reading 54% proficiency, ranked #426 of 590 in NY (top 72%) — families likely to look elsewhere, expect single-tenant / working-renter base with shorter leases.
- Market conditions: 5 active listings in the ZIP; 110 units permitted in Lewis County in 2024 (0 in 5+ unit buildings).
Forward outlook
- In year one you build about $2k of equity ($588 loan paydown + $1k appreciation (1.5% local appreciation)).
- Lewis County population projected at -20% by 2050 — secular population decline; favor cash flow + early exit over multi-decade hold.
- At projected returns (1.5% appreciation + 3.0% rent growth), your $24k cash investment doubles in ~5 years — after that, you're playing with house money.
Negotiation context
- Only 6 days on market — expect competitive offers; lowballing is unlikely to land.
- 2 sale attempts since 15y ago with the ask held roughly flat each time — persistent listings suggest the price (not the market) is what's stuck; bring a comps-based counter.
Risks & watch-outs
- Watch-outs: property tax is 4.1% of price.
Questions for the listing agent
- Property tax is high relative to price — has the assessment been appealed recently, and will the sale trigger a re-assessment?
- Is there a deadline driving the sale (1031 exchange, divorce, estate, relocation)? That informs how much negotiation room exists.
- Schools are F-rated, which usually means shorter tenancies and higher turnover. Who's the typical renter profile here, and what's been the actual vacancy rate?
- Crime grade is F in this area — have there been break-ins, vandalism, or insurance claims at this property in the last 3 years? What carrier currently insures it and at what premium?
- What's the average days-on-market for RENTAL listings here right now (not sales)? A rising rental-DOM trend means longer vacancies and softer asking-rent achievability than the comps imply.
- What's the recent tenant-quality profile in this submarket — average credit score on applications, eviction rate, late-payment / NSF rate, and stable-employment percentage? A property-management company in the area should have these aggregated.
- How much new for-sale + rental construction is in the pipeline within 1–3 miles? Heavy new supply typically softens prices + rents 12–24 months out; constrained supply supports both.
Investment metrics
- 1% rule
- 1.46% ✓
- Cap rate
- 9.22%
- Cash-on-cash
- 10.44%
- DSCR
- 1.46
- GRM
- 5.7
CMA / ARV
No comps found within radius.
Projected returns pro-forma
1.48% appreciation · 3.0% rent growth · sell at horizon
- IRR
- 13.6%
- Equity multiple
- 1.71×
- Total profit
- $16,910
- Equity at exit
- $31,140
- IRR
- 16.7%
- Equity multiple
- 3.13×
- Total profit
- $50,720
- Equity at exit
- $43,076
Cash invested: $23,800 (down + closing). Projections, not guarantees.
Landlord ↔ Tenant lean methodology
- Overall (STATE)
- 15 Strongly Tenant-Friendly
- State New York
- 15 Strongly Tenant-Friendly · D+10
- County
- — inherits STATE
- City
- — inherits STATE
ZIP-level market 13489
- Home prices YoY
- 0.5%
- Active inventory
- 5
- Price-to-rent
- 5.7×
Monthly cashflow live
- Estimated rent
- $1,241 medium interval (Pro) →
- Mortgage (P&I)
- −$446
- Tax from tax record
- −$292 /mo · $3,501/yr
- Insurance
- −$35
- HOA
- −$0
- Vacancy / Maint / Mgmt
- −$261
- Net cashflow
- $207
Break-even live
UW: 25.0% down · 7.5% · 30yr · 1.5% tax · 5.0% vac · 8.0% maint · 8.0% mgmt
Financing live
Cash to close
- Down payment
- $21,250
- Closing costs
- $2,550
- Reserves months
- —
- Total cash needed
- —
Loan-product check · same deal, 3 products live
Conventional
25% down · 7.5% · 30yr
- Down + closing
- —
- Monthly P&I
- —
- Monthly cashflow
- —
- DSCR
- —
- Eligible?
- —
Personal DTI + credit; lowest rate.
DSCR
20% down · 8.5% · 30yr
- Down + closing
- —
- Monthly P&I
- —
- Monthly cashflow
- —
- DSCR
- —
- Eligible?
- —
No personal income docs; deal must DSCR.
Hard money
10% down · 12.0% · 12mo
- Down + closing
- —
- Monthly P&I
- —
- Monthly cashflow
- —
- DSCR
- —
- Eligible?
- —
Short-term bridge; refi at stabilization.
Listing history 7 events
-
2026-06-18days on market $85,000 Active 6 DOM
-
2026-06-17days on market $85,000 Active 5 DOM
-
2026-06-17remarks 699-char remark
-
2026-06-16days on market $85,000 Active 4 DOM
-
2026-06-15days on market $85,000 Active 3 DOM
-
2026-06-12remarks 566-char remark
-
2026-06-12$85,000 Active 1 DOM
ⓘ Source: listings_history table (triggers on properties + properties_extension) + one-shot
backfill from property_details.listing_events for pre-trigger history.
Tax reassessment forecast NY · Partial reset (capped growth)
- Current annual tax
- $3,501 · $292/mo
- Projected year-2 tax
- $3,501 · $292/mo
- Expected delta
- $0/yr ($0/mo · 0.0%)
ⓘ Screening estimate from a state-policy table — verify with the county assessor before closing.
Climate risk First Street
- Flood 1/10 Low FEMA zone X · 0% chance over 30 yrs
- Wildfire 3/10 Moderate
- Heat 1/10 Low 7 d/yr ≥89°F today · 16 d/yr by 30 yrs out
- Wind 1/10 Low
- Air quality 2/10 Low 0 unhealthy d/yr today · 1 by 30 yrs out
Nearby sold comps map
Loading sold comps map…
Walkable amenities ~0.75 mi
Loading nearby amenities…
Taxation est. · year 1
- Rental income
- $14,886
- − Mortgage interest
- −$4,761
- − Property taxes
- −$3,501
- − Insurance
- −$425
- − Repairs & maintenance
- −$1,191
- − Management
- −$1,191
- − Depreciation
- −$2,473
- Taxable income
- $1,345
- Est. tax owed @ 24.0%
- −$323
- After-tax cash flow
- $2,163/yr
For passive investors: Depreciation is non-cash, so a rental often shows a tax loss while cash-flowing — sheltering income. Rental losses are passive: they offset passive income freely, and up to $25,000/yr can offset ordinary (W-2) income if you actively participate and your MAGI is under $100k (phasing out to $0 by $150k); unused losses carry forward. On sale, claimed depreciation is recaptured at up to 25%, and gains may owe capital-gains tax (a 1031 exchange can defer both). Figures are a year-1 estimate at your 24.0% rate — not tax advice; consult a CPA.
Schools (NCES district)
- District
- Adirondack Central School District
- NCES district ID
- 3605040
- Math proficiency
- 41% ▼ -5.00%
- Reading proficiency
- 54% ▲ 5.00%
- Median HH income
- $50,343
- Composite
- 40.7/100
- National rank
- #3669
- State rank
- #426 of 590 in NY
Livability — Constableville
- Score
- 59/100
- State rank
- #1019
- US rank
- #19911
Category grades
Schools grade is shown separately in the Schools card above.
Census & demographics
- Population (ZIP)
- 508
Population outlook (Lewis County) Hauer SSP2
- Today (2025)
- 26,126 people
- By 2030
- 25,354 · -3.0%
- By 2040
- 23,359 · -10.6%
- By 2050
- 20,927 · -19.9%
- By 2075
- 15,533 · -40.5%
- By 2100
- 10,215 · -60.9%
Race, ethnicity, and origin ACS 2023
- Neighborhood character
- Predominantly White (97%)
- Race & ethnicity
- White 97% Two or more races 2% Asian 1%
- Common ancestry
- Lithuanian 11% Polish 5% Romanian 5%
- Foreign-born
- 2% · South Korea, Canada, Dominican Republic
- Languages at home
- 93% English-only · German/W. Germanic 5% Spanish 1% Korean 1%
Political lean MEDSL · Lewis
- 2024 margin
- Solid R (+44.4) · D 27.8% · R 72.2%
- 2008→2024 swing
- -35.6pp toward R · 2008: -8.8pp · 2024: -44.4pp
- All cycles
- 2024: R+44.4 2020: R+39.2 2016: R+39.6 2012: R+8.7 2008: R+8.8
Not yet ingested
- Civics
- —
Market trends
- HPI YoY
- ▲ 1.48%
- Current HPI
- 297.4861
- Rent YoY
- —
- Metro
- —
- State GDP YoY
- ▲ 2.60%
- F500 in state
- 92
Industry mix (Fortune 500 HQ in NY)
| Industry | F500 HQs | Revenue |
|---|---|---|
| Financial Services | 10 | $950B |
|
||
| Consumer Goods | 9 | $162B |
|
||
| Insurance | 4 | $225B |
|
||
| Telecommunications | 2 | $144B |
|
||
| Pharmaceuticals | 2 | $112B |
|
||
| Media / Entertainment | 2 | $69B |
|
||
Price history
+962.5% since first listed6 events — show timeline
- 2026-06-11 Listed $85,000 CNYIS
- 2011-12-13 Sold (Public Records) $79,500 Public Records
- 2011-12-09 Sold (MLS) $75,000 CNYIS
- 2011-04-02 Listed $94,500 CNYIS
- 2008-06-24 Sold (Public Records) $80,000 Public Records
- 1994-09-23 Sold (Public Records) $8,000 Public Records
Property tax history
+5.7%/yrLatest (2025): $3,501 · -4.3% YoY. Source: county tax records.
Cash-flow waterfall
monthlySold comps — $/sqft
last 12 mo · ≤1 miLoading sold comps…