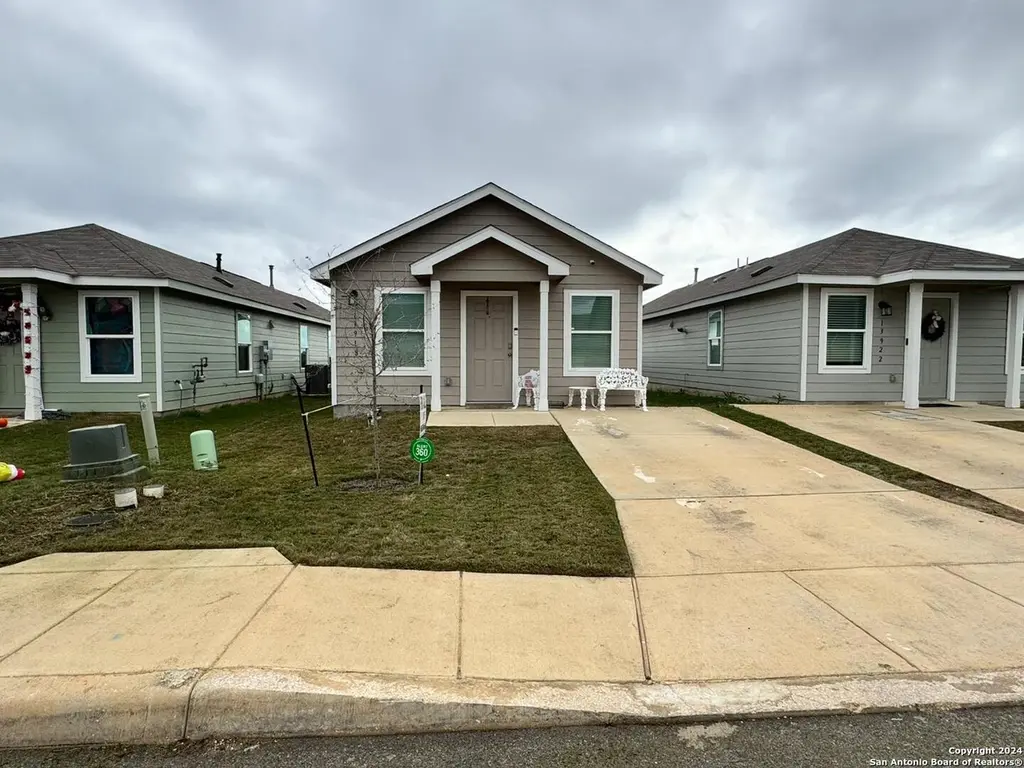
13918 Llama Pl · San Antonio, TX
Flood risk 1/10 · Minimal
- FEMA flood zone
- X (unshaded)
- Chance of flooding over 30 yrs
- 0.0%
- Est. flood insurance / yr
- $507 – $1,088
Fire risk 5/10 · Moderate
- Est. fire insurance / yr
- $1,222 – $2,270
Heat risk 8/10 · Major
- Hot days now (above 109°F)
- 7 days/yr
- Hot days in 30 yrs
- 22 days/yr
Wind risk 8/10 · Major
- Chance of severe wind over 30 yrs
- 80.0%
Air-quality risk 2/10 · Minimal
- Unhealthy air days now
- 0 days/yr
- Unhealthy air days in 30 yrs
- 1 days/yr
Risk factors via First Street. Map © Google.
Why this score? — see what drove the D+ grade
The composite is a weighted blend of 9 inputs, each scored 0–100. Each bar is that input's sub-score; the figure is the points it added to the 100-point composite (weight × sub-score).
- Cash flow +13.2/30.0
- ARV discount +9.6/15.0
- Appreciation +5.0/10.0
- Schools +4.4/10.0
- DSCR +4.0/10.0
- Livability +4.0/5.0
- Condition / age +4.0/5.0
- 1% rule +3.2/10.0
- Rent growth +2.1/5.0
$178,000
🖨 Deal sheet 📄 Offer letter ✓ Due diligence
Listing remarks
2 bedroom and 2 bath home built in 2022.
Key facts
- 3,136 sq ft lot
- Garage
- Community pool
Property features AI
Finance
- HOA & community: Mandatory HOA; Community pool and clubhouse; HOA fee $725 annually; Association transfer fee $150
Exterior
- Parking: 1-car garage, side entry
- Security: Pre-wired for security
- Utilities: City water
- Home design: Pre-owned home; Approximate age: 4 years
- Construction: Slab foundation; Composition roof; Built by Lennar
- Exterior features: Siding exterior
Interior
- Kitchen: Gas cooking; Stove/Range; Refrigerator; Disposal
- Bedrooms: Master bedroom with walk-in closet and full bath; Bedroom 2
- Flooring: Laminate flooring
- Bathrooms: 2 full bathrooms; Master bath with tub/shower combination and single vanity
- Heating & cooling: Central heating (electric); Central air conditioning
- Interior features: Ceiling fans; Pre-wired for security; Smoke alarm; Electric water heater; Living/Dining room combination; Open floor plan; Utility room inside; Ground level / no steps; Some window coverings remain
- Laundry & utility: Washer connection; Dryer connection
Neighborhood map
What this means for you Summary
Snapshot
- This is a 2-bed/1.0-bath single-family listed at $178k. Condition is rated good.
Deal economics
- At list price, monthly cash flow is $-5 ($-54/yr) — negative.
- To cash-flow at today's rent, offer at most $177k (0.4% below list).
- To meet the 1% rule (rent ≥ 1% of price), the offer needs to be $146k (17.7% below list).
- Recommended offer: $146k (17.7% below list) — sets the bar for 1% rule.
- Cap rate 6.3% vs local median 3.8% in San Antonio — top-decile yield for the area; either an underpriced asset or a hidden risk that comps aren't pricing in. Stress-test before assuming the spread holds.
Location & tenants
- Location reads 80/100 on livability (#31 in TX, #1,616 nationally) — a professional / high-income tenant draw. Strengths: amenities A+, commute A+, cost of living A+; Watch: crime F.
- Medina Valley ISD (rural): math 48% / reading 53% proficiency, ranked #148 of 826 in TX (top 18%) — acceptable for families but not a draw, mixed tenant base, ~2y average lease.
- Zoned schools: Lacoste El (math 38% / reading 42%, grade F, #1,514 of 4,322 statewide, top 36%, 744 students, 69% FRL); Medina Valley H S (math 34% / reading 55%, grade F, #652 of 1,632 statewide, top 43%, 2,147 students, 51% FRL).
- Market conditions: Rents soft (-1.7%/yr); 537 active listings in the ZIP; 3 comparable units currently listed for rent nearby; rentals leasing fast (median 3d on market — plan ~1-2 weeks tenant-placement turnaround); solid renter incomes; 8,308 units permitted in Bexar County in 2024 (2,506 in 5+ unit buildings).
Forward outlook
- In year one you build about $1k of equity ($1k loan paydown + $-3 appreciation (-0.0% local appreciation)).
- Bexar County population projected at +50% by 2050 — long-run rental-demand tailwind backs the buy-and-hold thesis.
Negotiation context
- It's been on market 38 days — a 3% lower offer ($173k) is reasonable based on typical stale-listing flexibility.
- 5 sale attempts since 2y ago with the ask held roughly flat each time — persistent listings suggest the price (not the market) is what's stuck; bring a comps-based counter.
Risks & watch-outs
- Climate carrying-cost: severe wind risk, 80% chance of damaging wind over 30y; moderate wildfire risk; extreme-heat days projected 7→22/yr by 2055 (HVAC capex compounding) — expect insurance premiums to compound above CPI over the hold.
Questions for the listing agent
- What do current leases actually rent for vs. the listed asking? Can we see a recent rent roll and the last 12 months of T-12 income?
- It's been on market 38 days. Have you received any prior offers? Is the seller open to a 18% concession, seller financing, or rate buy-down credit?
- What does the HOA fee cover, when was the last increase, and are there any pending special assessments or reserve-fund shortfalls?
- Is there a deadline driving the sale (1031 exchange, divorce, estate, relocation)? That informs how much negotiation room exists.
- Crime grade is F in this area — have there been break-ins, vandalism, or insurance claims at this property in the last 3 years? What carrier currently insures it and at what premium?
- The area grade is low — what's the realistic commute time and amenity access for the typical tenant pool here? Any planned neighborhood developments (good or bad) we should know about?
- What's the average days-on-market for RENTAL listings here right now (not sales)? A rising rental-DOM trend means longer vacancies and softer asking-rent achievability than the comps imply.
- What's the recent tenant-quality profile in this submarket — average credit score on applications, eviction rate, late-payment / NSF rate, and stable-employment percentage? A property-management company in the area should have these aggregated.
- How much new for-sale + rental construction is in the pipeline within 1–3 miles? Heavy new supply typically softens prices + rents 12–24 months out; constrained supply supports both.
Investment metrics
- 1% rule
- 0.82% ✗
- Cap rate
- 6.26%
- Cash-on-cash
- -0.11%
- DSCR
- 1.00
- GRM
- 10.1
CMA / ARV
- ARV (median comp)
- $186,751
- List price
- $178,000
- Delta
- -4.69%
- Verdict
- FAIR
- Comps
- 9 within 1.0 mi
Show comp detail 1 sale within ~0.75 mi
| Address | Dist | Beds/Ba | Sqft | Sold | Price | $/sf | Match |
|---|---|---|---|---|---|---|---|
| 13614 Livestock Ct | 0.37mi | 2/2.0 | 741 (0%) | 9mo | $175,000 | $236 | 71 |
Match score weights: distance 35% · size 25% · config 20% · recency 20%. Top-matched comps best support the ARV.
Projected returns pro-forma
-0.0% appreciation · 0.0% rent growth · sell at horizon
- IRR
- -4.3%
- Equity multiple
- 0.80×
- Total profit
- $-9,822
- Equity at exit
- $51,670
- IRR
- -0.5%
- Equity multiple
- 0.95×
- Total profit
- $-2,260
- Equity at exit
- $62,097
Cash invested: $49,840 (down + closing). Projections, not guarantees.
Landlord ↔ Tenant lean methodology
- Overall (STATE)
- 87 Strongly Landlord-Friendly
- State Texas
- 87 Strongly Landlord-Friendly · R+5
- County
- — inherits STATE
- City
- — inherits STATE
ZIP-level market 78252
- Home prices YoY
- -0.0%
- Rents YoY
- -1.7%
- Active inventory
- 537
- Price-to-rent
- 10.1×
Monthly cashflow live
- Estimated rent
- $1,465 medium interval (Pro) →
- Mortgage (P&I)
- −$933
- Tax from tax record
- −$94 /mo · $1,130/yr
- Insurance
- −$74
- HOA
- −$60
- Vacancy / Maint / Mgmt
- −$308
- Net cashflow
- $-5
Break-even live
UW: 25.0% down · 7.5% · 30yr · 1.5% tax · 5.0% vac · 8.0% maint · 8.0% mgmt
Financing live
Cash to close
- Down payment
- $44,500
- Closing costs
- $5,340
- Reserves months
- —
- Total cash needed
- —
Loan-product check · same deal, 3 products live
Conventional
25% down · 7.5% · 30yr
- Down + closing
- —
- Monthly P&I
- —
- Monthly cashflow
- —
- DSCR
- —
- Eligible?
- —
Personal DTI + credit; lowest rate.
DSCR
20% down · 8.5% · 30yr
- Down + closing
- —
- Monthly P&I
- —
- Monthly cashflow
- —
- DSCR
- —
- Eligible?
- —
No personal income docs; deal must DSCR.
Hard money
10% down · 12.0% · 12mo
- Down + closing
- —
- Monthly P&I
- —
- Monthly cashflow
- —
- DSCR
- —
- Eligible?
- —
Short-term bridge; refi at stabilization.
Rent comps 3 comps
| Address | Beds | Baths | Sqft | Rent | $/sqft | DOM | Units | Dist |
|---|---|---|---|---|---|---|---|---|
| 13918 Llama Pl San Antonio, TX | 2.0 | 2.0 | 741 | $1,500 | $2.02 | 43d | 1 | 0.02mi |
| 13850 Llama Pl San Antonio, TX | 2.0 | 2.0 | 741 | $1,250 | $1.69 | 2d | 1 | 0.08mi |
| 6304 Masterson Rd Unit 1294 San Antonio, TX | 1.0 | 1.0 | 724 | $1,356 | $1.87 | 3d | 1 | 1.08mi |
HOA detail
- Monthly dues
- $60 · $720/yr
Listing history 24 events
-
2026-06-18days on market $178,000 Active 38 DOM
-
2026-06-17days on market $178,000 Active 37 DOM
-
2026-06-16days on market $178,000 Active 36 DOM
-
2026-06-15days on market $178,000 Active 35 DOM
-
2026-06-13days on market $178,000 Active 33 DOM
-
2026-06-09days on market $178,000 Active 29 DOM
-
2026-06-08days on market $178,000 Active 28 DOM
-
2026-06-07days on market $178,000 Active 27 DOM
-
2026-06-04days on market $178,000 Active 24 DOM
-
2026-06-03days on market $178,000 Active 23 DOM
-
2026-06-02days on market $178,000 Active 22 DOM
-
2026-06-01days on market $178,000 Active 21 DOM
-
2026-05-31days on market $178,000 Active 20 DOM
-
2026-05-11$178,000 New 40-char remark
-
2026-04-23$1,500
-
2025-04-29historical
-
2025-04-25historical $1,400
-
2025-04-25historical
-
2025-04-17price $1,400
-
2025-04-17price $178,000
-
2025-03-13$1,600
-
2025-02-22price $180,000
-
2024-12-19$189,000 New
-
2024-12-19$189,000 Active
ⓘ Source: listings_history table (triggers on properties + properties_extension) + one-shot
backfill from property_details.listing_events for pre-trigger history.
Tax reassessment forecast TX · Resets to sale price
- Current annual tax
- $1,130 · $94/mo
- Projected year-2 tax
- $3,257 · $271/mo
- Expected delta
- +$2,128/yr (+$177/mo · 188.4%)
ⓘ Screening estimate from a state-policy table — verify with the county assessor before closing.
Climate risk First Street
- Flood 1/10 Low FEMA zone X (unshaded) · 0% chance over 30 yrs
- Wildfire 5/10 Major
- Heat 8/10 Severe 7 d/yr ≥109°F today · 22 d/yr by 30 yrs out
- Wind 8/10 Severe 80% chance of damaging wind over 30 yrs
- Air quality 2/10 Low 0 unhealthy d/yr today · 1 by 30 yrs out
Nearby sold comps map
Loading sold comps map…
Walkable amenities ~0.75 mi
Loading nearby amenities…
Taxation est. · year 1
- Rental income
- $17,578
- − Mortgage interest
- −$9,971
- − Property taxes
- −$1,130
- − Insurance
- −$890
- − Repairs & maintenance
- −$1,406
- − Management
- −$1,406
- − HOA
- −$720
- − Depreciation
- −$5,178
- Taxable loss
- −$3,123
- Est. tax savings @ 24.0%
- +$749
- After-tax cash flow
- $695/yr
For passive investors: Depreciation is non-cash, so a rental often shows a tax loss while cash-flowing — sheltering income. Rental losses are passive: they offset passive income freely, and up to $25,000/yr can offset ordinary (W-2) income if you actively participate and your MAGI is under $100k (phasing out to $0 by $150k); unused losses carry forward. On sale, claimed depreciation is recaptured at up to 25%, and gains may owe capital-gains tax (a 1031 exchange can defer both). Figures are a year-1 estimate at your 24.0% rate — not tax advice; consult a CPA.
Condition & rehab AI · 12 photos
This 2022-built home is in excellent condition with modern finishes and a move-in-ready exterior. Minor touch-ups and cleaning would further enhance its curb appeal and value.
Value-add opportunities
- Both Paint exterior trim — Enhances curb appeal and value
- Both Clean gutters — Improves drainage and property value
Renovation cost estimate screening
Value-add ROI direction
- Both Paint exterior trim — Enhances curb appeal and value ↑
- Both Clean gutters — Improves drainage and property value ↑
ⓘ Cost ranges are severity-bucket heuristics (US national rule-of-thumb). Get contractor quotes + a written scope before underwriting a rehab budget.
Schools (NCES district)
- District
- Medina Valley ISD
- NCES district ID
- 4830060
- Math proficiency
- 48% ▼ -9.00%
- Reading proficiency
- 53% ▼ -2.00%
- Median HH income
- $60,596
- Composite
- 44.2/100
- National rank
- #2851
- State rank
- #148 of 826 in TX
Livability — San Antonio
- Score
- 80/100
- State rank
- #31
- US rank
- #1616
Category grades
Schools grade is shown separately in the Schools card above.
Census & demographics
- County
- Bexar County · 1,990,555 people
- City population
- 1,806,925
- Metro
- San Antonio-New Braunfels, TX
- Population (ZIP)
- 21,790
- Household income
- $85,518
- Rent vs Own
- Severe rent burden
- 152.0
Population outlook (Bexar County) Hauer SSP2
- Today (2025)
- 2,336,851 people
- By 2030
- 2,560,728 · +9.6%
- By 2040
- 3,020,569 · +29.3%
- By 2050
- 3,493,522 · +49.5%
- By 2075
- 4,668,459 · +99.8%
- By 2100
- 5,533,242 · +136.8%
Race, ethnicity, and origin ACS 2023
- Neighborhood character
- Predominantly Hispanic (68%)
- Race & ethnicity
- Hispanic / Latino 68% Two or more races 29% White 17% Black 8% Asian 3% Native American 1%
- Hispanic origin (detail)
- Mexican 61% Puerto Rican 1%
- Common ancestry
- Hispanic 2% Lithuanian 1% German 1%
- Foreign-born
- 12% · Canada, South Korea
- Languages at home
- 58% English-only · Spanish 38% Tagalog/Filipino 2% Other Indo-European 1%
Political lean MEDSL · Bexar
- 2024 margin
- Lean D (+9.8) · D 54.3% · R 44.6% · Other 1.1%
- 2008→2024 swing
- +4.2pp toward D · 2008: 5.6pp · 2024: 9.8pp
- All cycles
- 2024: D+9.8 2020: D+18.2 2016: D+13.5 2012: D+4.6 2008: D+5.6
Not yet ingested
- Civics
- —
Market trends
- HPI YoY
- ▬ -0.00%
- Current HPI
- 183.6413
- Rent YoY
- ▼ -1.67%
- Metro
- San Antonio-New Braunfels, TX
- State GDP YoY
- ▲ 3.95%
- F500 in state
- 110
Industry mix (Fortune 500 HQ in TX)
| Industry | F500 HQs | Revenue |
|---|---|---|
| Energy | 16 | $1,198B |
|
||
| Technology | 5 | $198B |
|
||
| Engineering / Construction | 4 | $72B |
|
||
| Energy Services | 3 | $60B |
|
||
| Utilities | 3 | $41B |
|
||
| Healthcare | 2 | $330B |
|
||
Price history
-5.8% since first listed11 events — show timeline
- 2026-05-11 Listed $178,000 LERA
- 2026-04-23 Listed for Rent $1,500 SABOR
- 2025-04-29 Listing Removed — CTXMLS
- 2025-04-25 Rental Removed $1,400 SABOR
- 2025-04-25 Listing Removed — LERA
- 2025-04-17 Price Changed $1,400 SABOR
- 2025-04-17 Price Changed $178,000 LERA
- 2025-03-13 Listed for Rent $1,600 SABOR
- 2025-02-22 Price Changed $180,000 LERA
- 2024-12-19 Listed $189,000 LERA
- 2024-12-19 Listed $189,000 CTXMLS
Property tax history
+12.6%/yrLatest (2025): $1,130 · -60.4% YoY. Source: county tax records.
Cash-flow waterfall
monthlySold comps — $/sqft
last 12 mo · ≤1 miLoading sold comps…