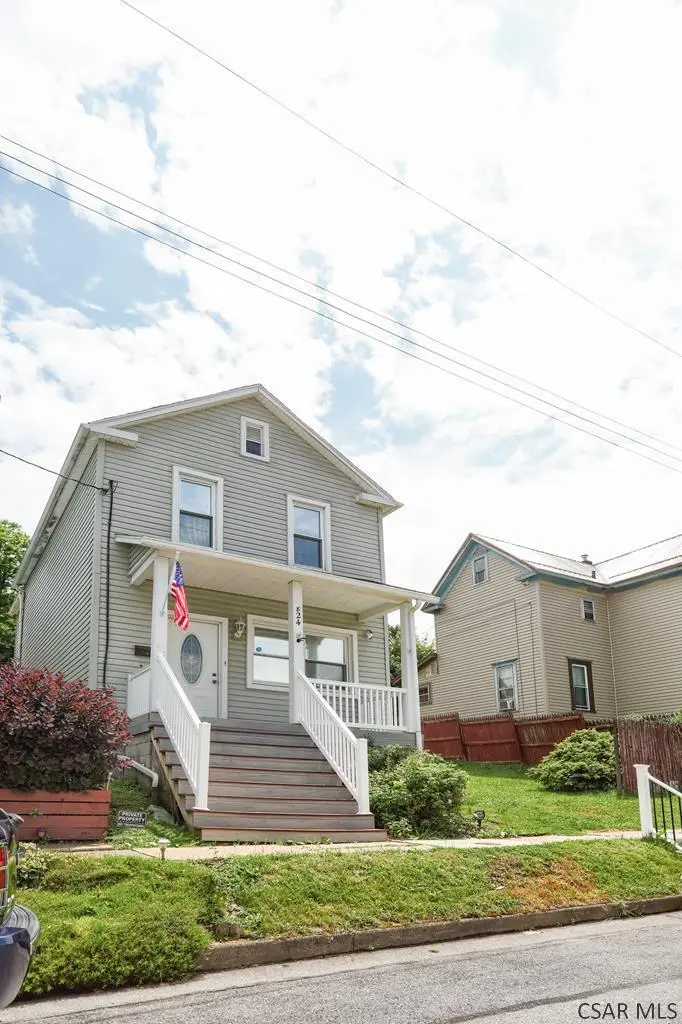
824 Central Ave · Johnstown, PA
Flood risk 1/10 · Minimal
- FEMA flood zone
- X (unshaded)
- Chance of flooding over 30 yrs
- 0.0%
- Est. flood insurance / yr
- $473 – $860
Fire risk 1/10 · Minimal
- Est. fire insurance / yr
- $511 – $949
Heat risk 4/10 · Minor
- Hot days now (above 93°F)
- 7 days/yr
- Hot days in 30 yrs
- 18 days/yr
Wind risk 2/10 · Minimal
- Chance of severe wind over 30 yrs
- —
Air-quality risk 2/10 · Minimal
- Unhealthy air days now
- 1 days/yr
- Unhealthy air days in 30 yrs
- 2 days/yr
Risk factors via First Street. Map © Google.
Why this score? — see what drove the C+ grade
The composite is a weighted blend of 9 inputs, each scored 0–100. Each bar is that input's sub-score; the figure is the points it added to the 100-point composite (weight × sub-score).
- Cash flow +29.4/30.0
- DSCR +10.0/10.0
- 1% rule +7.9/10.0
- ARV discount +7.5/15.0
- Livability +3.9/5.0
- Rent growth +2.5/5.0
- Condition / age +2.5/5.0
- Schools +1.3/10.0
- Appreciation +0.0/10.0
$76,900
🖨 Deal sheet 📄 Offer letter ✓ Due diligence
Listing remarks MLS
Updated 2 story home with a remodeled kitchen, with white cabinets and new counter top, a separate dining room and spacious living room. The 2nd floor has 3 bedrooms with spacious closets and a updated bath. Vinyl sided with fresh landscaping. Clean and updated!! Johnstown Schools.
Key facts
- 4,792 sq ft lot
- Listed 7 days
Property features AI
Exterior
- Parking: On-street parking
- Utilities: Public water; Public sewer; Cable available
- Home design: Single family residence; Residential property; Two levels / 2 stories
- Construction: Vinyl siding; Shingle roof
- Exterior features: Rectangular lot; Public maintained road frontage on a city street
Interior
- Kitchen: Range; Oven; Refrigerator; Eat-in kitchen
- Flooring: Carpet; Ceramic tile; Laminate; Wood
- Bathrooms: 1 full bathroom
- Heating & cooling: Baseboard heating; Natural gas heating; Ceiling fan(s)
- Interior features: Eat-in kitchen; Full unfinished basement
- Laundry & utility: Washer; Dryer
Neighborhood map
What this means for you Summary
Snapshot
- This is a 3-bed/1.0-bath single-family listed at $77k.
Deal economics
- At list price, monthly cash flow is $273 ($3k/yr) — positive.
- The deal already cash-flows at list — no discount required.
- Meets the 1% rule at list price ($991 rent vs $77k).
- Cap rate 10.6% vs local median 15.0% in Johnstown — below-typical yield; the buyer is paying a premium for something (appreciation thesis, condition, location) that the cap rate doesn't capture.
Location & tenants
- Location reads 77/100 on livability (#363 in PA, #3,168 nationally) — a middle-class / working-renter tenant base. Strengths: amenities A+, commute A+, cost of living A+; Watch: schools D+, crime F, employment F.
- Greater Johnstown SD (urban): math 9% / reading 25% proficiency, ranked #509 of 539 in PA (top 94%) — low school quality limits family demand, transient renter base, plan for 1-2y turnover; 80% free/reduced lunch — lower-income household profile, screen leases tightly.
- Market conditions: 64 active listings in the ZIP; 7 comparable units currently listed for rent nearby; rentals lingering (median 44d on market — plan ~5-8 weeks vacancy on turnover, expect pricing pressure); 100% of comp listings sitting > 30 days — soft ceiling on asking rent; lower-income renter base — watch delinquency; 64 units permitted in Cambria County in 2024 (0 in 5+ unit buildings).
Forward outlook
- Local home prices are declining (-3.0%/yr); year-one equity from $532 of loan paydown is wiped out by about $2k of value loss. Plan a longer hold.
- Cambria County population projected at -28% by 2050 — secular population decline; favor cash flow + early exit over multi-decade hold.
- At projected returns (-3.0% appreciation + 3.0% rent growth), your $22k cash investment doubles in ~8 years — after that, you're playing with house money.
Negotiation context
- Only 7 days on market — expect competitive offers; lowballing is unlikely to land.
- 6 sale attempts since 20y ago with the ask held roughly flat each time — persistent listings suggest the price (not the market) is what's stuck; bring a comps-based counter.
Questions for the listing agent
- Is there a deadline driving the sale (1031 exchange, divorce, estate, relocation)? That informs how much negotiation room exists.
- Schools are D-rated, which usually means shorter tenancies and higher turnover. Who's the typical renter profile here, and what's been the actual vacancy rate?
- Crime grade is F in this area — have there been break-ins, vandalism, or insurance claims at this property in the last 3 years? What carrier currently insures it and at what premium?
- What's the average days-on-market for RENTAL listings here right now (not sales)? A rising rental-DOM trend means longer vacancies and softer asking-rent achievability than the comps imply.
- What's the recent tenant-quality profile in this submarket — average credit score on applications, eviction rate, late-payment / NSF rate, and stable-employment percentage? A property-management company in the area should have these aggregated.
- How much new for-sale + rental construction is in the pipeline within 1–3 miles? Heavy new supply typically softens prices + rents 12–24 months out; constrained supply supports both.
Investment metrics
- 1% rule
- 1.29% ✓
- Cap rate
- 10.56%
- Cash-on-cash
- 15.22%
- DSCR
- 1.68
- GRM
- 6.5
CMA / ARV
- ARV (on-the-fly)
- $50,320
- Comps found
- 12
Show comp detail 12 sales within ~0.75 mi
| Address | Dist | Beds/Ba | Sqft | Sold | Price | $/sf | Match |
|---|---|---|---|---|---|---|---|
| 1492 Franklin St | 0.33mi | 3/1.0 | 1,248 (-1%) | 1mo | $47,000 | $38 | 82 |
| 751 Park Ave | 0.13mi | 3/1.5 | 1,388 (+10%) | 3mo | $43,500 | $31 | 72 |
| 652 Russell Ave | 0.48mi | 3/1.0 | 1,312 (+4%) | 0mo | $70,000 | $53 | 70 |
| 545 Summit Ave | 0.40mi | 3/1.0 | 1,187 (-6%) | 3mo | $89,000 | $75 | 69 |
| 394 Plainfield Ave | 0.25mi | 2/1.0 (-1) | 1,150 (-9%) | 2mo | $27,900 | $24 | 67 |
| 627 Vickroy Ave | 0.34mi | 2/1.5 (-1) | 1,188 (-6%) | 3mo | $125,000 | $105 | 66 |
| 551 Russell Ave | 0.55mi | 2/1.0 (-1) | 1,308 (+4%) | 1mo | $52,500 | $40 | 62 |
| 100 Donna Dr | 0.54mi | 4/2.0 (+1) | 1,312 (+4%) | 1mo | $115,000 | $88 | 58 |
| 525 Woodland Ave | 0.68mi | 3/1.0 | 1,324 (+5%) | 6mo | $15,500 | $12 | 55 |
| 654 Park Ave | 0.26mi | 4/2.0 (+1) | 1,446 (+15%) | 4mo | $57,500 | $40 | 51 |
| 714 Glenwood Ave | 0.52mi | 3/1.5 | 1,432 (+14%) | 1mo | $113,420 | $79 | 49 |
| 209 Village St | 0.42mi | 3/2.0 | 1,441 (+14%) | 6mo | $17,900 | $12 | 47 |
Match score weights: distance 35% · size 25% · config 20% · recency 20%. Top-matched comps best support the ARV.
Projected returns pro-forma
-3.0% appreciation · 3.0% rent growth · sell at horizon
- IRR
- 5.9%
- Equity multiple
- 1.23×
- Total profit
- $4,938
- Equity at exit
- $11,466
- IRR
- 15.3%
- Equity multiple
- 2.24×
- Total profit
- $26,708
- Equity at exit
- $6,649
Cash invested: $21,532 (down + closing). Projections, not guarantees.
Landlord ↔ Tenant lean methodology
- Overall (STATE)
- 62 Landlord-Friendly
- State Pennsylvania
- 62 Landlord-Friendly · EVEN
- County
- — inherits STATE
- City
- — inherits STATE
ZIP-level market 15902
- Home prices YoY
- -28.8%
- Active inventory
- 64
- Price-to-rent
- 6.5×
Monthly cashflow live
- Estimated rent
- $991 high interval (Pro) →
- Mortgage (P&I)
- −$403
- Tax from tax record
- −$75 /mo · $898/yr
- Insurance
- −$32
- HOA
- −$0
- Vacancy / Maint / Mgmt
- −$208
- Net cashflow
- $273
Break-even live
UW: 25.0% down · 7.5% · 30yr · 1.5% tax · 5.0% vac · 8.0% maint · 8.0% mgmt
Financing live
Cash to close
- Down payment
- $19,225
- Closing costs
- $2,307
- Reserves months
- —
- Total cash needed
- —
Loan-product check · same deal, 3 products live
Conventional
25% down · 7.5% · 30yr
- Down + closing
- —
- Monthly P&I
- —
- Monthly cashflow
- —
- DSCR
- —
- Eligible?
- —
Personal DTI + credit; lowest rate.
DSCR
20% down · 8.5% · 30yr
- Down + closing
- —
- Monthly P&I
- —
- Monthly cashflow
- —
- DSCR
- —
- Eligible?
- —
No personal income docs; deal must DSCR.
Hard money
10% down · 12.0% · 12mo
- Down + closing
- —
- Monthly P&I
- —
- Monthly cashflow
- —
- DSCR
- —
- Eligible?
- —
Short-term bridge; refi at stabilization.
Rent comps 7 comps
| Address | Beds | Baths | Sqft | Rent | $/sqft | DOM | Units | Dist |
|---|---|---|---|---|---|---|---|---|
| 550 Ferndale Ave Johnstown, PA | 3.0 | 1.0 | 1300 | $1,100 | $0.85 | 43d | 1 | 0.27mi |
| 522 Vickroy Ave Johnstown, PA | 3.0 | 1.0 | 1125 | $850 | $0.76 | 43d | 1 | 0.29mi |
| 553 Vickroy Ave #555 Johnstown, PA | 3.0 | 1.0 | 1300 | $985 | $0.76 | 43d | 1 | 0.30mi |
| 619 Grove Ave Johnstown, PA | 2.0 | 2.0 | 1100 | $1,050 | $0.95 | 43d | 1 | 0.35mi |
| 129-131 Plainfield Ave Johnstown, PA | 3.0 | 1.0 | 1300 | $850 | $0.65 | 43d | 1 | 0.37mi |
| 906 Lemon St Johnstown, PA | 3.0 | 1.0 | 1128 | $750 | $0.66 | 43d | 1 | 1.32mi |
| 412 Oak St Unit 1 Johnstown, PA | 2.0 | 1.0 | 1100 | $900 | $0.82 | 43d | 1 | 1.48mi |
Listing history 7 events
-
2026-06-19days on market $76,900 Active 7 DOM
-
2026-06-18days on market $76,900 Active 6 DOM
-
2026-06-17days on market $76,900 Active 5 DOM
-
2026-06-16days on market $76,900 Active 4 DOM
-
2026-06-15days on market $76,900 Active 3 DOM
-
2026-06-12remarks 618-char remark
-
2026-06-12$76,900 Active 1 DOM
ⓘ Source: listings_history table (triggers on properties + properties_extension) + one-shot
backfill from property_details.listing_events for pre-trigger history.
Tax reassessment forecast PA · Partial reset (capped growth)
- Current annual tax
- $898 · $75/mo
- Projected year-2 tax
- $1,056 · $88/mo
- Expected delta
- +$159/yr (+$13/mo · 17.7%)
ⓘ Screening estimate from a state-policy table — verify with the county assessor before closing.
Climate risk First Street
- Flood 1/10 Low FEMA zone X (unshaded) · 0% chance over 30 yrs
- Wildfire 1/10 Low
- Heat 4/10 Moderate 7 d/yr ≥93°F today · 18 d/yr by 30 yrs out
- Wind 2/10 Low
- Air quality 2/10 Low 1 unhealthy d/yr today · 2 by 30 yrs out
Nearby sold comps map
Loading sold comps map…
Walkable amenities ~0.75 mi
Loading nearby amenities…
Taxation est. · year 1
- Rental income
- $11,898
- − Mortgage interest
- −$4,308
- − Property taxes
- −$898
- − Insurance
- −$384
- − Repairs & maintenance
- −$952
- − Management
- −$952
- − Depreciation
- −$2,237
- Taxable income
- $2,167
- Est. tax owed @ 24.0%
- −$520
- After-tax cash flow
- $2,758/yr
For passive investors: Depreciation is non-cash, so a rental often shows a tax loss while cash-flowing — sheltering income. Rental losses are passive: they offset passive income freely, and up to $25,000/yr can offset ordinary (W-2) income if you actively participate and your MAGI is under $100k (phasing out to $0 by $150k); unused losses carry forward. On sale, claimed depreciation is recaptured at up to 25%, and gains may owe capital-gains tax (a 1031 exchange can defer both). Figures are a year-1 estimate at your 24.0% rate — not tax advice; consult a CPA.
Schools (NCES district)
- District
- Greater Johnstown SD
- NCES district ID
- 4210950
- Math proficiency
- 9% ▼ -6.00%
- Reading proficiency
- 25% ▼ -6.00%
- Median HH income
- $27,890
- Composite
- 13.25/100
- National rank
- #9550
- State rank
- #509 of 539 in PA
Livability — Johnstown
- Score
- 77/100
- State rank
- #363
- US rank
- #3168
Category grades
Schools grade is shown separately in the Schools card above.
Census & demographics
- Census place
- Johnstown, PA
- County
- Cambria County · 30,791 people
- City population
- 30,791
- Metro
- Johnstown, PA
- Population (ZIP)
- 11,462
- Household income
- $44,215
- Rent vs Own
- Severe rent burden
- 266.0
Population outlook (Cambria County) Hauer SSP2
- Today (2025)
- 122,754 people
- By 2030
- 115,827 · -5.6%
- By 2040
- 101,309 · -17.5%
- By 2050
- 88,379 · -28.0%
- By 2075
- 65,237 · -46.9%
- By 2100
- 46,909 · -61.8%
Race, ethnicity, and origin ACS 2023
- Neighborhood character
- Predominantly White (75%)
- Race & ethnicity
- White 75% Two or more races 14% Black 8% Hispanic / Latino 3%
- Common ancestry
- Romanian 7% Slovak 2% Hungarian 2%
- Foreign-born
- 2% · Canada
- Languages at home
- 97% English-only · Spanish 2%
Political lean MEDSL · Cambria
- 2024 margin
- Solid R (+39.7) · D 29.8% · R 69.5%
- 2008→2024 swing
- -40.4pp toward R · 2008: 0.7pp · 2024: -39.7pp
- All cycles
- 2024: R+39.7 2020: R+37.3 2016: R+37.8 2012: R+17.8 2008: D+0.7
Not yet ingested
- Civics
- —
Market trends
- HPI YoY
- ▼ -43.86%
- Current HPI
- 108.2198
- Rent YoY
- —
- Metro
- Johnstown, PA
- State GDP YoY
- ▲ 1.68%
- F500 in state
- 34
Industry mix (Fortune 500 HQ in PA)
| Industry | F500 HQs | Revenue |
|---|---|---|
| Healthcare | 2 | $309B |
|
||
| Insurance | 2 | $27B |
|
||
| Telecommunications / Media | 1 | $124B |
|
||
| Industrial Distribution | 1 | $22B |
|
||
| Financial Services | 1 | $20B |
|
||
| Chemicals / Materials | 1 | $18B |
|
||
Price history
+352.4% since first listed17 events — show timeline
- 2026-06-12 Listed $76,900 CSMLS
- 2025-06-02 Sold (Public Records) $70,000 Public Records
- 2025-05-30 Sold (MLS) $70,000 CSMLS
- 2025-04-30 Pending — CSMLS
- 2025-04-27 Listed $65,000 CSMLS
- 2020-10-02 Sold (Public Records) $34,000 Public Records
- 2020-10-02 Sold (MLS) $34,000 AHARMLS
- 2017-11-09 Listed $37,500 AHARMLS
- 2017-05-26 Sold (MLS) $6,000 AHARMLS
- 2017-05-08 Sold (Public Records) $6,000 Public Records
- 2016-12-14 Listed $12,000 AHARMLS
- 2006-09-02 Sold (MLS) $24,900 CSMLS
- 2006-08-28 Sold (Public Records) $24,900 Public Records
- 2006-07-02 Listed $24,900 CSMLS
- 2006-04-13 Sold (MLS) $7,700 CSMLS
- 2006-01-19 Listed $9,900 CSMLS
- 1995-12-01 Sold (Public Records) $17,000 Public Records
Property tax history
+0.2%/yrLatest (2026): $898 · +0.0% YoY. Source: county tax records.
Cash-flow waterfall
monthlySold comps — $/sqft
last 12 mo · ≤1 miLoading sold comps…