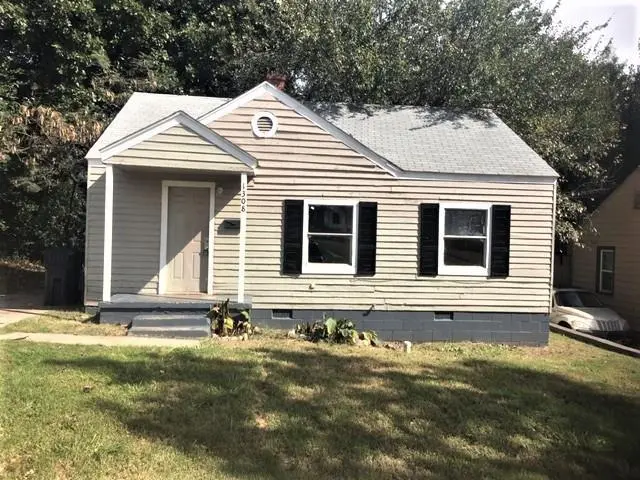
1308 Windemere Dr · Oklahoma City, OK
Flood risk 1/10 · Minimal
- FEMA flood zone
- X (unshaded)
- Chance of flooding over 30 yrs
- 0.0%
- Est. flood insurance / yr
- $507 – $1,088
Fire risk 1/10 · Minimal
- Est. fire insurance / yr
- $2,463 – $4,575
Heat risk 5/10 · Moderate
- Hot days now (above 107°F)
- 7 days/yr
- Hot days in 30 yrs
- 18 days/yr
Wind risk 3/10 · Minor
- Chance of severe wind over 30 yrs
- 4.0%
Air-quality risk 2/10 · Minimal
- Unhealthy air days now
- 1 days/yr
- Unhealthy air days in 30 yrs
- 2 days/yr
Risk factors via First Street. Map © Google.
Why this score? — see what drove the B- grade
The composite is a weighted blend of 9 inputs, each scored 0–100. Each bar is that input's sub-score; the figure is the points it added to the 100-point composite (weight × sub-score).
- Cash flow +30.0/30.0
- 1% rule +10.0/10.0
- DSCR +10.0/10.0
- Appreciation +6.2/10.0
- Livability +4.0/5.0
- Rent growth +2.5/5.0
- Condition / age +2.5/5.0
- Schools +0.7/10.0
- ARV discount +0.0/15.0
$65,000
🖨 Deal sheet 📄 Offer letter ✓ Due diligence
Listing remarks
Discover a charming single-family residence at 1308 Windemere DR, Oklahoma City OK 73117, a home built in 1940 that presents an opportunity to craft a personalized sanctuary in a vibrant city. This home offers two comfortable bedrooms, back deck area overlooking large backyard. Washer/dryer hookups! Central heat and window units needed. Schedule your private viewing today. This home has been a rental and will need some work to make it your own.
Key facts
- Back deck area
- Large backyard
- 6,373 sq ft lot
Tags
Property features AI
Finance
- Other: Located in Carverdale Subdivision; Homestead not indicated; Flood insurance not indicated
- Financial info: Loan qualification possible; Not assumable
- HOA & community: No mandatory association dues
Exterior
- Parking: No parking details provided
- Security: No security features listed
- Utilities: No specific utility details provided
- Home design: Single-family residence; One-level property; Existing property
- Construction: Brick and frame construction; Composition roof; Combination foundation; Built status: existing
- Exterior features: No notable exterior features listed; Interior lot
Interior
- Kitchen: No kitchen appliance details provided
- Bedrooms: 2 bedrooms
- Flooring: No flooring details provided
- Bathrooms: 1 full bathroom
- Heating & cooling: Electric heating; No central cooling
- Interior features: No fireplace; No in-law plan indicated
- Laundry & utility: No laundry details provided
Neighborhood map
What this means for you Summary
Snapshot
- This is a 2-bed/1.0-bath single-family listed at $65k.
Deal economics
- At list price, monthly cash flow is $375 ($5k/yr) — positive.
- The deal already cash-flows at list — no discount required.
- Meets the 1% rule at list price ($994 rent vs $65k).
- Recommended offer: $64k (1.5% below list) — sets the bar for market timing.
- Cap rate 13.2% vs local median 3.7% in Oklahoma City — top-decile yield for the area; either an underpriced asset or a hidden risk that comps aren't pricing in. Stress-test before assuming the spread holds.
Location & tenants
- Location reads 80/100 on livability (#3 in OK, #1,635 nationally) — a professional / high-income tenant draw. Strengths: amenities A+, commute A+, cost of living A+; Watch: crime F.
- Oklahoma City (urban): math 7% / reading 10% proficiency, ranked #254 of 270 in OK (top 94%) — low school quality limits family demand, transient renter base, plan for 1-2y turnover; 82% free/reduced lunch — lower-income household profile, screen leases tightly.
- Zoned schools: Douglass Hs (math 2% / reading 2%, grade F, #445 of 447 statewide, top 100%, 556 students, 0% FRL) — zoned schools average 0% FRL vs 82% district-wide (82 pts lower); this property's tenant base skews higher-income than the district average.
- Market conditions: 75 active listings in the ZIP; 8 comparable units currently listed for rent nearby; rentals lingering (median 44d on market — plan ~5-8 weeks vacancy on turnover, expect pricing pressure); 62% of comp listings sitting > 30 days — soft ceiling on asking rent; lower-income renter base — watch delinquency; 5,365 units permitted in Oklahoma County in 2024 (569 in 5+ unit buildings).
Forward outlook
- In year one you build about $2k of equity ($449 loan paydown + $2k appreciation (2.4% local appreciation)).
- Oklahoma County population projected at +41% by 2050 — long-run rental-demand tailwind backs the buy-and-hold thesis.
- At projected returns (2.4% appreciation + 3.0% rent growth), your $18k cash investment doubles in ~3 years — after that, you're playing with house money.
Negotiation context
- It's been on market 29 days — a 2% lower offer ($64k) is reasonable based on typical stale-listing flexibility.
- 6 sale attempts since 23y ago with the ask held roughly flat each time — persistent listings suggest the price (not the market) is what's stuck; bring a comps-based counter.
- Current owner paid $30k; list at $65k implies a 117% gain — meaningful room to come down on a strong offer.
Risks & watch-outs
- Watch-outs: built in 1940 — expect roof / HVAC / electrical / plumbing capex.
- Climate carrying-cost: extreme-heat days projected 7→18/yr by 2055 (HVAC capex compounding) — expect insurance premiums to compound above CPI over the hold.
Questions for the listing agent
- Built in 1940 — when were the roof, HVAC, electrical panel, plumbing, and water heater last replaced?
- Is there a deadline driving the sale (1031 exchange, divorce, estate, relocation)? That informs how much negotiation room exists.
- Schools are F-rated, which usually means shorter tenancies and higher turnover. Who's the typical renter profile here, and what's been the actual vacancy rate?
- Crime grade is F in this area — have there been break-ins, vandalism, or insurance claims at this property in the last 3 years? What carrier currently insures it and at what premium?
- What's the average days-on-market for RENTAL listings here right now (not sales)? A rising rental-DOM trend means longer vacancies and softer asking-rent achievability than the comps imply.
- What's the recent tenant-quality profile in this submarket — average credit score on applications, eviction rate, late-payment / NSF rate, and stable-employment percentage? A property-management company in the area should have these aggregated.
- How much new for-sale + rental construction is in the pipeline within 1–3 miles? Heavy new supply typically softens prices + rents 12–24 months out; constrained supply supports both.
Investment metrics
- 1% rule
- 1.53% ✓
- Cap rate
- 13.22%
- Cash-on-cash
- 24.73%
- DSCR
- 2.10
- GRM
- 5.5
CMA / ARV
- ARV (on-the-fly)
- $53,280
- Comps found
- 3
Show comp detail 3 sales within ~0.75 mi
| Address | Dist | Beds/Ba | Sqft | Sold | Price | $/sf | Match |
|---|---|---|---|---|---|---|---|
| 2108 Miramar Blvd | 0.49mi | 2/1.0 | 768 (+7%) | 3mo | $88,000 | $115 | 63 |
| 1100 NE Grand Blvd | 0.32mi | 3/1.0 (+1) | 672 (-7%) | 12mo | $50,000 | $74 | 59 |
| 2228 NE 23rd St | 0.71mi | 2/1.0 | 756 (+5%) | 5mo | $47,000 | $62 | 54 |
Match score weights: distance 35% · size 25% · config 20% · recency 20%. Top-matched comps best support the ARV.
Projected returns pro-forma
2.42% appreciation · 3.0% rent growth · sell at horizon
- IRR
- 29.7%
- Equity multiple
- 2.63×
- Total profit
- $29,726
- Equity at exit
- $27,114
- IRR
- 30.7%
- Equity multiple
- 5.11×
- Total profit
- $74,867
- Equity at exit
- $40,213
Cash invested: $18,200 (down + closing). Projections, not guarantees.
Landlord ↔ Tenant lean methodology
- Overall (STATE)
- 83 Strongly Landlord-Friendly
- State Oklahoma
- 83 Strongly Landlord-Friendly · R+20
- County
- — inherits STATE
- City
- — inherits STATE
ZIP-level market 73117
- Home prices YoY
- 1.3%
- Active inventory
- 75
- Price-to-rent
- 5.5×
Monthly cashflow live
- Estimated rent
- $994 high interval (Pro) →
- Mortgage (P&I)
- −$341
- Tax from tax record
- −$42 /mo · $504/yr
- Insurance
- −$27
- HOA
- −$0
- Vacancy / Maint / Mgmt
- −$209
- Net cashflow
- $375
Break-even live
UW: 25.0% down · 7.5% · 30yr · 1.5% tax · 5.0% vac · 8.0% maint · 8.0% mgmt
Financing live
Cash to close
- Down payment
- $16,250
- Closing costs
- $1,950
- Reserves months
- —
- Total cash needed
- —
Loan-product check · same deal, 3 products live
Conventional
25% down · 7.5% · 30yr
- Down + closing
- —
- Monthly P&I
- —
- Monthly cashflow
- —
- DSCR
- —
- Eligible?
- —
Personal DTI + credit; lowest rate.
DSCR
20% down · 8.5% · 30yr
- Down + closing
- —
- Monthly P&I
- —
- Monthly cashflow
- —
- DSCR
- —
- Eligible?
- —
No personal income docs; deal must DSCR.
Hard money
10% down · 12.0% · 12mo
- Down + closing
- —
- Monthly P&I
- —
- Monthly cashflow
- —
- DSCR
- —
- Eligible?
- —
Short-term bridge; refi at stabilization.
Rent comps 8 comps
| Address | Beds | Baths | Sqft | Rent | $/sqft | DOM | Units | Dist |
|---|---|---|---|---|---|---|---|---|
| 1801 E Park Pl Oklahoma City, OK | 2.0 | 1.0 | 734 | $695 | $0.95 | 44d | 1 | 0.62mi |
| 3049 NE 15th St Oklahoma City, OK | 2.0 | 1.0 | 660 | $895 | $1.36 | 2d | 1 | 0.71mi |
| 3333 NE 12th St Oklahoma City, OK | 2.0 | 1.0 | 720 | $1,000 | $1.39 | 44d | 1 | 0.98mi |
| 1401 NE 22nd St Oklahoma City, OK | 2.0 | 1.0 | 728 | $1,100 | $1.51 | 23d | 1 | 1.21mi |
| 1330 NE 7th St Unit A Oklahoma City, OK | 1.0 | 1.0 | 534 | $900 | $1.69 | 44d | 1 | 1.22mi |
| 1509 N Everest Ave Unit 1 Oklahoma City, OK | 1.0 | 1.0 | 375 | $795 | $2.12 | 21d | 1 | 1.28mi |
| 1438 NE 27th St Oklahoma City, OK | 3.0 | 1.0 | 736 | $1,000 | $1.36 | 44d | 1 | 1.39mi |
| 935 NE 16th St Oklahoma City, OK | 1.0 | 1.0 | 727 | $795 | $1.09 | 44d | 1 | 1.48mi |
Listing history 28 events
-
2026-06-18days on market $65,000 Active 29 DOM
-
2026-06-17days on market $65,000 Active 28 DOM
-
2026-06-16days on market $65,000 Active 27 DOM
-
2026-06-15days on market $65,000 Active 26 DOM
-
2026-06-13days on market $65,000 Active 24 DOM
-
2026-06-09days on market $65,000 Active 20 DOM
-
2026-06-08days on market $65,000 Active 19 DOM
-
2026-06-07days on market $65,000 Active 18 DOM
-
2026-06-05days on market $65,000 Active 15 DOM
-
2026-06-03days on market $65,000 Active 14 DOM
-
2026-06-02days on market $65,000 Active 13 DOM
-
2026-06-01days on market $65,000 Active 12 DOM
-
2026-05-31days on market $65,000 Active 11 DOM
-
2026-05-20$65,000 Active
-
2026-04-30status Active
-
2026-04-01status Pending
-
2026-04-01status Active
-
2026-03-31historical
-
2026-03-31historical
-
2026-03-19price $73,000
-
2026-01-27price $74,400
-
2025-11-24price $74,500
-
2025-10-20$75,000 Active
-
2009-11-05historical
-
2009-05-04$34,900
-
2007-01-12soldstatus $30,000
-
2005-09-05historical
-
2003-11-05$26,000
ⓘ Source: listings_history table (triggers on properties + properties_extension) + one-shot
backfill from property_details.listing_events for pre-trigger history.
Tax reassessment forecast OK · Resets to sale price
- Current annual tax
- $504 · $42/mo
- Projected year-2 tax
- $585 · $49/mo
- Expected delta
- +$81/yr (+$7/mo · 16.1%)
ⓘ Screening estimate from a state-policy table — verify with the county assessor before closing.
Climate risk First Street
- Flood 1/10 Low FEMA zone X (unshaded) · 0% chance over 30 yrs
- Wildfire 1/10 Low
- Heat 5/10 Major 7 d/yr ≥107°F today · 18 d/yr by 30 yrs out
- Wind 3/10 Moderate 4% chance of damaging wind over 30 yrs
- Air quality 2/10 Low 1 unhealthy d/yr today · 2 by 30 yrs out
Nearby sold comps map
Loading sold comps map…
Walkable amenities ~0.75 mi
Loading nearby amenities…
Taxation est. · year 1
- Rental income
- $11,925
- − Mortgage interest
- −$3,641
- − Property taxes
- −$504
- − Insurance
- −$325
- − Repairs & maintenance
- −$954
- − Management
- −$954
- − Depreciation
- −$1,891
- Taxable income
- $3,656
- Est. tax owed @ 24.0%
- −$877
- After-tax cash flow
- $3,624/yr
For passive investors: Depreciation is non-cash, so a rental often shows a tax loss while cash-flowing — sheltering income. Rental losses are passive: they offset passive income freely, and up to $25,000/yr can offset ordinary (W-2) income if you actively participate and your MAGI is under $100k (phasing out to $0 by $150k); unused losses carry forward. On sale, claimed depreciation is recaptured at up to 25%, and gains may owe capital-gains tax (a 1031 exchange can defer both). Figures are a year-1 estimate at your 24.0% rate — not tax advice; consult a CPA.
Schools (NCES district)
- District
- Oklahoma City
- NCES district ID
- 4022770
- Math proficiency
- 7% ▼ -5.00%
- Reading proficiency
- 10% ▼ -6.00%
- Median HH income
- $35,606
- Composite
- 7.0/100
- National rank
- #9970
- State rank
- #254 of 270 in OK
Livability — Oklahoma City
- Score
- 80/100
- State rank
- #3
- US rank
- #1635
Category grades
Schools grade is shown separately in the Schools card above.
Census & demographics
- Census place
- Oklahoma City, OK
- County
- Oklahoma County · 771,644 people
- City population
- 498,656
- Metro
- Oklahoma City, OK
- Population (ZIP)
- 6,225
- Household income
- $23,413
- Rent vs Own
- Severe rent burden
- 681.0
Population outlook (Oklahoma County) Hauer SSP2
- Today (2025)
- 911,875 people
- By 2030
- 982,413 · +7.7%
- By 2040
- 1,130,468 · +24.0%
- By 2050
- 1,288,422 · +41.3%
- By 2075
- 1,711,482 · +87.7%
- By 2100
- 2,088,448 · +129.0%
Race, ethnicity, and origin ACS 2023
- Neighborhood character
- Diverse neighborhood (Simpson 0.56)
- Race & ethnicity
- Black 63% White 16% Two or more races 13% Hispanic / Latino 12% Asian 2%
- Hispanic origin (detail)
- Mexican 10%
- Foreign-born
- 10% · Canada, Guatemala, China
- Languages at home
- 87% English-only · Spanish 8% Other Indo-European 1% Other Asian/Pacific 1%
Political lean MEDSL · Oklahoma
- 2024 margin
- Toss-up / Even · D 48.0% · R 49.7% · Other 2.3%
- 2008→2024 swing
- +15.1pp toward D · 2008: -16.8pp · 2024: -1.7pp
- All cycles
- 2024: R+1.7 2020: R+1.1 2016: R+10.5 2012: R+16.7 2008: R+16.8
Not yet ingested
- Civics
- —
Market trends
- HPI YoY
- ▲ 2.42%
- Current HPI
- 192.3185
- Rent YoY
- —
- Metro
- Oklahoma City, OK
- State GDP YoY
- ▲ 1.55%
- F500 in state
- 6
Industry mix (Fortune 500 HQ in OK)
| Industry | F500 HQs | Revenue |
|---|---|---|
| Energy | 3 | $48B |
|
||
Price history
+150.0% since first listed15 events — show timeline
- 2026-05-20 Listed $65,000 MLSOK
- 2026-04-30 Relisted — MLSOK
- 2026-04-01 Pending — MLSOK
- 2026-04-01 Relisted — MLSOK
- 2026-03-31 Listing Removed — MLSOK
- 2026-03-31 Listing Removed — MLSOK
- 2026-03-19 Price Changed $73,000 MLSOK
- 2026-01-27 Price Changed $74,400 MLSOK
- 2025-11-24 Price Changed $74,500 MLSOK
- 2025-10-20 Listed $75,000 MLSOK
- 2009-11-05 Listing Removed — MLSOK
- 2009-05-04 Listed $34,900 MLSOK
- 2007-01-12 Sold (Public Records) $30,000 Public Records
- 2005-09-05 Listing Removed — MLSOK
- 2003-11-05 Listed $26,000 MLSOK
Property tax history
+0.5%/yrLatest (2025): $504 · +4.2% YoY. Source: county tax records.
Cash-flow waterfall
monthlySold comps — $/sqft
last 12 mo · ≤1 miLoading sold comps…