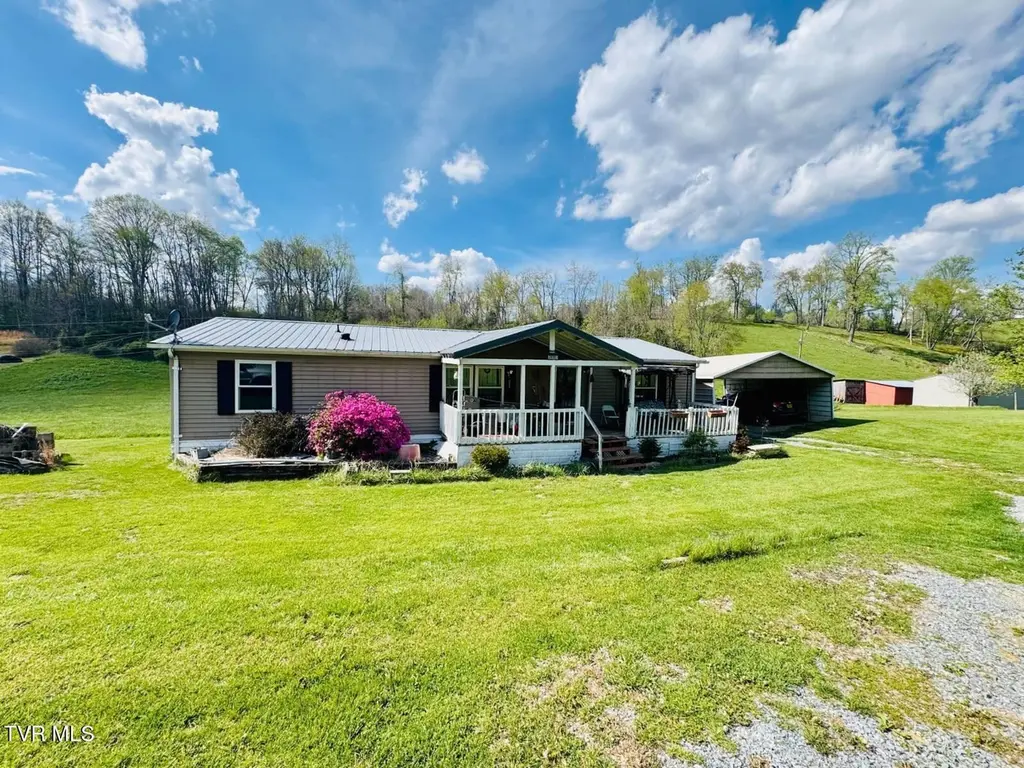
31111 Rich Valley Rd · Saltville, VA
Flood risk 9/10 · Severe
- FEMA flood zone
- X (unshaded)
- Chance of flooding over 30 yrs
- 0.99%
- Est. flood insurance / yr
- $507 – $1,088
Fire risk 6/10 · Moderate
- Est. fire insurance / yr
- $666 – $1,236
Heat risk 3/10 · Minor
- Hot days now (above 94°F)
- 7 days/yr
- Hot days in 30 yrs
- 20 days/yr
Wind risk 2/10 · Minimal
- Chance of severe wind over 30 yrs
- —
Air-quality risk 1/10 · Minimal
- Unhealthy air days now
- 0 days/yr
- Unhealthy air days in 30 yrs
- 0 days/yr
Risk factors via First Street. Map © Google.
Why this score? — see what drove the C grade
The composite is a weighted blend of 9 inputs, each scored 0–100. Each bar is that input's sub-score; the figure is the points it added to the 100-point composite (weight × sub-score).
- Cash flow +19.6/30.0
- ARV discount +7.5/15.0
- Appreciation +6.5/10.0
- DSCR +6.2/10.0
- Schools +6.2/10.0
- 1% rule +5.2/10.0
- Livability +3.6/5.0
- Rent growth +2.5/5.0
- Condition / age +2.5/5.0
$174,990
🖨 Deal sheet 📄 Offer letter ✓ Due diligence
Listing remarks
Affordable country living with room to breathe, this double wide on a permanent foundation delivers space, privacy, and practical upgrades without the inflated price tag. What really sets this property apart is the nearly 4 acres of land, a rare find in this price range, paired with a metal roof, new water heater and updated windows and heat pump that take care of the big ticket headaches upfront. The home comes with what you need to get started, making it an easy transition whether you're buying your first place, downsizing, or investing. Inside offers a comfortable, no nonsense layout with flexibility to make it your own over time, live in it as is or add your personal touch. Outside is w
Key facts
- Metal roof
- Heat pump
- Updated windows
Tags
Property features AI
Finance
- Other: Approximately 3.62-acre lot
Exterior
- Parking: Carport with 2 spaces
- Utilities: Public water; Septic tank sewer
- Home design: Manufactured house; One story; Residential single-family property; Rolling slope lot; Zoned for mobile home residential
- Construction: Vinyl siding; Other construction materials; Metal roof
- Exterior features: Covered porch
Interior
- Kitchen: Gas Range; Refrigerator; Dishwasher not listed
- Flooring: Carpet
- Bathrooms: 2 full bathrooms
- Heating & cooling: Heat pump heating; Central air conditioning
- Interior features: Dryer; Gas Range; Refrigerator; Washer; Carpet flooring; Total of 8 rooms
- Laundry & utility: Washer; Dryer
Neighborhood map
What this means for you Summary
Snapshot
- This is a 3-bed/2.0-bath manufactured listed at $175k.
Deal economics
- At list price, monthly cash flow is $136 ($2k/yr) — positive.
- The deal already cash-flows at list — no discount required.
- Meets the 1% rule at list price ($2k rent vs $175k).
Location & tenants
- Location reads 72/100 on livability (#206 in VA) — a middle-class / working-renter tenant base. Strengths: crime A+, cost of living A+, housing A+; Watch: amenities F, commute F, employment F.
- Washington County Public School District (rural): math 68% / reading 79% proficiency, ranked #15 of 131 in VA (top 12%) — strong family-tenant draw, lease renewals of 3-5y typical.
- Zoned schools: Meadowview Elementary (math 63% / reading 74%, grade B+, #357 of 1,108 statewide, top 33%, 551 students, 89% FRL); Glade Spring Middle (math 70% / reading 74%, grade A, #65 of 342 statewide, top 21%, 254 students, 80% FRL); Patrick Henry High (math 62% / reading 82%, grade B+, #134 of 319 statewide, top 45%, 366 students, 66% FRL) — zoned schools average 78% FRL vs 42% district-wide (36 pts higher); higher-poverty schools than district average — tighter screening recommended.
- Market conditions: 36 active listings in the ZIP; 99 units permitted in Washington County in 2024 (0 in 5+ unit buildings).
Forward outlook
- In year one you build about $7k of equity ($1k loan paydown + $5k appreciation (3.1% local appreciation)).
- Washington County population projected at -14% by 2050 — secular population decline; favor cash flow + early exit over multi-decade hold.
- At projected returns (3.1% appreciation + 3.0% rent growth), your $49k cash investment doubles in ~6 years — after that, you're playing with house money.
- By year 6, paydown + projected appreciation supports a ~$35k cash-out refi (75% LTV) — recoverable capital for the next deal without selling this one.
Negotiation context
- Only 4 days on market — expect competitive offers; lowballing is unlikely to land.
Risks & watch-outs
- Watch-outs: flood insurance adds $66/mo.
- Climate carrying-cost: severe flood risk; major wildfire risk — expect insurance premiums to compound above CPI over the hold.
Questions for the listing agent
- What's the actual annual flood-insurance premium (NFIP or private), and is the property in a SFHA with mandatory coverage?
- Is there a deadline driving the sale (1031 exchange, divorce, estate, relocation)? That informs how much negotiation room exists.
- Schools are A-rated — typically a magnet for longer-tenancy family renters. What's the average tenant stay here, and is there a school-zone premium baked into asking?
- What's the average days-on-market for RENTAL listings here right now (not sales)? A rising rental-DOM trend means longer vacancies and softer asking-rent achievability than the comps imply.
- What's the recent tenant-quality profile in this submarket — average credit score on applications, eviction rate, late-payment / NSF rate, and stable-employment percentage? A property-management company in the area should have these aggregated.
- How much new for-sale + rental construction is in the pipeline within 1–3 miles? Heavy new supply typically softens prices + rents 12–24 months out; constrained supply supports both.
Investment metrics
- 1% rule
- 1.02% ✓
- Cap rate
- 7.68%
- Cash-on-cash
- 4.97%
- DSCR
- 1.22
- GRM
- 8.2
CMA / ARV
No comps found within radius.
Projected returns pro-forma
3.06% appreciation · 3.0% rent growth · sell at horizon
- IRR
- 10.8%
- Equity multiple
- 1.62×
- Total profit
- $30,382
- Equity at exit
- $79,267
- IRR
- 13.0%
- Equity multiple
- 2.95×
- Total profit
- $95,427
- Equity at exit
- $122,615
Cash invested: $48,997 (down + closing). Projections, not guarantees.
Landlord ↔ Tenant lean methodology
- Overall (STATE)
- 55 Moderately Landlord-Leaning
- State Virginia
- 55 Moderately Landlord-Leaning · D+2
- County
- — inherits STATE
- City
- — inherits STATE
ZIP-level market 24361
- Home prices YoY
- 1.6%
- Active inventory
- 36
- Price-to-rent
- 8.2×
Monthly cashflow live
- Estimated rent
- $1,788 medium interval (Pro) →
- Mortgage (P&I)
- −$918
- Tax est. 1.5%
- −$219 /mo · $2,625/yr
- Insurance
- −$73
- Flood insurance flood zone
- −$66 /mo · $798/yr
- HOA
- −$0
- Vacancy / Maint / Mgmt
- −$375
- Net cashflow
- $136
Break-even live
UW: 25.0% down · 7.5% · 30yr · 1.5% tax · 5.0% vac · 8.0% maint · 8.0% mgmt
Financing live
Cash to close
- Down payment
- $43,748
- Closing costs
- $5,250
- Reserves months
- —
- Total cash needed
- —
Loan-product check · same deal, 3 products live
Conventional
25% down · 7.5% · 30yr
- Down + closing
- —
- Monthly P&I
- —
- Monthly cashflow
- —
- DSCR
- —
- Eligible?
- —
Personal DTI + credit; lowest rate.
DSCR
20% down · 8.5% · 30yr
- Down + closing
- —
- Monthly P&I
- —
- Monthly cashflow
- —
- DSCR
- —
- Eligible?
- —
No personal income docs; deal must DSCR.
Hard money
10% down · 12.0% · 12mo
- Down + closing
- —
- Monthly P&I
- —
- Monthly cashflow
- —
- DSCR
- —
- Eligible?
- —
Short-term bridge; refi at stabilization.
Listing history 4 events
-
2026-05-31status $174,990 Pending 4 DOM
-
2026-05-30days on market $174,990 Active 4 DOM
-
2026-05-14status Pending
-
2026-05-14$174,999 Active
ⓘ Source: listings_history table (triggers on properties + properties_extension) + one-shot
backfill from property_details.listing_events for pre-trigger history.
Climate risk First Street
- Flood 9/10 Extreme FEMA zone X (unshaded) · 99% chance over 30 yrs
- Wildfire 6/10 Major
- Heat 3/10 Moderate 7 d/yr ≥94°F today · 20 d/yr by 30 yrs out
- Wind 2/10 Low
- Air quality 1/10 Low 0 unhealthy d/yr today · 0 by 30 yrs out
Nearby sold comps map
Loading sold comps map…
Walkable amenities ~0.75 mi
Loading nearby amenities…
Taxation est. · year 1
- Rental income
- $21,450
- − Mortgage interest
- −$9,802
- − Property taxes
- −$2,625
- − Insurance
- −$1,672
- − Repairs & maintenance
- −$1,716
- − Management
- −$1,716
- − Depreciation
- −$5,091
- Taxable loss
- −$1,172
- Est. tax savings @ 24.0%
- +$281
- After-tax cash flow
- $1,918/yr
For passive investors: Depreciation is non-cash, so a rental often shows a tax loss while cash-flowing — sheltering income. Rental losses are passive: they offset passive income freely, and up to $25,000/yr can offset ordinary (W-2) income if you actively participate and your MAGI is under $100k (phasing out to $0 by $150k); unused losses carry forward. On sale, claimed depreciation is recaptured at up to 25%, and gains may owe capital-gains tax (a 1031 exchange can defer both). Figures are a year-1 estimate at your 24.0% rate — not tax advice; consult a CPA.
Schools (NCES district)
- District
- Washington County Public School District
- NCES district ID
- 5103900
- Math proficiency
- 68% ▼ -23.00%
- Reading proficiency
- 79% ▼ -7.00%
- Median HH income
- $42,412
- Composite
- 61.5/100
- National rank
- #754
- State rank
- #15 of 131 in VA
Livability — Saltville
- Score
- 72/100
- State rank
- #206
- US rank
- #6370
Category grades
Schools grade is shown separately in the Schools card above.
Census & demographics
- Population (ZIP)
- 4,644
Population outlook (Washington County) Hauer SSP2
- Today (2025)
- 53,266 people
- By 2030
- 52,284 · -1.8%
- By 2040
- 49,415 · -7.2%
- By 2050
- 45,683 · -14.2%
- By 2075
- 37,258 · -30.1%
- By 2100
- 27,983 · -47.5%
Race, ethnicity, and origin ACS 2023
- Neighborhood character
- Predominantly White (98%)
- Race & ethnicity
- White 98% Two or more races 1%
- Common ancestry
- Serbian 2% Italian 2% Lithuanian 1%
- Foreign-born
- 1%
- Languages at home
- 99% English-only · Spanish 1%
Political lean MEDSL · Washington
- 2024 margin
- Solid R (+53.3) · D 23.0% · R 76.3%
- 2008→2024 swing
- -20.6pp toward R · 2008: -32.7pp · 2024: -53.3pp
- All cycles
- 2024: R+53.3 2020: R+52.5 2016: R+53.5 2012: R+43.2 2008: R+32.7
Not yet ingested
- Civics
- —
Market trends
- HPI YoY
- ▲ 3.06%
- Current HPI
- 190.3097
- Rent YoY
- —
- Metro
- —
- State GDP YoY
- ▲ 2.40%
- F500 in state
- 50
Industry mix (Fortune 500 HQ in VA)
| Industry | F500 HQs | Revenue |
|---|---|---|
| Aerospace / Defense | 4 | $236B |
|
||
| Technology / Defense | 3 | $32B |
|
||
| Financial Services | 2 | $176B |
|
||
| Utilities | 2 | $27B |
|
||
| Insurance | 2 | $25B |
|
||
| Technology | 2 | $15B |
|
||
Price history
2 events — show timeline
- 2026-05-14 Pending — TVRMLS
- 2026-05-14 Listed $174,999 TVRMLS
Property tax history
-3.5%/yrLatest (2026): $281 · -22.8% YoY. Source: county tax records.
Cash-flow waterfall
monthlySold comps — $/sqft
last 12 mo · ≤1 miLoading sold comps…