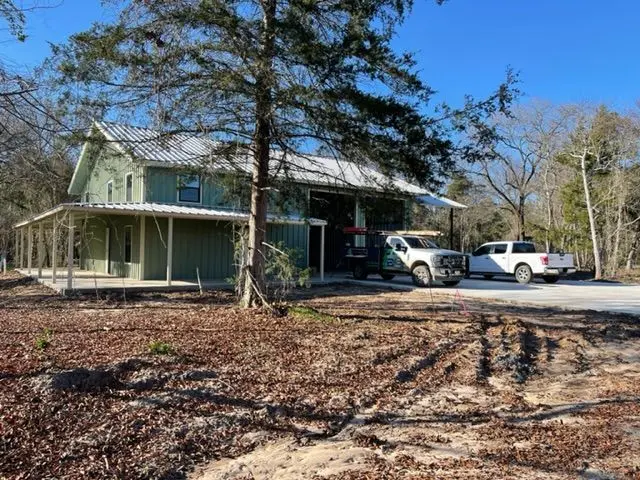
121 Whispering Pnes · Winnsboro, TX
Flood risk No data
- FEMA flood zone
- —
- Chance of flooding over 30 yrs
- —
- Est. flood insurance / yr
- —
Fire risk No data
- Est. fire insurance / yr
- —
Heat risk No data
- Hot days now (above threshold)
- —
- Hot days in 30 yrs
- —
Wind risk No data
- Chance of severe wind over 30 yrs
- —
Air-quality risk No data
- Unhealthy air days now
- —
- Unhealthy air days in 30 yrs
- —
Risk factors via First Street. Map © Google.
Why this score? — see what drove the C grade
The composite is a weighted blend of 9 inputs, each scored 0–100. Each bar is that input's sub-score; the figure is the points it added to the 100-point composite (weight × sub-score).
- ARV discount +15.0/15.0
- Cash flow +13.2/30.0
- Appreciation +7.6/10.0
- Condition / age +4.8/5.0
- DSCR +4.0/10.0
- Schools +3.9/10.0
- 1% rule +3.7/10.0
- Livability +3.5/5.0
- Rent growth +2.5/5.0
$395,000
🖨 Deal sheet 📄 Offer letter ✓ Due diligence
Listing remarks MLS
The Audrey boasts approximately 3520 sf under roof, a huge wrap around porch and a porte-cochere designed to store an RV. The porte-cochere is 14' tall and 12' wide and 40' deep, plenty of room for an RV. Storing your boats, classic cars, RV or lake toys inside the Boat Barn are easy with the two 14' tall large doors for access . The driveway is large and wide making backing up a trailer a breeze. The living quarters/ManCave has a full kitchen, den, 2 bedrooms and two baths with the bedrooms and bath upstairs with a loft. This is under construction and plenty of time to customize to your particular needs.
Key facts
- 0.75 acre lot
- 3 parking spots
- Built 2023
Neighborhood map
What this means for you Summary
Snapshot
- This is a 2-bed/2.0-bath single-family listed at $395k. Condition is rated excellent.
Deal economics
- At list price, monthly cash flow is $-4 ($-51/yr) — negative.
- To cash-flow at today's rent, offer at most $394k (0.2% below list).
- To meet the 1% rule (rent ≥ 1% of price), the offer needs to be $345k (12.7% below list).
- Recommended offer: $345k (12.7% below list) — sets the bar for 1% rule.
- Cap rate 6.3% vs local median 3.8% in Winnsboro — top-decile yield for the area; either an underpriced asset or a hidden risk that comps aren't pricing in. Stress-test before assuming the spread holds.
Location & tenants
- Location reads 69/100 on livability (#416 in TX) — a middle-class / working-renter tenant base. Strengths: cost of living A+, housing A+, crime B; Watch: employment D+, amenities F, commute F.
- Mount Vernon ISD (town): math 49% / reading 43% proficiency, ranked #251 of 826 in TX (top 30%) — families likely to look elsewhere, expect single-tenant / working-renter base with shorter leases.
- Market conditions: 96 active listings in the ZIP; 1 comparable units currently listed for rent nearby; 7 units permitted in Franklin County in 2024 (0 in 5+ unit buildings).
Forward outlook
- In year one you build about $23k of equity ($3k loan paydown + $20k appreciation (5.1% local appreciation)).
- At projected returns (5.1% appreciation + 3.0% rent growth), your $111k cash investment doubles in ~5 years — after that, you're playing with house money.
- By year 2, paydown + projected appreciation supports a ~$37k cash-out refi (75% LTV) — recoverable capital for the next deal without selling this one.
Negotiation context
- It's been on market 919 days — a 12% lower offer ($348k) is reasonable based on typical stale-listing flexibility.
Questions for the listing agent
- What do current leases actually rent for vs. the listed asking? Can we see a recent rent roll and the last 12 months of T-12 income?
- It's been on market 919 days. Have you received any prior offers? Is the seller open to a 13% concession, seller financing, or rate buy-down credit?
- Why hasn't it sold? Are there any deal-killer items the seller is aware of (foundation, flood, title, zoning, code violations)?
- Is there a deadline driving the sale (1031 exchange, divorce, estate, relocation)? That informs how much negotiation room exists.
- What's the average days-on-market for RENTAL listings here right now (not sales)? A rising rental-DOM trend means longer vacancies and softer asking-rent achievability than the comps imply.
- What's the recent tenant-quality profile in this submarket — average credit score on applications, eviction rate, late-payment / NSF rate, and stable-employment percentage? A property-management company in the area should have these aggregated.
- How much new for-sale + rental construction is in the pipeline within 1–3 miles? Heavy new supply typically softens prices + rents 12–24 months out; constrained supply supports both.
Investment metrics
- 1% rule
- 0.87% ✗
- Cap rate
- 6.28%
- Cash-on-cash
- -0.05%
- DSCR
- 1.00
- GRM
- 9.5
CMA / ARV
- ARV (median comp)
- $742,110
- List price
- $395,000
- Delta
- -46.77%
- Verdict
- UNDERPRICED
- Comps
- 14 within 1.0 mi
Show comp detail 5 sales within ~0.75 mi
| Address | Dist | Beds/Ba | Sqft | Sold | Price | $/sf | Match |
|---|---|---|---|---|---|---|---|
| 100 Private Road 4303 | 0.09mi | 3/2.5 (+1) | 2,000 (0%) | 3mo | $399,000 | $200 | 86 |
| 329 Hickory Hill Ln | 0.48mi | 3/2.0 (+1) | 1,895 (-5%) | 6mo | $1,369,000 | $722 | 58 |
| 85 SE County Road Se 4305 | 0.21mi | 3/2.0 (+1) | 1,792 (-10%) | 14mo | $299,999 | $167 | 56 |
| 319 South Park Rd | 0.74mi | 3/2.0 (+1) | 1,860 (-7%) | 21mo | $949,000 | $510 | 32 |
| 144 Country Club Rd | 0.58mi | 3/2.0 (+1) | 2,246 (+12%) | 22mo | $1,050,000 | $467 | 29 |
Match score weights: distance 35% · size 25% · config 20% · recency 20%. Top-matched comps best support the ARV.
Projected returns pro-forma
5.13% appreciation · 3.0% rent growth · sell at horizon
- IRR
- 13.2%
- Equity multiple
- 1.85×
- Total profit
- $93,675
- Equity at exit
- $226,876
- IRR
- 14.0%
- Equity multiple
- 3.55×
- Total profit
- $282,276
- Equity at exit
- $394,089
Cash invested: $110,600 (down + closing). Projections, not guarantees.
Landlord ↔ Tenant lean methodology
- Overall (STATE)
- 87 Strongly Landlord-Friendly
- State Texas
- 87 Strongly Landlord-Friendly · R+5
- County
- — inherits STATE
- City
- — inherits STATE
ZIP-level market 75480
- Home prices YoY
- 2.2%
- Active inventory
- 96
- Price-to-rent
- 9.5×
Monthly cashflow live
- Estimated rent
- $3,450 medium interval (Pro) →
- Mortgage (P&I)
- −$2,071
- Tax est. 1.5%
- −$494 /mo · $5,925/yr
- Insurance
- −$165
- HOA
- −$0
- Vacancy / Maint / Mgmt
- −$724
- Net cashflow
- $-4
Break-even live
UW: 25.0% down · 7.5% · 30yr · 1.5% tax · 5.0% vac · 8.0% maint · 8.0% mgmt
Financing live
Cash to close
- Down payment
- $98,750
- Closing costs
- $11,850
- Reserves months
- —
- Total cash needed
- —
Loan-product check · same deal, 3 products live
Conventional
25% down · 7.5% · 30yr
- Down + closing
- —
- Monthly P&I
- —
- Monthly cashflow
- —
- DSCR
- —
- Eligible?
- —
Personal DTI + credit; lowest rate.
DSCR
20% down · 8.5% · 30yr
- Down + closing
- —
- Monthly P&I
- —
- Monthly cashflow
- —
- DSCR
- —
- Eligible?
- —
No personal income docs; deal must DSCR.
Hard money
10% down · 12.0% · 12mo
- Down + closing
- —
- Monthly P&I
- —
- Monthly cashflow
- —
- DSCR
- —
- Eligible?
- —
Short-term bridge; refi at stabilization.
Rent comps 1 comps
| Address | Beds | Baths | Sqft | Rent | $/sqft | DOM | Units | Dist |
|---|---|---|---|---|---|---|---|---|
| 224 Miller Rd Scroggins, TX | 3.0 | 2.0 | 1485 | $3,450 | $2.32 | 43d | 1 | 1.08mi |
Listing history 16 events
-
2026-06-19days on market $395,000 Active 919 DOM
-
2026-06-18days on market $395,000 Active 918 DOM
-
2026-06-17days on market $395,000 Active 917 DOM
-
2026-06-16days on market $395,000 Active 916 DOM
-
2026-06-15days on market $395,000 Active 915 DOM
-
2026-06-14days on market $395,000 Active 913 DOM
-
2026-06-12days on market $395,000 Active 912 DOM
-
2026-06-09days on market $395,000 Active 909 DOM
-
2026-06-08days on market $395,000 Active 908 DOM
-
2026-06-07days on market $395,000 Active 907 DOM
-
2026-06-05days on market $395,000 Active 905 DOM
-
2026-06-02days on market $395,000 Active 902 DOM
-
2026-06-01days on market $395,000 Active 901 DOM
-
2026-05-31days on market $395,000 Active 900 DOM
-
2026-05-30days on market $395,000 Active 899 DOM
-
2023-12-14$395,000 Active 612-char remark
Show marketing remark (612 chars)
The Audrey boasts approximately 3520 sf under roof, a huge wrap around porch and a porte-cochere designed to store an RV. The porte-cochere is 14' tall and 12' wide and 40' deep, plenty of room for an RV. Storing your boats, classic cars, RV or lake toys inside the Boat Barn are easy with the two 14' tall large doors for access . The driveway is large and wide making backing up a trailer a breeze. The living quarters/ManCave has a full kitchen, den, 2 bedrooms and two baths with the bedrooms and bath upstairs with a loft. This is under construction and plenty of time to customize to your particular needs.
ⓘ Source: listings_history table (triggers on properties + properties_extension) + one-shot
backfill from property_details.listing_events for pre-trigger history.
Nearby sold comps map
Loading sold comps map…
Walkable amenities ~0.75 mi
Loading nearby amenities…
Taxation est. · year 1
- Rental income
- $41,400
- − Mortgage interest
- −$22,126
- − Property taxes
- −$5,925
- − Insurance
- −$1,975
- − Repairs & maintenance
- −$3,312
- − Management
- −$3,312
- − Depreciation
- −$11,491
- Taxable loss
- −$6,741
- Est. tax savings @ 24.0%
- +$1,618
- After-tax cash flow
- $1,567/yr
For passive investors: Depreciation is non-cash, so a rental often shows a tax loss while cash-flowing — sheltering income. Rental losses are passive: they offset passive income freely, and up to $25,000/yr can offset ordinary (W-2) income if you actively participate and your MAGI is under $100k (phasing out to $0 by $150k); unused losses carry forward. On sale, claimed depreciation is recaptured at up to 25%, and gains may owe capital-gains tax (a 1031 exchange can defer both). Figures are a year-1 estimate at your 24.0% rate — not tax advice; consult a CPA.
Condition & rehab AI · 13 photos
This property is in excellent condition with no immediate repairs needed. It offers a great opportunity for a potential buyer or investor looking for a move-in-ready home with excellent curb appeal.
Value-add opportunities
- Both Painting the exterior and interior walls — Fresh paint enhances curb appeal and interior aesthetics.
- Both Landscaping the front yard — A well-maintained front yard improves curb appeal and property value.
Renovation cost estimate screening
Value-add ROI direction
- Both Painting the exterior and interior walls — Fresh paint enhances curb appeal and interior aesthetics. ↑
- Both Landscaping the front yard — A well-maintained front yard improves curb appeal and property value. ↑
ⓘ Cost ranges are severity-bucket heuristics (US national rule-of-thumb). Get contractor quotes + a written scope before underwriting a rehab budget.
Schools (NCES district)
- District
- Mount Vernon ISD
- NCES district ID
- 4831770
- Math proficiency
- 49% ▼ -6.00%
- Reading proficiency
- 43% ▬ 0.00%
- Median HH income
- $46,788
- Composite
- 39.19/100
- National rank
- #4021
- State rank
- #251 of 826 in TX
Livability — Winnsboro
- Score
- 69/100
- State rank
- #416
- US rank
- #8564
Category grades
Schools grade is shown separately in the Schools card above.
Census & demographics
- Population (ZIP)
- 1,787
Population outlook (Franklin County) Hauer SSP2
- Today (2025)
- 10,621 people
- By 2030
- 10,648 · +0.3%
- By 2040
- 10,629 · +0.1%
- By 2050
- 10,486 · -1.3%
- By 2075
- 10,038 · -5.5%
- By 2100
- 8,816 · -17.0%
Race, ethnicity, and origin ACS 2023
- Neighborhood character
- Predominantly White (82%)
- Race & ethnicity
- White 82% Two or more races 16% Hispanic / Latino 14%
- Hispanic origin (detail)
- Mexican 12%
- Common ancestry
- Slovak 8% German 7% Romanian 4%
- Foreign-born
- 9% · Canada
- Languages at home
- 86% English-only · Spanish 13%
Political lean MEDSL · Franklin
- 2024 margin
- Solid R (+68.9) · D 15.3% · R 84.2%
- 2008→2024 swing
- -16.5pp toward R · 2008: -52.5pp · 2024: -68.9pp
- All cycles
- 2024: R+68.9 2020: R+67.0 2016: R+67.0 2012: R+63.4 2008: R+52.5
Not yet ingested
- Civics
- —
Market trends
- HPI YoY
- ▲ 5.13%
- Current HPI
- 234.5679
- Rent YoY
- —
- Metro
- —
- State GDP YoY
- ▲ 3.95%
- F500 in state
- 110
Industry mix (Fortune 500 HQ in TX)
| Industry | F500 HQs | Revenue |
|---|---|---|
| Energy | 16 | $1,198B |
|
||
| Technology | 5 | $198B |
|
||
| Engineering / Construction | 4 | $72B |
|
||
| Energy Services | 3 | $60B |
|
||
| Utilities | 3 | $41B |
|
||
| Healthcare | 2 | $330B |
|
||
Price history
1 event — show timeline
- 2023-12-14 Listed $395,000 Zillow
Cash-flow waterfall
monthlySold comps — $/sqft
last 12 mo · ≤1 miLoading sold comps…