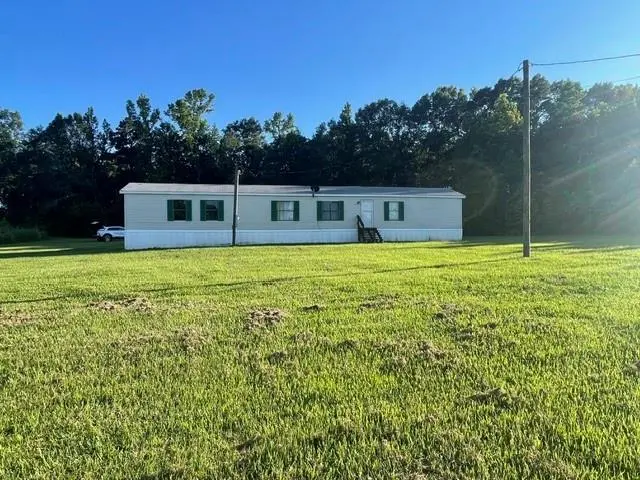
38828 Turkey Ridge Rd · Franklinton, LA
Flood risk 1/10 · Minimal
- FEMA flood zone
- X (unshaded)
- Chance of flooding over 30 yrs
- 0.0%
- Est. flood insurance / yr
- $507 – $1,088
Fire risk 5/10 · Moderate
- Est. fire insurance / yr
- $1,269 – $2,357
Heat risk 8/10 · Major
- Hot days now (above 108°F)
- 7 days/yr
- Hot days in 30 yrs
- 20 days/yr
Wind risk 8/10 · Major
- Chance of severe wind over 30 yrs
- 99.0%
Air-quality risk 1/10 · Minimal
- Unhealthy air days now
- 0 days/yr
- Unhealthy air days in 30 yrs
- 0 days/yr
Risk factors via First Street. Map © Google.
Why this score? — see what drove the B- grade
The composite is a weighted blend of 9 inputs, each scored 0–100. Each bar is that input's sub-score; the figure is the points it added to the 100-point composite (weight × sub-score).
- Cash flow +26.1/30.0
- DSCR +8.8/10.0
- ARV discount +7.5/15.0
- 1% rule +6.9/10.0
- Appreciation +6.5/10.0
- Livability +3.5/5.0
- Schools +2.8/10.0
- Rent growth +2.5/5.0
- Condition / age +2.5/5.0
$85,000
🖨 Deal sheet (PDF) 📄 Offer letter ✓ Due diligence
Listing remarks MLS
Charming starter home nestled in a peaceful country setting with plenty of room to grow. Enjoy the spacious front and back yards, perfect for outdoor activities, gardening, or simply relaxing in the quiet surroundings. Recent improvements include new skirting, a 2021 water well, and a 2021 septic system for added peace of mind. Inside, the owner has completed cosmetic updates, creating a fresh and inviting feel. The home also features a convenient utility area with washer and dryer and a covered back porch ideal for enjoying the outdoors year-round. (Located in Flood Zone X)
Key facts
- 2021 septic system
- Utility area
- 2021 water well
Tags
Property features AI
Finance
- Other: Total rooms: 7
Exterior
- Parking: Driveway
- Utilities: Septic tank; Well water
- Home design: Single-story; Raised foundation; Average condition; Asphalt/shingle roof
- Construction: Raised foundation; Asphalt/shingle roof
- Exterior features: Porch; City lot; Rectangular lot; Lot dimensions: 126 x 257 x 225 x 234
Interior
- Kitchen: Dishwasher; Oven; Range
- Bathrooms: 2 full bathrooms
- Heating & cooling: Central heating; Window unit heating; Central air conditioning; Window unit air conditioning
- Interior features: Ceiling fan(s)
- Laundry & utility: Washer hookup; Dryer hookup
Neighborhood map
What this means for you Summary
Snapshot
- This is a 3-bed/2.0-bath manufactured listed at $85k.
Deal economics
- At list price, monthly cash flow is $213 ($3k/yr) — positive.
- The deal already cash-flows at list — no discount required.
- Meets the 1% rule at list price ($1k rent vs $85k).
- Cap rate 9.3% vs local median 5.3% in Franklinton — top-decile yield for the area; either an underpriced asset or a hidden risk that comps aren't pricing in. Stress-test before assuming the spread holds.
Location & tenants
- Location reads 69/100 on livability (#67 in LA) — a middle-class / working-renter tenant base. Strengths: cost of living A+, health & safety A+, crime B; Watch: amenities F, commute F, employment F.
- Washington Parish (rural): math 27% / reading 41% proficiency, ranked #38 of 98 in LA (top 39%) — families likely to look elsewhere, expect single-tenant / working-renter base with shorter leases; 77% free/reduced lunch — lower-income household profile, screen leases tightly.
- Market conditions: 23 active listings in the ZIP; 10 units permitted in Washington Parish in 2024 (0 in 5+ unit buildings).
Forward outlook
- In year one you build about $3k of equity ($588 loan paydown + $3k appreciation (3.0% local appreciation)).
- Washington County population projected at -16% by 2050 — secular population decline; favor cash flow + early exit over multi-decade hold.
- At projected returns (3.0% appreciation + 3.0% rent growth), your $24k cash investment doubles in ~4 years — after that, you're playing with house money.
- By year 10, paydown + projected appreciation supports a ~$31k cash-out refi (75% LTV) — recoverable capital for the next deal without selling this one.
Negotiation context
- Only 6 days on market — expect competitive offers; lowballing is unlikely to land.
- 5 sale attempts since 5y ago with the ask held roughly flat each time — persistent listings suggest the price (not the market) is what's stuck; bring a comps-based counter.
- Current owner paid $12k; list at $85k implies a 608% gain — meaningful room to come down on a strong offer.
Risks & watch-outs
- Climate carrying-cost: severe wind risk, 99% chance of damaging wind over 30y; moderate wildfire risk; extreme-heat days projected 7→20/yr by 2055 (HVAC capex compounding) — expect insurance premiums to compound above CPI over the hold.
Questions for the listing agent
- Is there a deadline driving the sale (1031 exchange, divorce, estate, relocation)? That informs how much negotiation room exists.
- What's the average days-on-market for RENTAL listings here right now (not sales)? A rising rental-DOM trend means longer vacancies and softer asking-rent achievability than the comps imply.
- What's the recent tenant-quality profile in this submarket — average credit score on applications, eviction rate, late-payment / NSF rate, and stable-employment percentage? A property-management company in the area should have these aggregated.
- How much new for-sale + rental construction is in the pipeline within 1–3 miles? Heavy new supply typically softens prices + rents 12–24 months out; constrained supply supports both.
Investment metrics
- 1% rule
- 1.19% ✓
- Cap rate
- 9.30%
- Cash-on-cash
- 10.74%
- DSCR
- 1.48
- GRM
- 7.0
CMA / ARV
No comps found within radius.
Projected returns pro-forma
3.05% appreciation · 3.0% rent growth · sell at horizon
- IRR
- 17.7%
- Equity multiple
- 2.01×
- Total profit
- $24,031
- Equity at exit
- $38,438
- IRR
- 19.1%
- Equity multiple
- 3.79×
- Total profit
- $66,309
- Equity at exit
- $59,408
Cash invested: $23,800 (down + closing). Projections, not guarantees.
Landlord ↔ Tenant lean methodology
- Overall (STATE)
- 90 Strongly Landlord-Friendly
- State Louisiana
- 90 Strongly Landlord-Friendly · R+12
- County
- — inherits STATE
- City
- — inherits STATE
ZIP-level market 70450
- Home prices YoY
- 3.3%
- Active inventory
- 23
- Price-to-rent
- 7.0×
Monthly cashflow live
- Estimated rent
- $1,013 medium interval (Pro) →
- Mortgage (P&I)
- −$446
- Tax est. 1.5%
- −$106 /mo · $1,275/yr
- Insurance
- −$35
- HOA
- −$0
- Vacancy / Maint / Mgmt
- −$213
- Net cashflow
- $213
Break-even live
Sensitivity live
| Price | -10% $272 | -5% $242 | +0% $213 | +5% $184 | +10% $154 |
|---|---|---|---|---|---|
| Rent | -10% $133 | -5% $173 | +0% $213 | +5% $253 | +10% $293 |
| Rate | -1.0pp $256 | -0.5pp $235 | base $213 | +0.5pp $191 | +1.0pp $169 |
UW: 25.0% down · 7.5% · 30yr · 1.5% tax · 5.0% vac · 8.0% maint · 8.0% mgmt
Financing live
Cash to close
- Down payment
- $21,250
- Closing costs
- $2,550
- Reserves months
- —
- Total cash needed
- —
Loan-product check · same deal, 3 products live
Conventional
25% down · 7.5% · 30yr
- Down + closing
- —
- Monthly P&I
- —
- Monthly cashflow
- —
- DSCR
- —
- Eligible?
- —
Personal DTI + credit; lowest rate.
DSCR
20% down · 8.5% · 30yr
- Down + closing
- —
- Monthly P&I
- —
- Monthly cashflow
- —
- DSCR
- —
- Eligible?
- —
No personal income docs; deal must DSCR.
Hard money
10% down · 12.0% · 12mo
- Down + closing
- —
- Monthly P&I
- —
- Monthly cashflow
- —
- DSCR
- —
- Eligible?
- —
Short-term bridge; refi at stabilization.
Listing history 6 events
-
2026-06-18days on market $85,000 Active 6 DOM
-
2026-06-17days on market $85,000 Active 5 DOM
-
2026-06-16days on market $85,000 Active 4 DOM
-
2026-06-15days on market $85,000 Active 3 DOM
-
2026-06-13remarks 581-char remark
-
2026-06-13$85,000 Active 1 DOM
ⓘ Source: listings_history table (triggers on properties + properties_extension) + one-shot
backfill from property_details.listing_events for pre-trigger history.
Climate risk First Street
- Flood 1/10 Low FEMA zone X (unshaded) · 0% chance over 30 yrs
- Wildfire 5/10 Major
- Heat 8/10 Severe 7 d/yr ≥108°F today · 20 d/yr by 30 yrs out
- Wind 8/10 Severe 99% chance of damaging wind over 30 yrs
- Air quality 1/10 Low 0 unhealthy d/yr today · 0 by 30 yrs out
Nearby sold comps map
Loading sold comps map…
Walkable amenities ~0.75 mi
Loading nearby amenities…
Taxation est. · year 1
- Rental income
- $12,159
- − Mortgage interest
- −$4,761
- − Property taxes
- −$1,275
- − Insurance
- −$425
- − Repairs & maintenance
- −$973
- − Management
- −$973
- − Depreciation
- −$2,473
- Taxable income
- $1,280
- Est. tax owed @ 24.0%
- −$307
- After-tax cash flow
- $2,250/yr
For passive investors: Depreciation is non-cash, so a rental often shows a tax loss while cash-flowing — sheltering income. Rental losses are passive: they offset passive income freely, and up to $25,000/yr can offset ordinary (W-2) income if you actively participate and your MAGI is under $100k (phasing out to $0 by $150k); unused losses carry forward. On sale, claimed depreciation is recaptured at up to 25%, and gains may owe capital-gains tax (a 1031 exchange can defer both). Figures are a year-1 estimate at your 24.0% rate — not tax advice; consult a CPA.
Schools (NCES district)
- District
- Washington Parish
- NCES district ID
- 2201860
- Math proficiency
- 27% ▼ -34.00%
- Reading proficiency
- 41% ▼ -29.00%
- Median HH income
- $34,972
- Composite
- 28.03/100
- National rank
- #6844
- State rank
- #38 of 98 in LA
Livability — Franklinton
- Score
- 69/100
- State rank
- #67
- US rank
- #8352
Category grades
Schools grade is shown separately in the Schools card above.
Census & demographics
- Population (ZIP)
- 2,785
Population outlook (Washington County) Hauer SSP2
- Today (2025)
- 44,642 people
- By 2030
- 43,302 · -3.0%
- By 2040
- 40,345 · -9.6%
- By 2050
- 37,434 · -16.1%
- By 2075
- 29,954 · -32.9%
- By 2100
- 21,579 · -51.7%
Race, ethnicity, and origin ACS 2023
- Neighborhood character
- Predominantly White (73%)
- Race & ethnicity
- White 73% Black 17% Two or more races 10%
- Common ancestry
- Lithuanian 12% Italian 7% Iranian 1%
Political lean MEDSL · Washington
- 2024 margin
- Solid R (+40.3) · D 29.3% · R 69.6% · Other 1.1%
- 2008→2024 swing
- -7.6pp toward R · 2008: -32.7pp · 2024: -40.3pp
- All cycles
- 2024: R+40.3 2020: R+37.6 2016: R+36.8 2012: R+28.3 2008: R+32.7
Not yet ingested
- Civics
- —
Market trends
- HPI YoY
- ▲ 3.05%
- Current HPI
- 94.6697
- Rent YoY
- —
- Metro
- —
- State GDP YoY
- ▲ 3.29%
- F500 in state
- 10
Industry mix (Fortune 500 HQ in LA)
| Industry | F500 HQs | Revenue |
|---|---|---|
| Telecommunications | 2 | $23B |
|
||
| Utilities | 1 | $12B |
|
||
| Wholesale / Distribution | 1 | $5B |
|
||
| Advertising | 1 | $2B |
|
||
Price history
+415.2% since first listed7 events — show timeline
- 2026-06-11 Listed $85,000 GSREIN
- 2026-06-11 Listed $85,000 AcadianaMLS
- 2021-12-23 Listed $86,000 AcadianaMLS
- 2021-07-23 Sold (MLS) $12,000 GSREIN
- 2021-06-18 Pending — GSREIN
- 2021-03-26 Listed $16,500 GSREIN
- 2021-03-26 Listed $16,500 AcadianaMLS
Property tax history
-0.0%/yrLatest (2025): $153 · +0.4% YoY. Source: county tax records.
Cash-flow waterfall
monthlySold comps — $/sqft
last 12 mo · ≤1 miLoading sold comps…