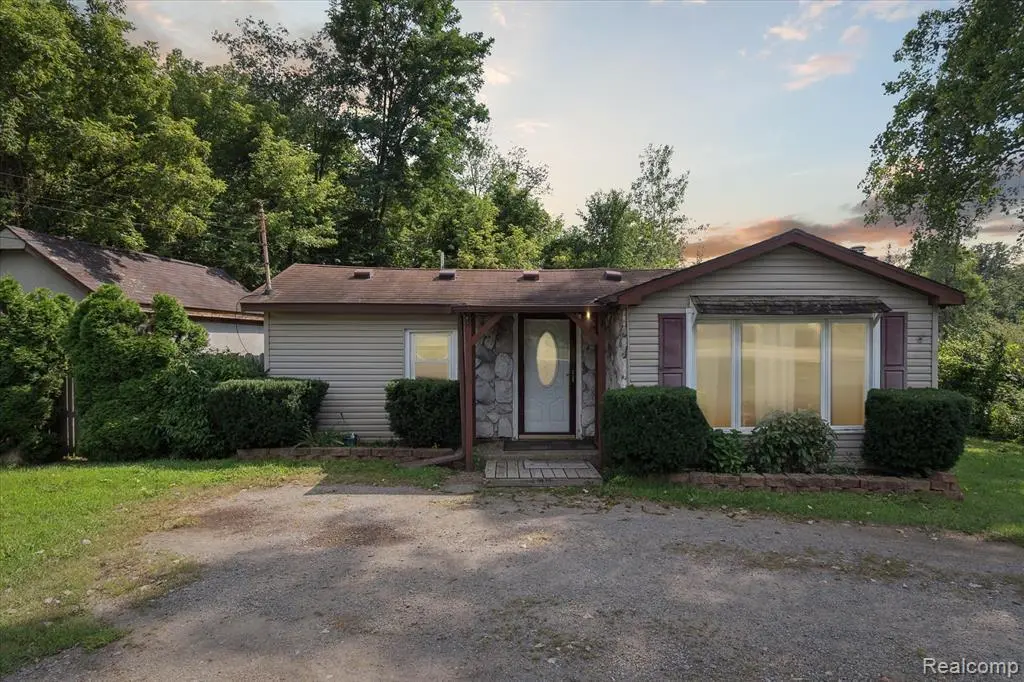
7801 E Michigan Ave · Michigan Center, MI
Flood risk 1/10 · Minimal
- FEMA flood zone
- X (unshaded)
- Chance of flooding over 30 yrs
- 0.0%
- Est. flood insurance / yr
- $473 – $860
Fire risk 3/10 · Minor
- Est. fire insurance / yr
- $784 – $1,456
Heat risk 2/10 · Minimal
- Hot days now (above 96°F)
- 7 days/yr
- Hot days in 30 yrs
- 15 days/yr
Wind risk 2/10 · Minimal
- Chance of severe wind over 30 yrs
- —
Air-quality risk 2/10 · Minimal
- Unhealthy air days now
- 1 days/yr
- Unhealthy air days in 30 yrs
- 2 days/yr
Risk factors via First Street. Map © Google.
Why this score? — see what drove the B grade
The composite is a weighted blend of 9 inputs, each scored 0–100. Each bar is that input's sub-score; the figure is the points it added to the 100-point composite (weight × sub-score).
- Cash flow +28.3/30.0
- ARV discount +15.0/15.0
- DSCR +10.0/10.0
- 1% rule +6.7/10.0
- Rent growth +5.0/5.0
- Livability +3.5/5.0
- Condition / age +2.5/5.0
- Schools +2.4/10.0
- Appreciation +0.0/10.0
$85,000
🖨 Deal sheet 📄 Offer letter ✓ Due diligence
Listing remarks MLS
* 24-hour notice for all showings * Charming 2-bedroom, 1-bath ranch just a 5-minute drive to Gillett's Lake, an all-sports lake perfect for boating, fishing, and water fun! This cozy home offers comfortable single-level living and great potential for a starter home, rental, or weekend getaway. Don't miss your chance to own near one of the area's most popular recreational spots!
Key facts
- Boating
- Water fun
- Gillett's lake
Tags
Property features AI
Exterior
- Parking: No garage
- Utilities: Private well water; Septic tank sewer
- Home design: Single-family residence; One level with ground-level entry
- Construction: Vinyl siding; Slab foundation
- Exterior features: Paved road access; Lot dimensions approximately 75 x 113 (0.26 acres)
Interior
- Bathrooms: 1 full bathroom
- Heating & cooling: Forced air heating (natural gas); No central cooling
- Interior features: Crawl space basement; 4 total rooms
Neighborhood map
What this means for you Summary
Snapshot
- This is a 2-bed/1.0-bath single-family listed at $85k.
Deal economics
- At list price, monthly cash flow is $273 ($3k/yr) — positive.
- The deal already cash-flows at list — no discount required.
- Meets the 1% rule at list price ($995 rent vs $85k).
- Recommended offer: $82k (3.0% below list) — sets the bar for market timing.
- Cap rate 10.1% vs local median 3.0% in Michigan Center — top-decile yield for the area; either an underpriced asset or a hidden risk that comps aren't pricing in. Stress-test before assuming the spread holds.
Location & tenants
- Location reads 70/100 on livability (#314 in MI) — a middle-class / working-renter tenant base. Strengths: cost of living A+, housing A+, crime A-; Watch: employment C-, schools F, amenities F.
- Michigan Center School District (suburban): math 19% / reading 37% proficiency, ranked #387 of 540 in MI (top 72%) — low school quality limits family demand, transient renter base, plan for 1-2y turnover.
- Market conditions: Rents rising fast (+10.3%/yr); 362 active listings in the ZIP; 317 units permitted in Jackson County in 2024 (103 in 5+ unit buildings).
- This rent is only 16% of the median local income ($74k/yr) — well below the 30% rent-burden line; pricing power to push rent on renewal without tenant pushback.
Forward outlook
- Local home prices are declining (-3.0%/yr); year-one equity from $588 of loan paydown is wiped out by about $3k of value loss. Plan a longer hold.
- Jackson County population projected at -13% by 2050 — secular population decline; favor cash flow + early exit over multi-decade hold.
- At projected returns (-3.0% appreciation + 8.0% rent growth), your $24k cash investment doubles in ~7 years — after that, you're playing with house money.
Negotiation context
- It's been on market 42 days — a 3% lower offer ($82k) is reasonable based on typical stale-listing flexibility.
- 6 sale attempts since 2y ago; this cycle's ask has dropped $5k (6%) from the opening price — seller is motivated, your offer sets the floor, not the list.
Risks & watch-outs
- Watch-outs: built in 1940 — expect roof / HVAC / electrical / plumbing capex.
Questions for the listing agent
- It's been on market 42 days. Have you received any prior offers? Is the seller open to a 3% concession, seller financing, or rate buy-down credit?
- Built in 1940 — when were the roof, HVAC, electrical panel, plumbing, and water heater last replaced?
- Is there a deadline driving the sale (1031 exchange, divorce, estate, relocation)? That informs how much negotiation room exists.
- Schools are F-rated, which usually means shorter tenancies and higher turnover. Who's the typical renter profile here, and what's been the actual vacancy rate?
- What's the average days-on-market for RENTAL listings here right now (not sales)? A rising rental-DOM trend means longer vacancies and softer asking-rent achievability than the comps imply.
- What's the recent tenant-quality profile in this submarket — average credit score on applications, eviction rate, late-payment / NSF rate, and stable-employment percentage? A property-management company in the area should have these aggregated.
- How much new for-sale + rental construction is in the pipeline within 1–3 miles? Heavy new supply typically softens prices + rents 12–24 months out; constrained supply supports both.
Investment metrics
- 1% rule
- 1.17% ✓
- Cap rate
- 10.14%
- Cash-on-cash
- 13.75%
- DSCR
- 1.61
- GRM
- 7.1
CMA / ARV
- ARV (median comp)
- $166,994
- List price
- $85,000
- Delta
- -49.10%
- Verdict
- UNDERPRICED
- Comps
- 6 within 2.0 mi
Show comp detail 1 sale within ~0.75 mi
| Address | Dist | Beds/Ba | Sqft | Sold | Price | $/sf | Match |
|---|---|---|---|---|---|---|---|
| 205 N Wrenwood Ave | 0.50mi | 2/1.0 | 768 (+6%) | 22mo | $178,500 | $232 | 47 |
Match score weights: distance 35% · size 25% · config 20% · recency 20%. Top-matched comps best support the ARV.
Projected returns pro-forma
-3.0% appreciation · 8.0% rent growth · sell at horizon
- IRR
- 9.0%
- Equity multiple
- 1.37×
- Total profit
- $8,831
- Equity at exit
- $12,674
- IRR
- 21.7%
- Equity multiple
- 3.26×
- Total profit
- $53,880
- Equity at exit
- $7,349
Cash invested: $23,800 (down + closing). Projections, not guarantees.
Landlord ↔ Tenant lean methodology
- Overall (STATE)
- 62 Landlord-Friendly
- State Michigan
- 62 Landlord-Friendly · EVEN
- County
- — inherits STATE
- City
- — inherits STATE
ZIP-level market 49201
- Rents YoY
- 10.3%
- Active inventory
- 362
- Price-to-rent
- 7.1×
Monthly cashflow live
- Estimated rent
- $995 medium interval (Pro) →
- Mortgage (P&I)
- −$446
- Tax from tax record
- −$32 /mo · $388/yr
- Insurance
- −$35
- HOA
- −$0
- Vacancy / Maint / Mgmt
- −$209
- Net cashflow
- $273
Break-even live
UW: 25.0% down · 7.5% · 30yr · 1.5% tax · 5.0% vac · 8.0% maint · 8.0% mgmt
Financing live
Cash to close
- Down payment
- $21,250
- Closing costs
- $2,550
- Reserves months
- —
- Total cash needed
- —
Loan-product check · same deal, 3 products live
Conventional
25% down · 7.5% · 30yr
- Down + closing
- —
- Monthly P&I
- —
- Monthly cashflow
- —
- DSCR
- —
- Eligible?
- —
Personal DTI + credit; lowest rate.
DSCR
20% down · 8.5% · 30yr
- Down + closing
- —
- Monthly P&I
- —
- Monthly cashflow
- —
- DSCR
- —
- Eligible?
- —
No personal income docs; deal must DSCR.
Hard money
10% down · 12.0% · 12mo
- Down + closing
- —
- Monthly P&I
- —
- Monthly cashflow
- —
- DSCR
- —
- Eligible?
- —
Short-term bridge; refi at stabilization.
Listing history 39 events
-
2026-06-19days on market $85,000 Active 42 DOM
-
2026-06-18days on market $85,000 Active 41 DOM
-
2026-06-17days on market $85,000 Active 40 DOM
-
2026-06-16days on market $85,000 Active 39 DOM
-
2026-06-15days on market $85,000 Active 38 DOM
-
2026-06-14days on market $85,000 Active 36 DOM
-
2026-06-13days on market $85,000 Active 35 DOM
-
2026-06-10days on market $85,000 Active 33 DOM
-
2026-06-09days on market $85,000 Active 32 DOM
-
2026-06-08days on market $85,000 Active 31 DOM
-
2026-06-07days on market $85,000 Active 30 DOM
-
2026-06-02days on market $85,000 Active 25 DOM
-
2026-06-01days on market $85,000 Active 24 DOM
Show marketing remark (382 chars)
* 24-hour notice for all showings * Charming 2-bedroom, 1-bath ranch just a 5-minute drive to Gillett's Lake, an all-sports lake perfect for boating, fishing, and water fun! This cozy home offers comfortable single-level living and great potential for a starter home, rental, or weekend getaway. Don't miss your chance to own near one of the area's most popular recreational spots!
-
2026-06-01price $85,000 Active 23 DOM
Show marketing remark (382 chars)
* 24-hour notice for all showings * Charming 2-bedroom, 1-bath ranch just a 5-minute drive to Gillett's Lake, an all-sports lake perfect for boating, fishing, and water fun! This cozy home offers comfortable single-level living and great potential for a starter home, rental, or weekend getaway. Don't miss your chance to own near one of the area's most popular recreational spots!
-
2026-05-31days on market $90,000 Active 23 DOM
-
2026-05-30days on market $90,000 Active 22 DOM
-
2026-05-08$90,000 Active 400-char remark
Show marketing remark (382 chars)
* 24-hour notice for all showings * Charming 2-bedroom, 1-bath ranch just a 5-minute drive to Gillett's Lake, an all-sports lake perfect for boating, fishing, and water fun! This cozy home offers comfortable single-level living and great potential for a starter home, rental, or weekend getaway. Don't miss your chance to own near one of the area's most popular recreational spots!
-
2026-05-08$90,000 Active 382-char remark
Show marketing remark (382 chars)
* 24-hour notice for all showings * Charming 2-bedroom, 1-bath ranch just a 5-minute drive to Gillett's Lake, an all-sports lake perfect for boating, fishing, and water fun! This cozy home offers comfortable single-level living and great potential for a starter home, rental, or weekend getaway. Don't miss your chance to own near one of the area's most popular recreational spots!
-
2026-02-15historical
-
2026-02-15historical
-
2025-10-22price $90,000
-
2025-10-22price $90,000
-
2025-09-12price $99,000
-
2025-09-11price $99,000
-
2025-08-14$105,000 Active
-
2025-08-14$105,000 Active
-
2025-01-18historical
-
2025-01-17historical
-
2024-11-06price $100,000
-
2024-11-06price $100,000
-
2024-11-06price $100,000
-
2024-10-15price $105,000
-
2024-10-15price $105,000
-
2024-10-15price $105,000
-
2024-10-04price $110,000
-
2024-10-03price $110,000
-
2024-10-03price $110,000
-
2024-09-28$120,000 Active
-
2024-09-28$120,000 Active
ⓘ Source: listings_history table (triggers on properties + properties_extension) + one-shot
backfill from property_details.listing_events for pre-trigger history.
Tax reassessment forecast MI · Partial reset (capped growth)
- Current annual tax
- $388 · $32/mo
- Projected year-2 tax
- $849 · $71/mo
- Expected delta
- +$460/yr (+$38/mo · 118.5%)
ⓘ Screening estimate from a state-policy table — verify with the county assessor before closing.
Climate risk First Street
- Flood 1/10 Low FEMA zone X (unshaded) · 0% chance over 30 yrs
- Wildfire 3/10 Moderate
- Heat 2/10 Low 7 d/yr ≥96°F today · 15 d/yr by 30 yrs out
- Wind 2/10 Low
- Air quality 2/10 Low 1 unhealthy d/yr today · 2 by 30 yrs out
Nearby sold comps map
Loading sold comps map…
Walkable amenities ~0.75 mi
Loading nearby amenities…
Taxation est. · year 1
- Rental income
- $11,944
- − Mortgage interest
- −$4,761
- − Property taxes
- −$388
- − Insurance
- −$425
- − Repairs & maintenance
- −$956
- − Management
- −$956
- − Depreciation
- −$2,473
- Taxable income
- $1,986
- Est. tax owed @ 24.0%
- −$477
- After-tax cash flow
- $2,797/yr
For passive investors: Depreciation is non-cash, so a rental often shows a tax loss while cash-flowing — sheltering income. Rental losses are passive: they offset passive income freely, and up to $25,000/yr can offset ordinary (W-2) income if you actively participate and your MAGI is under $100k (phasing out to $0 by $150k); unused losses carry forward. On sale, claimed depreciation is recaptured at up to 25%, and gains may owe capital-gains tax (a 1031 exchange can defer both). Figures are a year-1 estimate at your 24.0% rate — not tax advice; consult a CPA.
Schools (NCES district)
- District
- Michigan Center School District
- NCES district ID
- 2623790
- Math proficiency
- 19% ▼ -13.00%
- Reading proficiency
- 37% ▼ -6.00%
- Median HH income
- $46,224
- Composite
- 24.11/100
- National rank
- #7753
- State rank
- #387 of 540 in MI
Livability — Michigan Center
- Score
- 70/100
- State rank
- #314
- US rank
- #7697
Category grades
Schools grade is shown separately in the Schools card above.
Census & demographics
- County
- Jackson County · 85,581 people
- City population
- 3,617
- Metro
- Jackson, MI
- Population (ZIP)
- 49,107
- Household income
- $74,484
- Rent vs Own
- Severe rent burden
- 840.0
Population outlook (Jackson County) Hauer SSP2
- Today (2025)
- 156,365 people
- By 2030
- 153,123 · -2.1%
- By 2040
- 144,981 · -7.3%
- By 2050
- 135,671 · -13.2%
- By 2075
- 113,833 · -27.2%
- By 2100
- 86,592 · -44.6%
Race, ethnicity, and origin ACS 2023
- Neighborhood character
- Predominantly White (80%)
- Race & ethnicity
- White 80% Black 9% Two or more races 6% Hispanic / Latino 5%
- Hispanic origin (detail)
- Mexican 4%
- Common ancestry
- Romanian 7% Lithuanian 3% Slovak 2%
- Foreign-born
- 3% · Canada
- Languages at home
- 96% English-only · Spanish 2% Other Indo-European 1% Russian/Polish/Slavic 1%
Political lean MEDSL · Jackson
- 2024 margin
- Strong R (+21.3) · D 38.6% · R 59.9% · Other 1.5%
- 2008→2024 swing
- -23.7pp toward R · 2008: 2.4pp · 2024: -21.3pp
- All cycles
- 2024: R+21.3 2020: R+19.0 2016: R+20.1 2012: R+5.8 2008: D+2.4
Not yet ingested
- Civics
- —
Market trends
- HPI YoY
- ▼ -198.89%
- Current HPI
- 185.3773
- Rent YoY
- ▲ 10.32%
- Metro
- Jackson, MI
- State GDP YoY
- ▲ 1.37%
- F500 in state
- 28
Industry mix (Fortune 500 HQ in MI)
| Industry | F500 HQs | Revenue |
|---|---|---|
| Automotive Parts | 3 | $48B |
|
||
| Automotive | 2 | $372B |
|
||
| Chemicals | 1 | $45B |
|
||
| Automotive Retail | 1 | $29B |
|
||
| Healthcare / Medical Devices | 1 | $23B |
|
||
| Automotive Technology | 1 | $20B |
|
||
Price history
-29.2% since first listed25 events — show timeline
- 2026-06-01 Price Changed $85,000 MiRealSource-MiMLS
- 2026-05-31 Price Changed $85,000 REALCOMP
- 2026-05-08 Listed $90,000 REALCOMP
- 2026-05-08 Listed $90,000 MiRealSource-MiMLS
- 2026-02-15 Listing Removed — REALCOMP
- 2026-02-15 Listing Removed — MiRealSource-MiMLS
- 2025-10-22 Price Changed $90,000 MiRealSource-MiMLS
- 2025-10-22 Price Changed $90,000 REALCOMP
- 2025-09-12 Price Changed $99,000 MiRealSource-MiMLS
- 2025-09-11 Price Changed $99,000 REALCOMP
- 2025-08-14 Listed $105,000 MiRealSource-MiMLS
- 2025-08-14 Listed $105,000 REALCOMP
- 2025-01-18 Listing Removed — REALCOMP
- 2025-01-17 Listing Removed — MiRealSource-MiMLS
- 2024-11-06 Price Changed $100,000 MiRealSource-MiMLS
- 2024-11-06 Price Changed $100,000 REALCOMP
- 2024-11-06 Price Changed $100,000 SW Michigan MLS
- 2024-10-15 Price Changed $105,000 MiRealSource-MiMLS
- 2024-10-15 Price Changed $105,000 REALCOMP
- 2024-10-15 Price Changed $105,000 SW Michigan MLS
- 2024-10-04 Price Changed $110,000 MiRealSource-MiMLS
- 2024-10-03 Price Changed $110,000 REALCOMP
- 2024-10-03 Price Changed $110,000 SW Michigan MLS
- 2024-09-28 Listed $120,000 MiRealSource-MiMLS
- 2024-09-28 Listed $120,000 REALCOMP
Property tax history
+4.5%/yrLatest (2025): $388 · +3.2% YoY. Source: county tax records.
Cash-flow waterfall
monthlySold comps — $/sqft
last 12 mo · ≤1 miLoading sold comps…