 Triplex
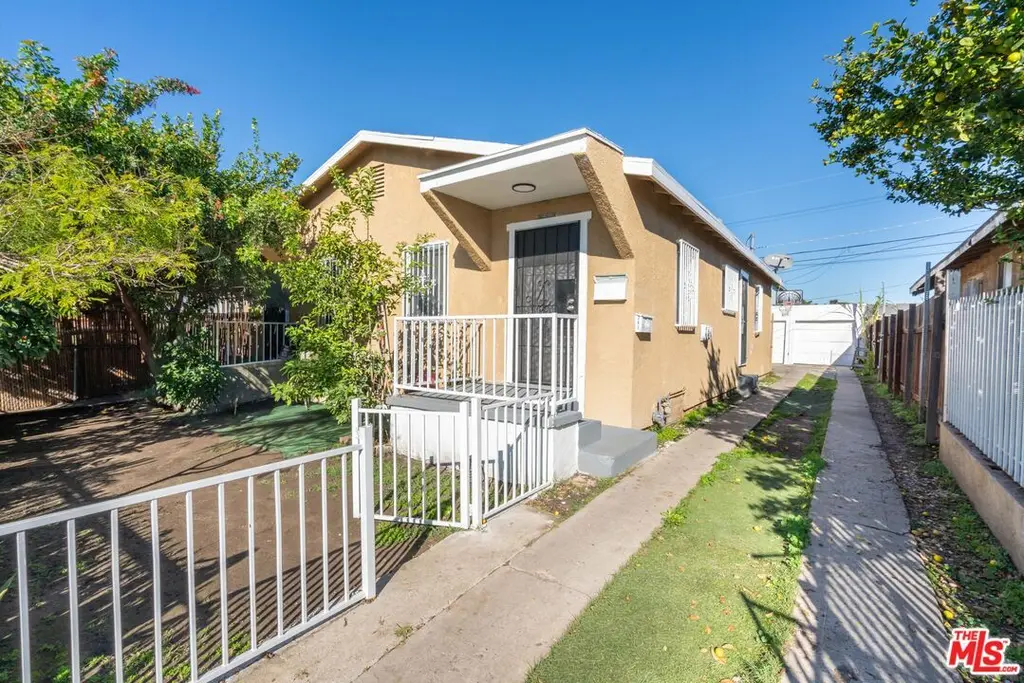
341 E 71st St · Los Angeles, CA
Flood risk 1/10 · Minimal
- FEMA flood zone
- X (unshaded)
- Chance of flooding over 30 yrs
- 0.0%
- Est. flood insurance / yr
- $507 – $1,088
Fire risk 1/10 · Minimal
- Est. fire insurance / yr
- $659 – $1,223
Heat risk 6/10 · Moderate
- Hot days now (above 88°F)
- 7 days/yr
- Hot days in 30 yrs
- 22 days/yr
Wind risk 1/10 · Minimal
- Chance of severe wind over 30 yrs
- —
Air-quality risk 5/10 · Moderate
- Unhealthy air days now
- 7 days/yr
- Unhealthy air days in 30 yrs
- 7 days/yr
Risk factors via First Street. Map © Google.
Why this score? — see what drove the D+ grade
The composite is a weighted blend of 9 inputs, each scored 0–100. Each bar is that input's sub-score; the figure is the points it added to the 100-point composite (weight × sub-score).
- Cash flow +17.1/30.0
- ARV discount +7.5/15.0
- DSCR +5.3/10.0
- 1% rule +3.9/10.0
- Schools +3.6/10.0
- Livability +3.4/5.0
- Rent growth +2.5/5.0
- Condition / age +2.5/5.0
- Appreciation +0.0/10.0
$799,000
🖨 Deal sheet 📄 Offer letter ✓ Due diligence
Multi-family units
County records classify this as Multi-Family (2-4 Unit). Listing-text estimate: 3 units. confirmed
Listing remarks MLS
TRIPLEX IN MID-LOS ANGELS AREA. OLDER BUILDINGS, CONDITION VARIES FROM UNIT TO UNIT. SOLD AS IS WITHOUT WARRANTY OR REPAIR. UNIT SIZE AND ROOM COUNT IS AS FOLLOWS; UNIT #1 - 1 BR / 1 BA - 720 SF; UNIT #2 - 2 BR / 1 BA - 600SF; UNIT #3 - 2 BR 1 BA - 836 SF.
Key facts
- Detached garage
- 4,497 sq ft lot
- Parking
Tags
Property features AI
Finance
- Other: Property identified as residential income; Owner pays water utility
- Financial info: Gross scheduled income shown as $60,600; Gross income listed as 2850 (period not specified); Net operating income listed as $18,600; Total annual expenses listed as $1,550; Insurance expense listed as $500; Tax expense listed as $750; Water expense listed as $300; Vacancy rate listed as 1%; Units have a mix of actual and projected rents (actual rents shown for some units)
- HOA & community: Total of 3 units in the complex; 2 buildings on the parcel
Exterior
- Parking: Driveway parking
- Utilities: Water service included (owner pays); Sewer and power not specified
- Home design: Residential income property; Multi-level
- Construction: Zoning: LAR2
- Exterior features: No additional structures
Interior
- Bedrooms: Unit mix includes 2-bedroom units (multiple units)
- Bathrooms: Each listed unit has 1 bathroom
- Heating & cooling: Other heating; Other cooling
- Interior features: Multi-level layout
- Laundry & utility: Water heaters present; Owner pays water
Neighborhood map
What this means for you Summary
Snapshot
- This is a 3 × 2-bed/1.0-bath units multifamily listed at $799k.
Deal economics
- At list price, monthly cash flow is $551 ($7k/yr) — positive. Per door: $184/mo.
- The deal already cash-flows at list — no discount required.
- To meet the 1% rule (rent ≥ 1% of price), the offer needs to be $710k (11.1% below list).
- Recommended offer: $710k (11.1% below list) — sets the bar for 1% rule.
- Cap rate 7.1% vs local median 2.1% in Los Angeles — top-decile yield for the area; either an underpriced asset or a hidden risk that comps aren't pricing in. Stress-test before assuming the spread holds.
Location & tenants
- Location reads 68/100 on livability (#273 in CA) — a middle-class / working-renter tenant base. Strengths: amenities A+, commute A+, employment B; Watch: health & safety C-, schools D+, crime F.
- Los Angeles Unified (urban): math 29% / reading 54% proficiency, ranked #223 of 517 in CA (top 43%) — families likely to look elsewhere, expect single-tenant / working-renter base with shorter leases; 67% free/reduced lunch — lower-income household profile, screen leases tightly.
- Market conditions: Rents flat; 161 active listings in the ZIP; 40 comparable units currently listed for rent nearby; rentals at typical pace (median 25d on market — plan ~3-4 weeks tenant-placement turnaround); 19,697 units permitted in Los Angeles County in 2024 (9,426 in 5+ unit buildings).
- At $7,105/mo this rent would consume 152% of the median local household income ($56k/yr) (locally 4550% of renters already pay >50% of income on rent) — very limited rent-growth headroom before tenants either downsize or default.
Forward outlook
- Local home prices are declining (-3.0%/yr); year-one equity from $6k of loan paydown is wiped out by about $24k of value loss. Plan a longer hold.
- Los Angeles County population projected at +9% by 2050 — modest demand growth; plan on rents tracking national, not racing it.
Negotiation context
- It's been on market 21 days — a 2% lower offer ($787k) is reasonable based on typical stale-listing flexibility.
- 7 sale attempts since 23y ago with the ask held roughly flat each time — persistent listings suggest the price (not the market) is what's stuck; bring a comps-based counter.
- Current owner paid $440k; list at $799k implies a 82% gain — meaningful room to come down on a strong offer.
Risks & watch-outs
- Watch-outs: built in 1931 — expect roof / HVAC / electrical / plumbing capex.
- Climate carrying-cost: extreme-heat days projected 7→22/yr by 2055 (HVAC capex compounding) — expect insurance premiums to compound above CPI over the hold.
Questions for the listing agent
- Can we see the unit-by-unit rent roll, current vacancy, and any below-market leases? What's the average tenancy length?
- What capital expenditures (roof, boiler, parking lot, exteriors) have been made in the last 5 years, and what's planned in the next 2?
- Built in 1931 — when were the roof, HVAC, electrical panel, plumbing, and water heater last replaced?
- Is there a deadline driving the sale (1031 exchange, divorce, estate, relocation)? That informs how much negotiation room exists.
- Schools are D-rated, which usually means shorter tenancies and higher turnover. Who's the typical renter profile here, and what's been the actual vacancy rate?
- Crime grade is F in this area — have there been break-ins, vandalism, or insurance claims at this property in the last 3 years? What carrier currently insures it and at what premium?
- The area grade is low — what's the realistic commute time and amenity access for the typical tenant pool here? Any planned neighborhood developments (good or bad) we should know about?
- What's the average days-on-market for RENTAL listings here right now (not sales)? A rising rental-DOM trend means longer vacancies and softer asking-rent achievability than the comps imply.
- What's the recent tenant-quality profile in this submarket — average credit score on applications, eviction rate, late-payment / NSF rate, and stable-employment percentage? A property-management company in the area should have these aggregated.
- How much new apartment / multifamily construction is in the pipeline within 1–3 miles? Heavy new supply (>2% of stock underway) typically softens rents 12–24 months out; light construction supports rent growth.
Investment metrics
- 1% rule
- 0.89% ✗
- Cap rate
- 7.12%
- Cash-on-cash
- 2.96%
- DSCR
- 1.13
- GRM
- 9.4
CMA / ARV
No comps found within radius.
Projected returns pro-forma
-3.0% appreciation · 0.11% rent growth · sell at horizon
- IRR
- -14.7%
- Equity multiple
- 0.49×
- Total profit
- $-114,620
- Equity at exit
- $119,133
- IRR
- -11.3%
- Equity multiple
- 0.41×
- Total profit
- $-133,086
- Equity at exit
- $69,083
Cash invested: $223,720 (down + closing). Projections, not guarantees.
Landlord ↔ Tenant lean methodology
- Overall (CITY)
- 0 Strongly Tenant-Friendly
- State California
- 18 Strongly Tenant-Friendly · D+13
- County
- — inherits STATE
- City Los Angeles
- 0 Strongly Tenant-Friendly · D+22
ZIP-level market 90003
- Rents YoY
- 0.1%
- Active inventory
- 161
- Price-to-rent
- 28.1×
Monthly cashflow live
- Estimated rent
- $7,105 high interval (Pro) →
- Mortgage (P&I)
- −$4,190
- Tax from tax record
- −$539 /mo · $6,465/yr
- Insurance
- −$333
- HOA
- −$0
- Vacancy / Maint / Mgmt
- −$1,492
- Net cashflow
- $551
Break-even live
3-unit breakdown (identical units grouped — click to expand)
| Units | Beds | Baths | Est. rent |
|---|---|---|---|
| 3× units | 2 | 1 | $7,104 |
| #1 | 2 | 1 | $2,368 |
| #2 | 2 | 1 | $2,368 |
| #3 | 2 | 1 | $2,368 |
| Total (3 units) | $7,105 | ||
UW: 25.0% down · 7.5% · 30yr · 1.5% tax · 5.0% vac · 8.0% maint · 8.0% mgmt
Financing live
Cash to close
- Down payment
- $199,750
- Closing costs
- $23,970
- Reserves months
- —
- Total cash needed
- —
Loan-product check · same deal, 3 products live
Conventional
25% down · 7.5% · 30yr
- Down + closing
- —
- Monthly P&I
- —
- Monthly cashflow
- —
- DSCR
- —
- Eligible?
- —
Personal DTI + credit; lowest rate.
DSCR
20% down · 8.5% · 30yr
- Down + closing
- —
- Monthly P&I
- —
- Monthly cashflow
- —
- DSCR
- —
- Eligible?
- —
No personal income docs; deal must DSCR.
Hard money
10% down · 12.0% · 12mo
- Down + closing
- —
- Monthly P&I
- —
- Monthly cashflow
- —
- DSCR
- —
- Eligible?
- —
Short-term bridge; refi at stabilization.
Rent comps 40 comps
| Address | Beds | Baths | Sqft | Rent | $/sqft | DOM | Units | Dist |
|---|---|---|---|---|---|---|---|---|
| 6517 Avalon Blvd Unit 4 Los Angeles, CA | — | 1.0 | 450 | $1,500 | $3.33 | 24d | 1 | 0.32mi |
| 6515 Avalon Blvd Unit 6517 Los Angeles, CA | — | 1.0 | 450 | $1,500 | $3.33 | 24d | 1 | 0.32mi |
| 6914 1/2 Main St Los Angeles, CA | — | 1.0 | 700 | $1,950 | $2.79 | 7d | 1 | 0.33mi |
| 239 E 65th St Los Angeles, CA | 2.0 | 1.0 | 600 | $2,400 | $4.00 | 7d | 1 | 0.36mi |
| 7418 S Main St #6 Los Angeles, CA | 2.0 | 1.0 | 450 | $1,999 | $4.44 | 7d | 1 | 0.41mi |
| 100 E 66th St Los Angeles, CA | 1.0 | 1.0 | 580 | $1,675 | $2.89 | 24d | 1 | 0.41mi |
| 107 E 65th St Apt 3 Los Angeles, CA | 1.0 | 1.0 | 470 | $1,795 | $3.82 | 24d | 1 | 0.46mi |
| 7718 Avalon Blvd Unit 7718-5 Los Angeles, CA | 2.0 | 1.0 | 613 | $2,095 | $3.42 | 24d | 1 | 0.53mi |
| 202 E 78th St Los Angeles, CA | 1.0 | 1.0 | 550 | $2,250 | $4.09 | 24d | 1 | 0.56mi |
| 7833 Towne Ave Los Angeles, CA | 2.0 | 1.0 | 700 | $2,325 | $3.32 | 24d | 1 | 0.56mi |
| 252 E 79th St Los Angeles, CA | 2.0 | 1.0 | 650 | $2,887 | $4.44 | 24d | 1 | 0.58mi |
| 7311 S Broadway Unit 100 Los Angeles, CA | 1.0 | 1.0 | 367 | $2,100 | $5.72 | 43d | 1 | 0.64mi |
| 7924 S Main St Los Angeles, CA | 2.0 | 1.0 | 580 | $2,265 | $3.91 | 18d | 1 | 0.69mi |
| 443 W Florence Ave Unit 445 Los Angeles, CA | 1.0 | 1.0 | 358 | $1,423 | $3.97 | 22d | 1 | 0.81mi |
| 445 W Florence Ave Los Angeles, CA | 1.0 | 1.0 | 255 | $1,423 | $5.57 | 43d | 3 | 0.81mi |
| 227 E 84th St Los Angeles, CA | 1.0 | 1.0 | 378 | $1,800 | $4.76 | 24d | 1 | 0.91mi |
| 533 W 75th St Unit 3 Los Angeles, CA | 1.0 | 1.0 | 600 | $2,298 | $3.83 | 43d | 1 | 0.95mi |
| 533 W 75th St Unit 3 Los Angeles, CA | 1.0 | 1.0 | 600 | $2,298 | $3.83 | 7d | 1 | 0.95mi |
| 7302 Mace Pl Unit A Los Angeles, CA | 1.0 | 1.0 | 420 | $1,850 | $4.40 | 24d | 1 | 0.98mi |
| 521 1/2 W 78th St Los Angeles, CA | 2.0 | 1.0 | 600 | $2,100 | $3.50 | 43d | 1 | 1.02mi |
| 8464 Avalon Blvd Unit 6 Los Angeles, CA | 2.0 | 1.0 | 680 | $2,350 | $3.46 | 43d | 1 | 1.02mi |
| 456 W 59th Pl Los Angeles, CA | — | 1.0 | 400 | $1,500 | $3.75 | 43d | 1 | 1.04mi |
| 8472 Main St Unit 8476 1/2 Los Angeles, CA | — | 1.0 | 400 | $1,350 | $3.38 | 24d | 1 | 1.07mi |
| 7524 S Hoover St Los Angeles, CA | 1.0 | 1.0 | 371 | $1,556 | $4.19 | 3d | 2 | 1.14mi |
| 832 W Florence Ave Apt 7 Los Angeles, CA | — | 1.0 | 420 | $1,520 | $3.62 | 43d | 1 | 1.17mi |
| 832 W Florence Ave Unit 2 Los Angeles, CA | 1.0 | 1.0 | 570 | $1,850 | $3.25 | 43d | 1 | 1.17mi |
| 1364 E 61st St Los Angeles, CA | 2.0 | 1.0 | 700 | $2,500 | $3.57 | 24d | 1 | 1.17mi |
| 626 W 59th Pl Los Angeles, CA | 2.0 | 1.0 | 680 | $2,400 | $3.53 | 43d | 1 | 1.18mi |
| 622 W 59th Pl Los Angeles, CA | 2.0 | 1.0 | 680 | $2,300 | $3.38 | 43d | 1 | 1.18mi |
| 1319 E 59th Pl Los Angeles, CA | 1.0 | 1.0 | 400 | $1,600 | $4.00 | 24d | 1 | 1.19mi |
| 612 E 87th St Los Angeles, CA | 2.0 | 1.0 | 750 | $2,250 | $3.00 | 7d | 1 | 1.19mi |
| 7800 S Hoover St Los Angeles, CA | 2.0 | 1.0 | 680 | $2,400 | $3.53 | 43d | 1 | 1.20mi |
| 5600 S Broadway Unit 4 Los Angeles, CA | 1.0 | 1.0 | 410 | $1,800 | $4.39 | 43d | 1 | 1.20mi |
| 8330 S Figueroa St Unit 457 Los Angeles, CA | 1.0 | 1.0 | 450 | $1,375 | $3.06 | 43d | 1 | 1.20mi |
| 612 W 81st St Unit 7 Los Angeles, CA | 2.0 | 1.0 | 700 | $2,200 | $3.14 | 7d | 1 | 1.21mi |
| 5862 1/2 Denver Ave Unit 5846 Los Angeles, CA | 2.0 | 1.0 | 600 | $2,400 | $4.00 | 7d | 1 | 1.22mi |
| 5862 1/2 Denver Ave Los Angeles, CA | 2.0 | 1.0 | 600 | $2,400 | $4.00 | 43d | 1 | 1.22mi |
| 507 W 83rd St Unit 214 Los Angeles, CA | 1.0 | 1.0 | 636 | $1,800 | $2.83 | 7d | 1 | 1.23mi |
| 810 W 62nd St Unit 4 Los Angeles, CA | 1.0 | 1.0 | 546 | $1,890 | $3.46 | 2d | 1 | 1.24mi |
| 5842 Denver Ave Los Angeles, CA | 2.0 | 1.0 | 600 | $2,400 | $4.00 | 43d | 1 | 1.24mi |
Listing history 36 events
-
2026-06-18days on market $799,000 Active 21 DOM
-
2026-06-17days on market $799,000 Active 20 DOM
-
2026-06-16days on market $799,000 Active 19 DOM
-
2026-06-15days on market $799,000 Active 18 DOM
-
2026-06-13days on market $799,000 Active 16 DOM
-
2026-06-09days on market $799,000 Active 12 DOM
-
2026-06-08days on market $799,000 Active 11 DOM
-
2026-06-07days on market $799,000 Active 10 DOM
-
2026-06-04days on market $799,000 Active 7 DOM
-
2026-06-03days on market $799,000 Active 6 DOM
-
2026-06-02days on market $799,000 Active 5 DOM
-
2026-06-01days on market $799,000 Active 4 DOM
-
2026-05-31days on market $799,000 Active 3 DOM
-
2026-05-26$799,000 Active
-
2016-12-27soldstatus $440,000
-
2010-05-10soldstatus $200,000 Closed 256-char remark
Show marketing remark (256 chars)
TRIPLEX IN MID-LOS ANGELS AREA. OLDER BUILDINGS, CONDITION VARIES FROM UNIT TO UNIT. SOLD AS IS WITHOUT WARRANTY OR REPAIR. UNIT SIZE AND ROOM COUNT IS AS FOLLOWS; UNIT #1 - 1 BR / 1 BA - 720 SF; UNIT #2 - 2 BR / 1 BA - 600SF; UNIT #3 - 2 BR 1 BA - 836 SF.
-
2009-12-16status Pending 256-char remark
Show marketing remark (256 chars)
TRIPLEX IN MID-LOS ANGELS AREA. OLDER BUILDINGS, CONDITION VARIES FROM UNIT TO UNIT. SOLD AS IS WITHOUT WARRANTY OR REPAIR. UNIT SIZE AND ROOM COUNT IS AS FOLLOWS; UNIT #1 - 1 BR / 1 BA - 720 SF; UNIT #2 - 2 BR / 1 BA - 600SF; UNIT #3 - 2 BR 1 BA - 836 SF.
-
2009-12-08status Active 256-char remark
Show marketing remark (256 chars)
TRIPLEX IN MID-LOS ANGELS AREA. OLDER BUILDINGS, CONDITION VARIES FROM UNIT TO UNIT. SOLD AS IS WITHOUT WARRANTY OR REPAIR. UNIT SIZE AND ROOM COUNT IS AS FOLLOWS; UNIT #1 - 1 BR / 1 BA - 720 SF; UNIT #2 - 2 BR / 1 BA - 600SF; UNIT #3 - 2 BR 1 BA - 836 SF.
-
2009-10-24status Pending 256-char remark
Show marketing remark (256 chars)
TRIPLEX IN MID-LOS ANGELS AREA. OLDER BUILDINGS, CONDITION VARIES FROM UNIT TO UNIT. SOLD AS IS WITHOUT WARRANTY OR REPAIR. UNIT SIZE AND ROOM COUNT IS AS FOLLOWS; UNIT #1 - 1 BR / 1 BA - 720 SF; UNIT #2 - 2 BR / 1 BA - 600SF; UNIT #3 - 2 BR 1 BA - 836 SF.
-
2009-06-25historical 256-char remark
Show marketing remark (256 chars)
TRIPLEX IN MID-LOS ANGELS AREA. OLDER BUILDINGS, CONDITION VARIES FROM UNIT TO UNIT. SOLD AS IS WITHOUT WARRANTY OR REPAIR. UNIT SIZE AND ROOM COUNT IS AS FOLLOWS; UNIT #1 - 1 BR / 1 BA - 720 SF; UNIT #2 - 2 BR / 1 BA - 600SF; UNIT #3 - 2 BR 1 BA - 836 SF.
-
2009-06-08price $240,500 256-char remark
Show marketing remark (256 chars)
TRIPLEX IN MID-LOS ANGELS AREA. OLDER BUILDINGS, CONDITION VARIES FROM UNIT TO UNIT. SOLD AS IS WITHOUT WARRANTY OR REPAIR. UNIT SIZE AND ROOM COUNT IS AS FOLLOWS; UNIT #1 - 1 BR / 1 BA - 720 SF; UNIT #2 - 2 BR / 1 BA - 600SF; UNIT #3 - 2 BR 1 BA - 836 SF.
-
2009-06-08status 256-char remark
Show marketing remark (256 chars)
TRIPLEX IN MID-LOS ANGELS AREA. OLDER BUILDINGS, CONDITION VARIES FROM UNIT TO UNIT. SOLD AS IS WITHOUT WARRANTY OR REPAIR. UNIT SIZE AND ROOM COUNT IS AS FOLLOWS; UNIT #1 - 1 BR / 1 BA - 720 SF; UNIT #2 - 2 BR / 1 BA - 600SF; UNIT #3 - 2 BR 1 BA - 836 SF.
-
2009-05-16historical 256-char remark
Show marketing remark (256 chars)
TRIPLEX IN MID-LOS ANGELS AREA. OLDER BUILDINGS, CONDITION VARIES FROM UNIT TO UNIT. SOLD AS IS WITHOUT WARRANTY OR REPAIR. UNIT SIZE AND ROOM COUNT IS AS FOLLOWS; UNIT #1 - 1 BR / 1 BA - 720 SF; UNIT #2 - 2 BR / 1 BA - 600SF; UNIT #3 - 2 BR 1 BA - 836 SF.
-
2009-03-09price $249,900 256-char remark
Show marketing remark (256 chars)
TRIPLEX IN MID-LOS ANGELS AREA. OLDER BUILDINGS, CONDITION VARIES FROM UNIT TO UNIT. SOLD AS IS WITHOUT WARRANTY OR REPAIR. UNIT SIZE AND ROOM COUNT IS AS FOLLOWS; UNIT #1 - 1 BR / 1 BA - 720 SF; UNIT #2 - 2 BR / 1 BA - 600SF; UNIT #3 - 2 BR 1 BA - 836 SF.
-
2009-02-25status 256-char remark
Show marketing remark (256 chars)
TRIPLEX IN MID-LOS ANGELS AREA. OLDER BUILDINGS, CONDITION VARIES FROM UNIT TO UNIT. SOLD AS IS WITHOUT WARRANTY OR REPAIR. UNIT SIZE AND ROOM COUNT IS AS FOLLOWS; UNIT #1 - 1 BR / 1 BA - 720 SF; UNIT #2 - 2 BR / 1 BA - 600SF; UNIT #3 - 2 BR 1 BA - 836 SF.
-
2009-02-22historical 256-char remark
Show marketing remark (256 chars)
TRIPLEX IN MID-LOS ANGELS AREA. OLDER BUILDINGS, CONDITION VARIES FROM UNIT TO UNIT. SOLD AS IS WITHOUT WARRANTY OR REPAIR. UNIT SIZE AND ROOM COUNT IS AS FOLLOWS; UNIT #1 - 1 BR / 1 BA - 720 SF; UNIT #2 - 2 BR / 1 BA - 600SF; UNIT #3 - 2 BR 1 BA - 836 SF.
-
2009-01-26$259,900 256-char remark
Show marketing remark (256 chars)
TRIPLEX IN MID-LOS ANGELS AREA. OLDER BUILDINGS, CONDITION VARIES FROM UNIT TO UNIT. SOLD AS IS WITHOUT WARRANTY OR REPAIR. UNIT SIZE AND ROOM COUNT IS AS FOLLOWS; UNIT #1 - 1 BR / 1 BA - 720 SF; UNIT #2 - 2 BR / 1 BA - 600SF; UNIT #3 - 2 BR 1 BA - 836 SF.
-
2008-10-12historical
-
2008-04-21$375,000
-
2006-09-25soldstatus $625,000
-
2005-10-03soldstatus $500,000
-
2004-04-05soldstatus $280,000
-
2004-04-01soldstatus $280,000
-
2004-01-19historical
-
2003-11-20$280,000
-
2000-04-26soldstatus $145,000
ⓘ Source: listings_history table (triggers on properties + properties_extension) + one-shot
backfill from property_details.listing_events for pre-trigger history.
Tax reassessment forecast CA · Resets to sale price
- Current annual tax
- $6,465 · $539/mo
- Projected year-2 tax
- $6,465 · $539/mo
- Expected delta
- $0/yr ($0/mo · -0.0%)
ⓘ Screening estimate from a state-policy table — verify with the county assessor before closing.
Climate risk First Street
- Flood 1/10 Low FEMA zone X (unshaded) · 0% chance over 30 yrs
- Wildfire 1/10 Low
- Heat 6/10 Major 7 d/yr ≥88°F today · 22 d/yr by 30 yrs out
- Wind 1/10 Low
- Air quality 5/10 Major 7 unhealthy d/yr today · 7 by 30 yrs out
Nearby sold comps map
Loading sold comps map…
Walkable amenities ~0.75 mi
Loading nearby amenities…
Taxation est. · year 1
- Rental income
- $85,260
- − Mortgage interest
- −$44,756
- − Property taxes
- −$6,465
- − Insurance
- −$3,995
- − Repairs & maintenance
- −$6,821
- − Management
- −$6,821
- − Depreciation
- −$23,244
- Taxable loss
- −$6,842
- Est. tax savings @ 24.0%
- +$1,642
- After-tax cash flow
- $8,257/yr
For passive investors: Depreciation is non-cash, so a rental often shows a tax loss while cash-flowing — sheltering income. Rental losses are passive: they offset passive income freely, and up to $25,000/yr can offset ordinary (W-2) income if you actively participate and your MAGI is under $100k (phasing out to $0 by $150k); unused losses carry forward. On sale, claimed depreciation is recaptured at up to 25%, and gains may owe capital-gains tax (a 1031 exchange can defer both). Figures are a year-1 estimate at your 24.0% rate — not tax advice; consult a CPA.
Schools (NCES district)
- District
- Los Angeles Unified
- NCES district ID
- 0622710
- Math proficiency
- 29% ▼ -4.00%
- Reading proficiency
- 54% ▲ 10.00%
- Median HH income
- $50,403
- Composite
- 35.67/100
- National rank
- #4875
- State rank
- #223 of 517 in CA
Livability — Los Angeles
- Score
- 68/100
- State rank
- #273
- US rank
- #9237
Category grades
Schools grade is shown separately in the Schools card above.
Census & demographics
- Census place
- Los Angeles, CA
- County
- Los Angeles County · 9,444,647 people
- City population
- 3,838,149
- Metro
- Los Angeles-Long Beach-Anaheim, CA
- Population (ZIP)
- 70,065
- Household income
- $56,030
- Rent vs Own
- Severe rent burden
- 4550.0
Population outlook (Los Angeles County) Hauer SSP2
- Today (2025)
- 10,940,515 people
- By 2030
- 11,256,481 · +2.9%
- By 2040
- 11,729,929 · +7.2%
- By 2050
- 11,948,407 · +9.2%
- By 2075
- 11,818,114 · +8.0%
- By 2100
- 10,842,928 · -0.9%
Race, ethnicity, and origin ACS 2023
- Neighborhood character
- Predominantly Hispanic (81%)
- Race & ethnicity
- Hispanic / Latino 81% Two or more races 20% Black 16% Native American 1%
- Hispanic origin (detail)
- Mexican 51%
- Common ancestry
- British 1%
- Foreign-born
- 40% · Canada
- Languages at home
- 24% English-only · Spanish 75%
Political lean MEDSL · Los Angeles
- 2024 margin
- Solid D (+32.9) · D 64.8% · R 31.9% · Other 3.3%
- 2008→2024 swing
- -7.4pp toward R · 2008: 40.4pp · 2024: 32.9pp
- All cycles
- 2024: D+32.9 2020: D+44.2 2016: D+48.0 2012: D+40.0 2008: D+40.4
Not yet ingested
- Civics
- —
Market trends
- HPI YoY
- ▼ -785.95%
- Current HPI
- 512.5667
- Rent YoY
- ▲ 0.11%
- Metro
- Los Angeles-Long Beach-Anaheim, CA
- State GDP YoY
- ▲ 3.21%
- F500 in state
- 116
Industry mix (Fortune 500 HQ in CA)
| Industry | F500 HQs | Revenue |
|---|---|---|
| Technology | 27 | $1,492B |
|
||
| Financial Services | 3 | $174B |
|
||
| Retail | 3 | $44B |
|
||
| Insurance | 3 | $26B |
|
||
| Media / Entertainment | 2 | $115B |
|
||
| Pharmaceuticals / Biotech | 2 | $62B |
|
||
Price history
+451.0% since first listed23 events — show timeline
- 2026-05-26 Listed $799,000 TheMLS
- 2016-12-27 Sold (Public Records) $440,000 Public Records
- 2010-05-10 Sold (MLS) $200,000 CRMLS
- 2009-12-16 Pending — CRMLS
- 2009-12-08 Relisted — CRMLS
- 2009-10-24 Pending — CRMLS
- 2009-06-25 Listing Removed — CRMLS
- 2009-06-08 Price Changed $240,500 CRMLS
- 2009-06-08 Relisted — CRMLS
- 2009-05-16 Listing Removed — CRMLS
- 2009-03-09 Price Changed $249,900 CRMLS
- 2009-02-25 Relisted — CRMLS
- 2009-02-22 Listing Removed — CRMLS
- 2009-01-26 Listed $259,900 CRMLS
- 2008-10-12 Listing Removed — CRMLS
- 2008-04-21 Listed $375,000 CRMLS
- 2006-09-25 Sold (Public Records) $625,000 Public Records
- 2005-10-03 Sold (Public Records) $500,000 Public Records
- 2004-04-05 Sold (MLS) $280,000 TheMLS
- 2004-04-01 Sold (Public Records) $280,000 Public Records
- 2004-01-19 Delisted — TheMLS
- 2003-11-20 Listed $280,000 TheMLS
- 2000-04-26 Sold (Public Records) $145,000 Public Records
Property tax history
-1.1%/yrLatest (2025): $6,465 · +1.2% YoY. Source: county tax records.
Cash-flow waterfall
monthlySold comps — $/sqft
last 12 mo · ≤1 miLoading sold comps…