 🏷️ Likely Rental
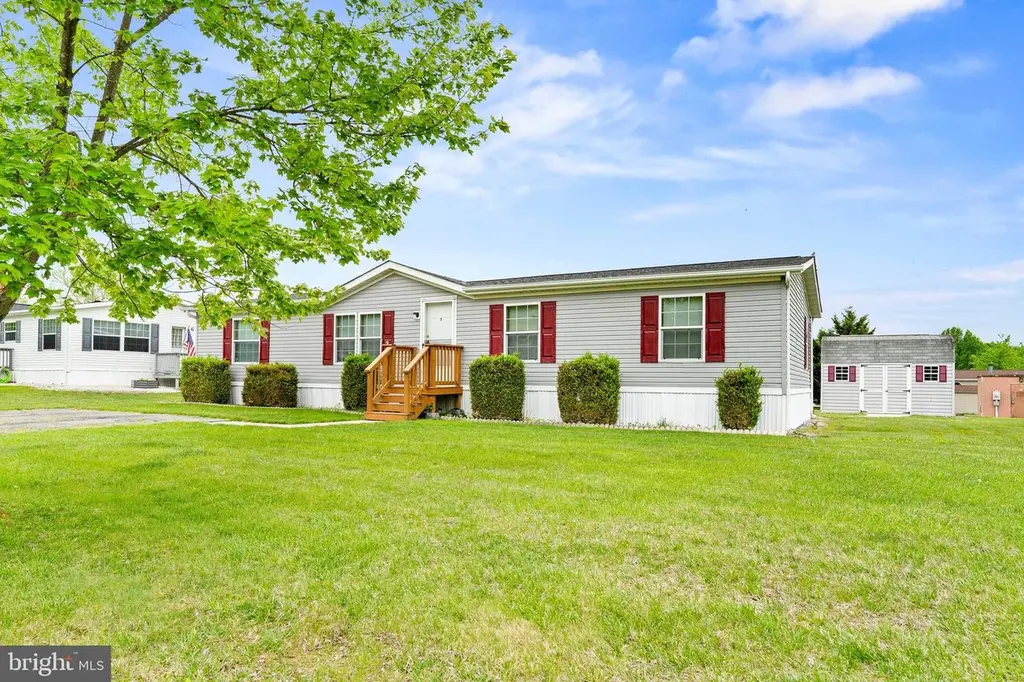
2 Grace Ann · Darlington, MD
Flood risk No data
- FEMA flood zone
- —
- Chance of flooding over 30 yrs
- —
- Est. flood insurance / yr
- —
Fire risk No data
- Est. fire insurance / yr
- —
Heat risk No data
- Hot days now (above threshold)
- —
- Hot days in 30 yrs
- —
Wind risk No data
- Chance of severe wind over 30 yrs
- —
Air-quality risk No data
- Unhealthy air days now
- —
- Unhealthy air days in 30 yrs
- —
Risk factors via First Street. Map © Google.
Why this score? — see what drove the B grade
The composite is a weighted blend of 9 inputs, each scored 0–100. Each bar is that input's sub-score; the figure is the points it added to the 100-point composite (weight × sub-score).
- Cash flow +26.9/30.0
- ARV discount +15.0/15.0
- DSCR +9.3/10.0
- 1% rule +7.2/10.0
- Condition / age +3.8/5.0
- Livability +3.3/5.0
- Rent growth +2.5/5.0
- Schools +2.2/10.0
- Appreciation +0.0/10.0
$109,900
🖨 Deal sheet 📄 Offer letter ✓ Due diligence
Listing remarks
Vey well maintained double wide in the sought after community of Maybelle Manor! This home has 3 bedroom and 2 full baths. The owners suite has a walk-in closed and a very large attached bath. The kitchen is open to the family room and dining room. The mud/laundry room has access to the rear deck. Two additional bedrooms and a flex room off the living room that could be used for a TV room, office, or another bedroom. Shed included. Roof was put on in 2025. LOT RENT IS $670/MONTH AND INCLUDED WATER, SEWER, AND TRASH. All appliances included. Nice wide (paved) driveway. Conowingo Elementary and Rising Sun Middle and High School district. This will be a great home for someone looking for every
Key facts
- 2 parking spots
- Built 2002
- Listed 6 days
Property features AI
Finance
- Financial info: Ground rent $670 per month
Exterior
- Parking: Two driveway parking spaces; Two total garage and parking spaces
- Utilities: Electric hot water; Community water; Community septic tank
- Home design: Manufactured home; Above-grade living space only; Ownership: ground rent (monthly payment)
- Construction: Vinyl siding; Above-grade structure
- Exterior features: Paved driveway
Interior
- Bedrooms: Three bedrooms on the main level
- Bathrooms: Two full bathrooms on the main level
- Heating & cooling: Heat pump(s) heating; Central air conditioning (electric)
- Interior features: Estimated living area; No basement
- Laundry & utility: Main-floor laundry
Neighborhood map
What this means for you Summary
Snapshot
- This is a 3-bed/2.0-bath single-family listed at $110k. Condition is rated good.
Deal economics
- At list price, monthly cash flow is $303 ($4k/yr) — positive.
- The deal already cash-flows at list — no discount required.
- Meets the 1% rule at list price ($1k rent vs $110k).
- Cap rate 9.6% vs local median 2.7% in Darlington — top-decile yield for the area; either an underpriced asset or a hidden risk that comps aren't pricing in. Stress-test before assuming the spread holds.
Location & tenants
- Location reads 66/100 on livability (#241 in MD) — a middle-class / working-renter tenant base. Strengths: employment A+, housing A+; Watch: crime C-, amenities F, commute F.
- Cecil County Public Schools (rural): math 15% / reading 30% proficiency, ranked #15 of 24 in MD (top 62%) — low school quality limits family demand, transient renter base, plan for 1-2y turnover.
- Zoned schools: Conowingo Elementary (math 17% / reading 17%, grade F, #408 of 860 statewide, top 50%, 388 students, 45% FRL); Rising Sun Middle School (math 12% / reading 36%, grade F, #114 of 225 statewide, top 52%, 619 students, 38% FRL); Rising Sun High (math 50% / reading 72%, grade C+, #65 of 222 statewide, top 31%, 1,106 students, 33% FRL) — zoned schools at 39% FRL track the district average.
- Market conditions: 49 active listings in the ZIP; 563 units permitted in Cecil County in 2024 (330 in 5+ unit buildings).
Forward outlook
- Local home prices are declining (-3.0%/yr); year-one equity from $760 of loan paydown is wiped out by about $3k of value loss. Plan a longer hold.
- At projected returns (-3.0% appreciation + 3.0% rent growth), your $31k cash investment doubles in ~10 years — after that, you're playing with house money.
Negotiation context
- Only 6 days on market — expect competitive offers; lowballing is unlikely to land.
Questions for the listing agent
- Is there a deadline driving the sale (1031 exchange, divorce, estate, relocation)? That informs how much negotiation room exists.
- What's the average days-on-market for RENTAL listings here right now (not sales)? A rising rental-DOM trend means longer vacancies and softer asking-rent achievability than the comps imply.
- What's the recent tenant-quality profile in this submarket — average credit score on applications, eviction rate, late-payment / NSF rate, and stable-employment percentage? A property-management company in the area should have these aggregated.
- How much new for-sale + rental construction is in the pipeline within 1–3 miles? Heavy new supply typically softens prices + rents 12–24 months out; constrained supply supports both.
Investment metrics
- 1% rule
- 1.22% ✓
- Cap rate
- 9.60%
- Cash-on-cash
- 11.80%
- DSCR
- 1.53
- GRM
- 6.8
CMA / ARV
- ARV (median comp)
- $180,623
- List price
- $109,900
- Delta
- -39.16%
- Verdict
- UNDERPRICED
- Comps
- 20 within 1.0 mi
Show comp detail 10 sales within ~0.75 mi
| Address | Dist | Beds/Ba | Sqft | Sold | Price | $/sf | Match |
|---|---|---|---|---|---|---|---|
| 2 Grace Ann | 0.00mi | 3/2.0 | 1,600 (0%) | 1mo | $100,000 | $63 | 99 |
| 22 Leona | 0.06mi | 3/2.0 | 1,600 (0%) | 11mo | $105,000 | $66 | 88 |
| 2 Ginger Ln | 0.35mi | 3/2.0 | 1,620 (+1%) | 13mo | $275,000 | $170 | 71 |
| 8 Ginger Ln | 0.34mi | 3/2.0 | 1,620 (+1%) | 13mo | $266,500 | $165 | 71 |
| 4 Ginger Ln | 0.35mi | 3/2.0 | 1,620 (+1%) | 13mo | $290,500 | $179 | 71 |
| 99 Curry Ave | 0.53mi | 3/2.0 | 1,512 (-6%) | 8mo | $185,000 | $122 | 60 |
| 108 Curry Ave | 0.50mi | 2/2.0 (-1) | 1,700 (+6%) | 7mo | $185,000 | $109 | 56 |
| 186 Conowingo Lake Rd | 0.47mi | 3/2.0 | 1,642 (+3%) | 23mo | $385,000 | $234 | 54 |
| 6 Ginger Ln | 0.35mi | 2/2.0 (-1) | 1,782 (+11%) | 15mo | $257,500 | $145 | 47 |
| 115 Curry Ave | 0.53mi | 3/2.0 | 1,400 (-12%) | 14mo | $195,000 | $139 | 43 |
Match score weights: distance 35% · size 25% · config 20% · recency 20%. Top-matched comps best support the ARV.
Projected returns pro-forma
-3.0% appreciation · 3.0% rent growth · sell at horizon
- IRR
- 1.3%
- Equity multiple
- 1.05×
- Total profit
- $1,492
- Equity at exit
- $16,386
- IRR
- 10.9%
- Equity multiple
- 1.85×
- Total profit
- $26,208
- Equity at exit
- $9,502
Cash invested: $30,772 (down + closing). Projections, not guarantees.
Landlord ↔ Tenant lean methodology
- Overall (STATE)
- 27 Tenant-Leaning
- State Maryland
- 27 Tenant-Leaning · D+14
- County
- — inherits STATE
- City
- — inherits STATE
ZIP-level market 21918
- Home prices YoY
- -18.1%
- Active inventory
- 49
- Price-to-rent
- 6.8×
Monthly cashflow live
- Estimated rent
- $1,345 medium interval (Pro) →
- Mortgage (P&I)
- −$576
- Tax est. 1.5%
- −$137 /mo · $1,648/yr
- Insurance
- −$46
- HOA
- −$0
- Vacancy / Maint / Mgmt
- −$282
- Net cashflow
- $303
Break-even live
UW: 25.0% down · 7.5% · 30yr · 1.5% tax · 5.0% vac · 8.0% maint · 8.0% mgmt
Financing live
Cash to close
- Down payment
- $27,475
- Closing costs
- $3,297
- Reserves months
- —
- Total cash needed
- —
Loan-product check · same deal, 3 products live
Conventional
25% down · 7.5% · 30yr
- Down + closing
- —
- Monthly P&I
- —
- Monthly cashflow
- —
- DSCR
- —
- Eligible?
- —
Personal DTI + credit; lowest rate.
DSCR
20% down · 8.5% · 30yr
- Down + closing
- —
- Monthly P&I
- —
- Monthly cashflow
- —
- DSCR
- —
- Eligible?
- —
No personal income docs; deal must DSCR.
Hard money
10% down · 12.0% · 12mo
- Down + closing
- —
- Monthly P&I
- —
- Monthly cashflow
- —
- DSCR
- —
- Eligible?
- —
Short-term bridge; refi at stabilization.
Listing history 4 events
-
2026-05-06status Pending 1017-char remark
-
2026-05-05historical 1017-char remark
-
2026-04-30$109,900 Active 1017-char remark
-
2026-04-29historical $109,900 1017-char remark
ⓘ Source: listings_history table (triggers on properties + properties_extension) + one-shot
backfill from property_details.listing_events for pre-trigger history.
Nearby sold comps map
Loading sold comps map…
Walkable amenities ~0.75 mi
Loading nearby amenities…
Taxation est. · year 1
- Rental income
- $16,135
- − Mortgage interest
- −$6,156
- − Property taxes
- −$1,648
- − Insurance
- −$550
- − Repairs & maintenance
- −$1,291
- − Management
- −$1,291
- − Depreciation
- −$3,197
- Taxable income
- $2,002
- Est. tax owed @ 24.0%
- −$480
- After-tax cash flow
- $3,152/yr
For passive investors: Depreciation is non-cash, so a rental often shows a tax loss while cash-flowing — sheltering income. Rental losses are passive: they offset passive income freely, and up to $25,000/yr can offset ordinary (W-2) income if you actively participate and your MAGI is under $100k (phasing out to $0 by $150k); unused losses carry forward. On sale, claimed depreciation is recaptured at up to 25%, and gains may owe capital-gains tax (a 1031 exchange can defer both). Figures are a year-1 estimate at your 24.0% rate — not tax advice; consult a CPA.
Condition & rehab AI · 2 photos
This well-maintained double-wide home in a sought-after community is ready for a new owner. Fresh paint and landscaping improvements can further enhance its curb appeal and value.
Value-add opportunities
- Both Painting the exterior — Fresh paint enhances curb appeal and can increase both resale and rental value.
- Both Landscaping improvements — Enhanced landscaping can improve curb appeal and attract more potential buyers or renters.
- Resale Interior updates (paint, minor repairs) — Fresh paint and minor repairs can make the interior more appealing to potential buyers.
- Rental HVAC maintenance — A well-maintained HVAC system can attract more renters and reduce maintenance costs.
Renovation cost estimate screening
Value-add ROI direction
- Both Painting the exterior — Fresh paint enhances curb appeal and can increase both resale and rental value. ↑
- Both Landscaping improvements — Enhanced landscaping can improve curb appeal and attract more potential buyers or renters. ↑
- Resale Interior updates (paint, minor repairs) — Fresh paint and minor repairs can make the interior more appealing to potential buyers. ↑
- Rental HVAC maintenance — A well-maintained HVAC system can attract more renters and reduce maintenance costs. ↑
ⓘ Cost ranges are severity-bucket heuristics (US national rule-of-thumb). Get contractor quotes + a written scope before underwriting a rehab budget.
Schools (NCES district)
- District
- Cecil County Public Schools
- NCES district ID
- 2400240
- Math proficiency
- 15% ▼ -21.00%
- Reading proficiency
- 30% ▼ -15.00%
- Median HH income
- $66,544
- Composite
- 21.51/100
- National rank
- #8322
- State rank
- #15 of 24 in MD
Livability — Darlington
- Score
- 66/100
- State rank
- #241
- US rank
- #11974
Category grades
Schools grade is shown separately in the Schools card above.
Census & demographics
- Population (ZIP)
- 4,125
Population outlook (Cecil County) Hauer SSP2
- Today (2025)
- 105,877 people
- By 2030
- 106,905 · +1.0%
- By 2040
- 107,156 · +1.2%
- By 2050
- 104,170 · -1.6%
- By 2075
- 95,771 · -9.5%
- By 2100
- 82,381 · -22.2%
Race, ethnicity, and origin ACS 2023
- Neighborhood character
- Predominantly White (89%)
- Race & ethnicity
- White 89% Two or more races 8% Black 2% Hispanic / Latino 2%
- Common ancestry
- Romanian 5% Slovak 4% Portuguese 1%
- Foreign-born
- 0% · South Korea
- Languages at home
- 95% English-only · Other Indo-European 2% French/Haitian/Cajun 1% Spanish 1%
Political lean MEDSL · Cecil
- 2024 margin
- Solid R (+30.9) · D 33.5% · R 64.4% · Other 2.1%
- 2008→2024 swing
- -16.3pp toward R · 2008: -14.6pp · 2024: -30.9pp
- All cycles
- 2024: R+30.9 2020: R+26.6 2016: R+35.3 2012: R+20.4 2008: R+14.6
Not yet ingested
- Civics
- —
Market trends
- HPI YoY
- ▼ -56.53%
- Current HPI
- 255.9097
- Rent YoY
- —
- Metro
- —
- State GDP YoY
- ▲ 2.97%
- F500 in state
- 12
Industry mix (Fortune 500 HQ in MD)
| Industry | F500 HQs | Revenue |
|---|---|---|
| Aerospace / Defense | 1 | $71B |
|
||
| Utilities | 1 | $25B |
|
||
| Hotels | 1 | $24B |
|
||
| Consumer Goods | 1 | $7B |
|
||
| Real Estate | 1 | $6B |
|
||
| Chemicals | 1 | $2B |
|
||
Price history
-9.0% since first listed5 events — show timeline
- 2026-05-26 Sold (MLS) $100,000 BRIGHT MLS
- 2026-05-06 Pending — BRIGHT MLS
- 2026-05-05 Listing Removed — BRIGHT MLS
- 2026-04-30 Listed $109,900 BRIGHT MLS
- 2026-04-29 Coming Soon $109,900 BRIGHT MLS
Cash-flow waterfall
monthlySold comps — $/sqft
last 12 mo · ≤1 miLoading sold comps…