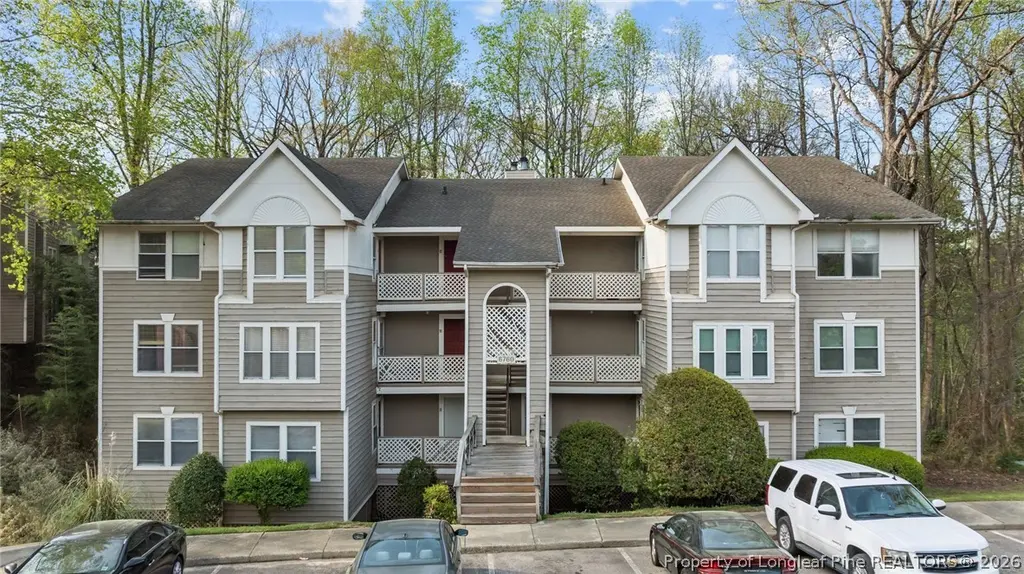
6760-1 Willowbrook Dr #1 · Fayetteville, NC
Flood risk 9/10 · Severe
- FEMA flood zone
- X (unshaded)
- Chance of flooding over 30 yrs
- 0.98%
- Est. flood insurance / yr
- $507 – $1,088
Fire risk 3/10 · Minor
- Est. fire insurance / yr
- $906 – $1,684
Heat risk 7/10 · Major
- Hot days now (above 106°F)
- 7 days/yr
- Hot days in 30 yrs
- 16 days/yr
Wind risk 6/10 · Moderate
- Chance of severe wind over 30 yrs
- 73.0%
Air-quality risk 2/10 · Minimal
- Unhealthy air days now
- 0 days/yr
- Unhealthy air days in 30 yrs
- 1 days/yr
Risk factors via First Street. Map © Google.
Why this score? — see what drove the C+ grade
The composite is a weighted blend of 9 inputs, each scored 0–100. Each bar is that input's sub-score; the figure is the points it added to the 100-point composite (weight × sub-score).
- Cash flow +25.6/30.0
- 1% rule +9.1/10.0
- DSCR +8.5/10.0
- ARV discount +7.5/15.0
- Livability +3.8/5.0
- Rent growth +3.3/5.0
- Schools +3.1/10.0
- Condition / age +2.5/5.0
- Appreciation +0.0/10.0
$84,900
🖨 Deal sheet 📄 Offer letter ✓ Due diligence
Listing remarks
INVESTORS Gold Mine!!! BEAUTIFUL, WELL MAINTAINED 2 BR 2 BATH CONDO ON THE FIRST FLOOR WITH FIREPLACE AND VAULTED CEILING. ENJOY THE BEAUTIFUL OUTDOORS ON THE DECK OFF OF THE FAMILY ROOM. CLOSE TO ALL SHOPPING, RESTAURANTS AND REILLY RD. GATE FOR EASY ACCESS TO FORT BRAGG.
Key facts
- Close to restaurants
- Vaulted ceiling
- Deck
Tags
Property features AI
Finance
- Other: Subdivision: STEWARTS CK; Directions provided: CLIFFDALE - SOUTH REILLY RD. - LEFT - WILLOWBROOK DR.
- HOA & community: Homeowners association with a monthly fee of $234.30
Exterior
- Parking: No garage
- Utilities: Public water; Public sewer
- Home design: Residential condominium
- Construction: Frame construction
- Exterior features: Deck
Interior
- Kitchen: Dishwasher; Microwave; Range
- Bedrooms: Total rooms: 4
- Flooring: Carpet; Laminate; Vinyl
- Bathrooms: 2 full bathrooms
- Heating & cooling: Central air (electric); Ceiling fan(s)
- Interior features: Ceiling fans; Eat-in kitchen; Factory-built fireplace (1)
- Laundry & utility: Washer hookup
Neighborhood map
What this means for you Summary
Snapshot
- This is a 2-bed/2.0-bath condo listed at $85k.
Deal economics
- At list price, monthly cash flow is $135 ($2k/yr) — positive.
- The deal already cash-flows at list — no discount required.
- Meets the 1% rule at list price ($1k rent vs $85k).
- Recommended offer: $82k (3.0% below list) — sets the bar for market timing.
- Cap rate 9.1% vs local median 4.9% in Fayetteville — top-decile yield for the area; either an underpriced asset or a hidden risk that comps aren't pricing in. Stress-test before assuming the spread holds.
Location & tenants
- Location reads 75/100 on livability (#45 in NC, #4,031 nationally) — a middle-class / working-renter tenant base. Strengths: commute A+, cost of living A+, housing A+; Watch: crime F, employment D-.
- Cumberland County Schools (urban): math 32% / reading 41% proficiency, ranked #126 of 178 in NC (top 71%) — families likely to look elsewhere, expect single-tenant / working-renter base with shorter leases.
- Zoned schools: Benjamin J Martin Elementary (math 17% / reading 21%, grade F, #1,269 of 1,410 statewide, top 91%, 537 students, 99% FRL); Westover Middle (math 20% / reading 30%, grade F, #396 of 475 statewide, top 84%, 784 students, 100% FRL); Westover High (math 42% / reading 39%, grade F, #387 of 535 statewide, top 73%, 1,202 students, 100% FRL) — zoned schools average 100% FRL vs 55% district-wide (45 pts higher); higher-poverty schools than district average — tighter screening recommended.
- Market conditions: Rents rising (+3.1%/yr); 429 active listings in the ZIP; 40 comparable units currently listed for rent nearby; rentals at typical pace (median 24d on market — plan ~3-4 weeks tenant-placement turnaround); 1,125 units permitted in Cumberland County in 2024 (104 in 5+ unit buildings).
Forward outlook
- Local home prices are declining (-3.0%/yr); year-one equity from $587 of loan paydown is wiped out by about $3k of value loss. Plan a longer hold.
Negotiation context
- It's been on market 52 days — a 3% lower offer ($82k) is reasonable based on typical stale-listing flexibility.
- 5 sale attempts since 6y ago with the ask held roughly flat each time — persistent listings suggest the price (not the market) is what's stuck; bring a comps-based counter.
- Current owner paid $56k; list at $85k implies a 53% gain — meaningful room to come down on a strong offer.
Risks & watch-outs
- Watch-outs: flood insurance adds $66/mo.
- Climate carrying-cost: severe flood risk; major wind risk, 73% chance of damaging wind over 30y; extreme-heat days projected 7→16/yr by 2055 (HVAC capex compounding) — expect insurance premiums to compound above CPI over the hold.
Questions for the listing agent
- It's been on market 52 days. Have you received any prior offers? Is the seller open to a 3% concession, seller financing, or rate buy-down credit?
- What's the actual annual flood-insurance premium (NFIP or private), and is the property in a SFHA with mandatory coverage?
- What does the HOA fee cover, when was the last increase, and are there any pending special assessments or reserve-fund shortfalls?
- Any open or pending special assessments — roof, HVAC, plumbing, elevator, façade? What's the per-unit balance and payoff schedule, and is the seller paying it off at close or rolling it to the buyer?
- Is there a deadline driving the sale (1031 exchange, divorce, estate, relocation)? That informs how much negotiation room exists.
- Crime grade is F in this area — have there been break-ins, vandalism, or insurance claims at this property in the last 3 years? What carrier currently insures it and at what premium?
- What's the average days-on-market for RENTAL listings here right now (not sales)? A rising rental-DOM trend means longer vacancies and softer asking-rent achievability than the comps imply.
- What's the recent tenant-quality profile in this submarket — average credit score on applications, eviction rate, late-payment / NSF rate, and stable-employment percentage? A property-management company in the area should have these aggregated.
- How much new apartment / multifamily construction is in the pipeline within 1–3 miles? Heavy new supply (>2% of stock underway) typically softens rents 12–24 months out; light construction supports rent growth.
Investment metrics
- 1% rule
- 1.41% ✓
- Cap rate
- 9.14%
- Cash-on-cash
- 10.15%
- DSCR
- 1.45
- GRM
- 5.9
CMA / ARV
No comps found within radius.
Projected returns pro-forma
-3.0% appreciation · 3.11% rent growth · sell at horizon
- IRR
- -5.5%
- Equity multiple
- 0.79×
- Total profit
- $-4,890
- Equity at exit
- $12,659
- IRR
- 4.5%
- Equity multiple
- 1.34×
- Total profit
- $7,967
- Equity at exit
- $7,341
Cash invested: $23,772 (down + closing). Projections, not guarantees.
Landlord ↔ Tenant lean methodology
- Overall (STATE)
- 85 Strongly Landlord-Friendly
- State North Carolina
- 85 Strongly Landlord-Friendly · R+3
- County
- — inherits STATE
- City
- — inherits STATE
ZIP-level market 28314
- Home prices YoY
- -15.7%
- Rents YoY
- 3.1%
- Active inventory
- 429
- Price-to-rent
- 5.9×
Monthly cashflow live
- Estimated rent
- $1,197 high interval (Pro) →
- Mortgage (P&I)
- −$445
- Tax from tax record
- −$30 /mo · $363/yr
- Insurance
- −$35
- Flood insurance flood zone
- −$66 /mo · $798/yr
- HOA
- −$234
- Vacancy / Maint / Mgmt
- −$251
- Net cashflow
- $135
Break-even live
UW: 25.0% down · 7.5% · 30yr · 1.5% tax · 5.0% vac · 8.0% maint · 8.0% mgmt
Financing live
Cash to close
- Down payment
- $21,225
- Closing costs
- $2,547
- Reserves months
- —
- Total cash needed
- —
Loan-product check · same deal, 3 products live
Conventional
25% down · 7.5% · 30yr
- Down + closing
- —
- Monthly P&I
- —
- Monthly cashflow
- —
- DSCR
- —
- Eligible?
- —
Personal DTI + credit; lowest rate.
DSCR
20% down · 8.5% · 30yr
- Down + closing
- —
- Monthly P&I
- —
- Monthly cashflow
- —
- DSCR
- —
- Eligible?
- —
No personal income docs; deal must DSCR.
Hard money
10% down · 12.0% · 12mo
- Down + closing
- —
- Monthly P&I
- —
- Monthly cashflow
- —
- DSCR
- —
- Eligible?
- —
Short-term bridge; refi at stabilization.
Rent comps 40 comps
| Address | Beds | Baths | Sqft | Rent | $/sqft | DOM | Units | Dist |
|---|---|---|---|---|---|---|---|---|
| 1000 Wood Creek Dr #9 Fayetteville, NC | 2.0 | 2.0 | 1100 | $1,175 | $1.07 | 23d | 1 | 0.03mi |
| 1022 Brookhollow Dr #5 Fayetteville, NC | 2.0 | 2.0 | 1086 | $1,050 | $0.97 | 23d | 1 | 0.03mi |
| 6748 Willowbrook Dr #9 Fayetteville, NC | 2.0 | 2.0 | 1157 | $1,100 | $0.95 | 23d | 1 | 0.07mi |
| 1018 Wood Creek Dr #9 Fayetteville, NC | 3.0 | 2.0 | 1101 | $1,195 | $1.09 | 23d | 1 | 0.08mi |
| 1014 Brookhollow Dr Fayetteville, NC | 2.0 | 2.0 | 1050 | $1,000 | $0.95 | 14d | 1 | 0.08mi |
| 6792 Willowbrook Dr #16 Fayetteville, NC | 1.0 | 1.0 | 800 | $795 | $0.99 | 23d | 1 | 0.13mi |
| 6792 Willowbrook Dr Fayetteville, NC | 1.0 | 1.0 | 900 | $795 | $0.88 | 14d | 1 | 0.13mi |
| 6720 Willowbrook Dr #5 Fayetteville, NC | 2.0 | 2.0 | 1200 | $1,150 | $0.96 | 14d | 1 | 0.15mi |
| 6809 Willowbrook Dr Fayetteville, NC | 2.0 | 2.0 | 1050 | $990 | $0.94 | 23d | 1 | 0.16mi |
| 1002 Brookhollow Dr #5 Fayetteville, NC | 3.0 | 2.0 | 1311 | $1,290 | $0.98 | 21d | 1 | 0.16mi |
| 6804 Willowbrook Dr Fayetteville, NC | 1.0 | 1.0 | 800 | $890 | $1.11 | 23d | 1 | 0.16mi |
| 942 Stewarts Creek Dr #8 Fayetteville, NC | 2.0 | 2.0 | 1020 | $1,055 | $1.03 | 23d | 1 | 0.18mi |
| 942 Stewarts Creek Dr #9 Fayetteville, NC | 3.0 | 2.0 | 1250 | $1,250 | $1.00 | 23d | 1 | 0.18mi |
| 1001 Brookhollow Dr #4 Fayetteville, NC | 3.0 | 2.0 | 1311 | $1,550 | $1.18 | 23d | 1 | 0.20mi |
| 244 Wickford Ct Unit 6 Fayetteville, NC | 2.0 | 1.5 | 1141 | $995 | $0.87 | 23d | 1 | 0.29mi |
| 6855 Shawcross Ln Fayetteville, NC | 3.0 | 2.0 | 1100 | $1,495 | $1.36 | 23d | 1 | 0.31mi |
| 6848 Torrance Ln Fayetteville, NC | 3.0 | 2.5 | 1290 | $3,295 | $2.55 | 14d | 1 | 0.33mi |
| 205 Brookford Ct Fayetteville, NC | 3.0 | 2.0 | 1196 | $1,640 | $1.37 | 23d | 1 | 0.43mi |
| 6734 Winchester St Fayetteville, NC | 3.0 | 2.0 | 1068 | $3,195 | $2.99 | 14d | 1 | 0.44mi |
| 916 Glen Reilly Dr Fayetteville, NC | 3.0 | 2.0 | 1071 | $1,400 | $1.31 | 23d | 1 | 0.48mi |
| 605 S Reilly Rd Fayetteville, NC | 1.0–3.0 | 1.0–2.0 | 992 | $1,110 | $1.12 | 14d | 1 | 0.64mi |
| 621 Marshtree Ln #305 Fayetteville, NC | 2.0 | 2.0 | 1140 | $1,500 | $1.32 | 23d | 1 | 0.72mi |
| 625 Marshtree Ln Fayetteville, NC | 2.0–3.0 | 2.0 | 1170 | $1,200 | $1.03 | 14d | 2 | 0.76mi |
| 6535 Jefferey Dr Fayetteville, NC | 1.0 | 1.0 | 700 | $905 | $1.29 | 14d | 3 | 0.79mi |
| 338 Milburn Dr Fayetteville, NC | 3.0 | 1.5 | 1128 | $1,550 | $1.37 | 23d | 1 | 0.79mi |
| 6521 Cissna Dr Fayetteville, NC | 3.0 | 2.0 | 1456 | $1,375 | $0.94 | 14d | 1 | 0.80mi |
| 6407 Wallaby Ct Fayetteville, NC | 2.0 | 1.5 | 1100 | $1,200 | $1.09 | 14d | 1 | 0.81mi |
| 6510 Cissna Dr Fayetteville, NC | 3.0 | 1.5 | 1100 | $1,095 | $1.00 | 14d | 1 | 0.84mi |
| 6445 Independence Pl Dr Fayetteville, NC | 1.0–3.0 | 1.0–3.0 | 1106 | $1,529 | $1.38 | 14d | 18 | 0.85mi |
| 111 Grande Oaks Dr Fayetteville, NC | 1.0–3.0 | 1.0–2.0 | 1205 | $1,412 | $1.17 | 14d | 46 | 0.93mi |
| 540 Auburndale Ln Fayetteville, NC | 3.0 | 2.0 | 1100 | $1,600 | $1.45 | 14d | 1 | 0.96mi |
| 6793 Candlewood Dr Fayetteville, NC | 3.0 | 2.0 | 1240 | $1,475 | $1.19 | 14d | 1 | 0.96mi |
| 7252 Ainsley St Fayetteville, NC | 3.0 | 1.0 | 1265 | $1,299 | $1.03 | 23d | 1 | 1.00mi |
| 307 Family Lodge Dr Unit 5 Fayetteville, NC | 2.0 | 2.5 | 1200 | $1,100 | $0.92 | 14d | 1 | 1.07mi |
| 567 Cutchen Ln Fayetteville, NC | 1.0–3.0 | 1.0–2.0 | 975 | $1,175 | $1.20 | 14d | 61 | 1.12mi |
| 278 Crabapple Cir #57 Fayetteville, NC | 2.0 | 1.0 | 796 | $990 | $1.24 | 23d | 1 | 1.12mi |
| 202 Bertram Pl Fayetteville, NC | 3.0 | 2.0 | 1175 | $1,300 | $1.11 | 14d | 1 | 1.13mi |
| 495 Stiles Pl Fayetteville, NC | 3.0 | 2.0 | 1300 | $1,250 | $0.96 | 14d | 1 | 1.19mi |
| 7639 Fletcher Ave Fayetteville, NC | 3.0 | 2.0 | 1300 | $1,400 | $1.08 | 23d | 1 | 1.23mi |
| 7526 Bridgeman Dr Fayetteville, NC | 3.0 | 2.0 | 1300 | $1,450 | $1.12 | 23d | 1 | 1.27mi |
HOA detail condo
- Monthly dues
- $234 · $2,808/yr
- Assessments
- None detected in remarks — confirm with the listing agent.
Listing history 28 events
-
2026-06-18days on market $84,900 Active 52 DOM
-
2026-06-17days on market $84,900 Active 51 DOM
-
2026-06-16days on market $84,900 Active 50 DOM
-
2026-06-15days on market $84,900 Active 49 DOM
-
2026-06-14days on market $84,900 Active 47 DOM
-
2026-06-13days on market $84,900 Active 46 DOM
-
2026-06-10days on market $84,900 Active 44 DOM
-
2026-06-09days on market $84,900 Active 43 DOM
-
2026-06-08days on market $84,900 Active 42 DOM
-
2026-06-07days on market $84,900 Active 41 DOM
-
2026-06-03days on market $84,900 Active 37 DOM
-
2026-06-02days on market $84,900 Active 36 DOM
-
2026-06-01days on market $84,900 Active 35 DOM
-
2026-05-31days on market $84,900 Active 34 DOM
-
2026-05-30days on market $84,900 Active 33 DOM
-
2026-04-27$84,900 Active
-
2025-12-05status Pending
-
2025-10-31price $79,000
-
2025-09-17price $82,700
-
2025-08-09price $89,900
-
2025-08-03status Active
-
2025-06-19price $94,771
-
2025-05-19status Active
-
2025-05-19price $99,771
-
2025-04-21status Pending
-
2025-04-16$88,771 Active
-
2020-06-19$48,000
-
2001-05-07soldstatus $55,500
ⓘ Source: listings_history table (triggers on properties + properties_extension) + one-shot
backfill from property_details.listing_events for pre-trigger history.
Tax reassessment forecast NC · Resets to sale price
- Current annual tax
- $363 · $30/mo
- Projected year-2 tax
- $696 · $58/mo
- Expected delta
- +$333/yr (+$28/mo · 91.9%)
ⓘ Screening estimate from a state-policy table — verify with the county assessor before closing.
Climate risk First Street
- Flood 9/10 Extreme FEMA zone X (unshaded) · 98% chance over 30 yrs
- Wildfire 3/10 Moderate
- Heat 7/10 Severe 7 d/yr ≥106°F today · 16 d/yr by 30 yrs out
- Wind 6/10 Major 73% chance of damaging wind over 30 yrs
- Air quality 2/10 Low 0 unhealthy d/yr today · 1 by 30 yrs out
Nearby sold comps map
Loading sold comps map…
Walkable amenities ~0.75 mi
Loading nearby amenities…
Taxation est. · year 1
- Rental income
- $14,369
- − Mortgage interest
- −$4,756
- − Property taxes
- −$363
- − Insurance
- −$1,222
- − Repairs & maintenance
- −$1,150
- − Management
- −$1,150
- − HOA
- −$2,808
- − Depreciation
- −$2,470
- Taxable income
- $452
- Est. tax owed @ 24.0%
- −$108
- After-tax cash flow
- $1,508/yr
For passive investors: Depreciation is non-cash, so a rental often shows a tax loss while cash-flowing — sheltering income. Rental losses are passive: they offset passive income freely, and up to $25,000/yr can offset ordinary (W-2) income if you actively participate and your MAGI is under $100k (phasing out to $0 by $150k); unused losses carry forward. On sale, claimed depreciation is recaptured at up to 25%, and gains may owe capital-gains tax (a 1031 exchange can defer both). Figures are a year-1 estimate at your 24.0% rate — not tax advice; consult a CPA.
Schools (NCES district)
- District
- Cumberland County Schools
- NCES district ID
- 3700011
- Math proficiency
- 32% ▼ -2.00%
- Reading proficiency
- 41% ▼ -1.00%
- Median HH income
- $44,168
- Composite
- 31.0/100
- National rank
- #6096
- State rank
- #126 of 178 in NC
Livability — Fayetteville
- Score
- 75/100
- State rank
- #45
- US rank
- #4031
Category grades
Schools grade is shown separately in the Schools card above.
Census & demographics
- Census place
- Fayetteville, NC
- County
- Cumberland County · 265,314 people
- City population
- 226,118
- Metro
- Fayetteville, NC
- Population (ZIP)
- 55,834
- Household income
- $62,249
- Rent vs Own
- Severe rent burden
- 2511.0
Population outlook (Cumberland County) Hauer SSP2
- Today (2025)
- 330,855 people
- By 2030
- 333,523 · +0.8%
- By 2040
- 335,583 · +1.4%
- By 2050
- 335,325 · +1.4%
- By 2075
- 342,853 · +3.6%
- By 2100
- 340,698 · +3.0%
Race, ethnicity, and origin ACS 2023
- Neighborhood character
- Diverse neighborhood (Simpson 0.67)
- Race & ethnicity
- Black 49% White 25% Hispanic / Latino 16% Two or more races 11% Asian 3%
- Hispanic origin (detail)
- Mexican 5% Puerto Rican 6% Dominican 1%
- Common ancestry
- Slovak 1% Romanian 1% Lithuanian 1%
- Foreign-born
- 9% · Canada, South Korea
- Languages at home
- 84% English-only · Spanish 10% Korean 1% Other Asian/Pacific 1%
Political lean MEDSL · Cumberland
- 2024 margin
- D (+13.4) · D 56.1% · R 42.7% · Other 1.2%
- 2008→2024 swing
- -4.3pp toward R · 2008: 17.7pp · 2024: 13.4pp
- All cycles
- 2024: D+13.4 2020: D+16.6 2016: D+16.0 2012: D+19.7 2008: D+17.7
Not yet ingested
- Civics
- —
Market trends
- HPI YoY
- ▼ -43.20%
- Current HPI
- 231.873
- Rent YoY
- ▲ 3.11%
- Metro
- Fayetteville, NC
- State GDP YoY
- ▲ 3.28%
- F500 in state
- 26
Industry mix (Fortune 500 HQ in NC)
| Industry | F500 HQs | Revenue |
|---|---|---|
| Financial Services | 2 | $213B |
|
||
| Retail | 2 | $95B |
|
||
| Industrial Conglomerate | 1 | $38B |
|
||
| Metals / Steel | 1 | $35B |
|
||
| Utilities | 1 | $30B |
|
||
| Industrial Machinery | 1 | $19B |
|
||
Price history
+53.0% since first listed13 events — show timeline
- 2026-04-27 Listed $84,900 LPRMLS
- 2025-12-05 Pending — LPRMLS
- 2025-10-31 Price Changed $79,000 LPRMLS
- 2025-09-17 Price Changed $82,700 LPRMLS
- 2025-08-09 Price Changed $89,900 LPRMLS
- 2025-08-03 Relisted — LPRMLS
- 2025-06-19 Price Changed $94,771 LPRMLS
- 2025-05-19 Relisted — LPRMLS
- 2025-05-19 Price Changed $99,771 LPRMLS
- 2025-04-21 Pending — LPRMLS
- 2025-04-16 Listed $88,771 LPRMLS
- 2020-06-19 Listed $48,000 LPRMLS
- 2001-05-07 Sold (Public Records) $55,500 Public Records
Property tax history
-13.7%/yrLatest (2019): $363 · +0.0% YoY. Source: county tax records.
Cash-flow waterfall
monthlySold comps — $/sqft
last 12 mo · ≤1 miLoading sold comps…