23 Clearview Rd · Wingdale, NY
Flood risk 1/10 · Minimal
- FEMA flood zone
- X (unshaded)
- Chance of flooding over 30 yrs
- 0.0%
- Est. flood insurance / yr
- $507 – $1,088
Fire risk 3/10 · Minor
- Est. fire insurance / yr
- $691 – $1,283
Heat risk 4/10 · Minor
- Hot days now (above 96°F)
- 7 days/yr
- Hot days in 30 yrs
- 15 days/yr
Wind risk 4/10 · Minor
- Chance of severe wind over 30 yrs
- 17.0%
Air-quality risk 3/10 · Minor
- Unhealthy air days now
- 2 days/yr
- Unhealthy air days in 30 yrs
- 3 days/yr
Risk factors via First Street. Map © Google.
Why this score? — see what drove the B- grade
The composite is a weighted blend of 9 inputs, each scored 0–100. Each bar is that input's sub-score; the figure is the points it added to the 100-point composite (weight × sub-score).
- Cash flow +25.8/30.0
- DSCR +8.6/10.0
- ARV discount +7.5/15.0
- 1% rule +7.2/10.0
- Appreciation +4.9/10.0
- Schools +4.0/10.0
- Rent growth +2.5/5.0
- Livability +2.5/5.0
- Condition / age +2.5/5.0
$130,000
🖨 Deal sheet (PDF) 📄 Offer letter ✓ Due diligence
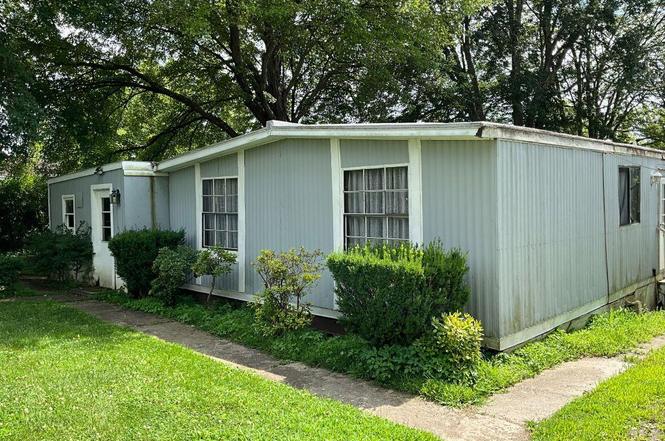
Listing remarks
23 Clearview Rd, Wingdale, NY – Multi-Family Opportunity Two homes for the price of one! This unique multi-family property sits on a . 38-acre lot and includes a detached two-car garage—perfect for extra storage or workshop space. The main home features a primary bedroom with an ensuite bath, plus two additional bedrooms, a spacious kitchen, and a comfortable living room. The second home offers flexible living or rental potential. Each home comes equipped with its own septic system, well, and dry well, making this an ideal setup for extended family or investment income. While the property does need some TLC, it offers incredible potential for the right buyer. Don’t miss yo
Key facts
- Well
- Septic system
- 0.38 acre lot
Tags
Neighborhood map
What this means for you Summary
Snapshot
- This is a 3-bed/1.0-bath other listed at $130k.
Deal economics
- At list price, monthly cash flow is $317 ($4k/yr) — positive.
- The deal already cash-flows at list — no discount required.
- Meets the 1% rule at list price ($2k rent vs $130k).
- Recommended offer: $118k (9.0% below list) — sets the bar for market timing.
Location & tenants
- Location reads: area grade B — affects rentability + tenant quality, not the cash-flow math above.
- Dover Union Free School District (rural): math 44% / reading 48% proficiency, ranked #433 of 590 in NY (top 73%) — families likely to look elsewhere, expect single-tenant / working-renter base with shorter leases.
- Zoned schools: Wingdale Elementary School (246 students, 68% FRL); Dover Middle School (math 32% / reading 47%, grade F, #418 of 729 statewide, top 59%, 301 students, 68% FRL); Dover High School (math 92% / reading 74%, grade A, #435 of 1,100 statewide, top 40%, 467 students, 59% FRL) — zoned schools average 65% FRL vs 38% district-wide (27 pts higher); higher-poverty schools than district average — tighter screening recommended.
- Zoned-school proficiency averages 61% at this address vs 46% district-wide (+15 pts) — the actual schools serving this property are materially stronger than the Dover Union Free School District average implies; a family-tenant draw the district grade alone would hide.
- Market conditions: 15 active listings in the ZIP; 620 units permitted in Dutchess County in 2024 (242 in 5+ unit buildings).
Forward outlook
- In year one you build about $711 of equity ($899 loan paydown + $-188 appreciation (-0.1% local appreciation)).
- Dutchess County population projected at -11% by 2050 — secular population decline; favor cash flow + early exit over multi-decade hold.
- At projected returns (-0.1% appreciation + 3.0% rent growth), your $36k cash investment doubles in ~7 years — after that, you're playing with house money.
Negotiation context
- It's been on market 101 days — a 9% lower offer ($118k) is reasonable based on typical stale-listing flexibility.
- 3 sale attempts with the ask held roughly flat each time — persistent listings suggest the price (not the market) is what's stuck; bring a comps-based counter.
Questions for the listing agent
- It's been on market 101 days. Have you received any prior offers? Is the seller open to a 9% concession, seller financing, or rate buy-down credit?
- Built in 1977 — when were the roof, HVAC, electrical panel, plumbing, and water heater last replaced?
- Why hasn't it sold? Are there any deal-killer items the seller is aware of (foundation, flood, title, zoning, code violations)?
- Is there a deadline driving the sale (1031 exchange, divorce, estate, relocation)? That informs how much negotiation room exists.
- What's the average days-on-market for RENTAL listings here right now (not sales)? A rising rental-DOM trend means longer vacancies and softer asking-rent achievability than the comps imply.
- What's the recent tenant-quality profile in this submarket — average credit score on applications, eviction rate, late-payment / NSF rate, and stable-employment percentage? A property-management company in the area should have these aggregated.
- How much new for-sale + rental construction is in the pipeline within 1–3 miles? Heavy new supply typically softens prices + rents 12–24 months out; constrained supply supports both.
Investment metrics
- 1% rule
- 1.22% ✓
- Cap rate
- 9.22%
- Cash-on-cash
- 10.45%
- DSCR
- 1.46
- GRM
- 6.8
CMA / ARV
No comps found within radius.
Projected returns pro-forma
-0.14% appreciation · 3.0% rent growth · sell at horizon
- IRR
- 9.0%
- Equity multiple
- 1.43×
- Total profit
- $15,543
- Equity at exit
- $36,810
- IRR
- 14.2%
- Equity multiple
- 2.53×
- Total profit
- $55,777
- Equity at exit
- $43,505
Cash invested: $36,400 (down + closing). Projections, not guarantees.
Landlord ↔ Tenant lean methodology
- Overall (STATE)
- 15 Strongly Tenant-Friendly
- State New York
- 15 Strongly Tenant-Friendly · D+10
- County
- — inherits STATE
- City
- — inherits STATE
ZIP-level market 12594
- Home prices YoY
- -0.1%
- Active inventory
- 15
- Price-to-rent
- 6.8×
Monthly cashflow live
- Estimated rent
- $1,586 medium interval (Pro) →
- Mortgage (P&I)
- −$682
- Tax from tax record
- −$200 /mo · $2,399/yr
- Insurance
- −$54
- HOA
- −$0
- Vacancy / Maint / Mgmt
- −$333
- Net cashflow
- $317
Break-even live
Sensitivity live
| Price | -10% $390 | -5% $354 | +0% $317 | +5% $280 | +10% $243 |
|---|---|---|---|---|---|
| Rent | -10% $192 | -5% $254 | +0% $317 | +5% $380 | +10% $442 |
| Rate | -1.0pp $382 | -0.5pp $350 | base $317 | +0.5pp $283 | +1.0pp $249 |
UW: 25.0% down · 7.5% · 30yr · 1.5% tax · 5.0% vac · 8.0% maint · 8.0% mgmt
Financing live
Cash to close
- Down payment
- $32,500
- Closing costs
- $3,900
- Reserves months
- —
- Total cash needed
- —
Loan-product check · same deal, 3 products live
Conventional
25% down · 7.5% · 30yr
- Down + closing
- —
- Monthly P&I
- —
- Monthly cashflow
- —
- DSCR
- —
- Eligible?
- —
Personal DTI + credit; lowest rate.
DSCR
20% down · 8.5% · 30yr
- Down + closing
- —
- Monthly P&I
- —
- Monthly cashflow
- —
- DSCR
- —
- Eligible?
- —
No personal income docs; deal must DSCR.
Hard money
10% down · 12.0% · 12mo
- Down + closing
- —
- Monthly P&I
- —
- Monthly cashflow
- —
- DSCR
- —
- Eligible?
- —
Short-term bridge; refi at stabilization.
Listing history 5 events
-
2026-04-09status Pending
-
2026-03-13status Active
-
2026-01-17historical
-
2025-11-21status Active
-
2025-07-16$130,000 Active
ⓘ Source: listings_history table (triggers on properties + properties_extension) + one-shot
backfill from property_details.listing_events for pre-trigger history.
Tax reassessment forecast NY · Partial reset (capped growth)
- Current annual tax
- $2,399 · $200/mo
- Projected year-2 tax
- $2,399 · $200/mo
- Expected delta
- $0/yr ($0/mo · 0.0%)
ⓘ Screening estimate from a state-policy table — verify with the county assessor before closing.
Climate risk First Street
- Flood 1/10 Low FEMA zone X (unshaded) · 0% chance over 30 yrs
- Wildfire 3/10 Moderate
- Heat 4/10 Moderate 7 d/yr ≥96°F today · 15 d/yr by 30 yrs out
- Wind 4/10 Moderate 17% chance of damaging wind over 30 yrs
- Air quality 3/10 Moderate 2 unhealthy d/yr today · 3 by 30 yrs out
Nearby sold comps map
Loading sold comps map…
Walkable amenities ~0.75 mi
Loading nearby amenities…
Taxation est. · year 1
- Rental income
- $19,029
- − Mortgage interest
- −$7,282
- − Property taxes
- −$2,399
- − Insurance
- −$650
- − Repairs & maintenance
- −$1,522
- − Management
- −$1,522
- − Depreciation
- −$3,782
- Taxable income
- $1,871
- Est. tax owed @ 24.0%
- −$449
- After-tax cash flow
- $3,353/yr
For passive investors: Depreciation is non-cash, so a rental often shows a tax loss while cash-flowing — sheltering income. Rental losses are passive: they offset passive income freely, and up to $25,000/yr can offset ordinary (W-2) income if you actively participate and your MAGI is under $100k (phasing out to $0 by $150k); unused losses carry forward. On sale, claimed depreciation is recaptured at up to 25%, and gains may owe capital-gains tax (a 1031 exchange can defer both). Figures are a year-1 estimate at your 24.0% rate — not tax advice; consult a CPA.
Schools (NCES district)
- District
- Dover Union Free School District
- NCES district ID
- 3609210
- Math proficiency
- 44% ▼ -8.00%
- Reading proficiency
- 48% ▲ 3.00%
- Median HH income
- $58,267
- Composite
- 40.25/100
- National rank
- #3768
- State rank
- #433 of 590 in NY
Livability — Wingdale
No livability data for this city. (Only ~50 U.S. cities are tracked.)
Census & demographics
- Population (ZIP)
- 3,645
Population outlook (Dutchess County) Hauer SSP2
- Today (2025)
- 291,768 people
- By 2030
- 287,131 · -1.6%
- By 2040
- 274,881 · -5.8%
- By 2050
- 259,971 · -10.9%
- By 2075
- 235,366 · -19.3%
- By 2100
- 208,786 · -28.4%
Race, ethnicity, and origin ACS 2023
- Neighborhood character
- Predominantly White (66%)
- Race & ethnicity
- White 66% Hispanic / Latino 21% Black 9% Two or more races 4%
- Hispanic origin (detail)
- Mexican 2% Puerto Rican 10%
- Common ancestry
- Romanian 6% Lithuanian 3% Iranian 1%
- Foreign-born
- 7% · Canada, South Korea, Guatemala
- Languages at home
- 89% English-only · Spanish 11% German/W. Germanic 0%
Political lean MEDSL · Dutchess
- 2024 margin
- Lean D (+5.4) · D 52.7% · R 47.3%
- 2008→2024 swing
- -3.2pp toward R · 2008: 8.6pp · 2024: 5.4pp
- All cycles
- 2024: D+5.4 2020: D+9.6 2016: R+1.1 2012: D+6.6 2008: D+8.6
Not yet ingested
- Civics
- —
Market trends
- HPI YoY
- ▼ -0.14%
- Current HPI
- 249.3328
- Rent YoY
- —
- Metro
- —
- State GDP YoY
- ▲ 2.60%
- F500 in state
- 92
Industry mix (Fortune 500 HQ in NY)
| Industry | F500 HQs | Revenue |
|---|---|---|
| Financial Services | 10 | $950B |
|
||
| Consumer Goods | 9 | $162B |
|
||
| Insurance | 4 | $225B |
|
||
| Telecommunications | 2 | $144B |
|
||
| Pharmaceuticals | 2 | $112B |
|
||
| Media / Entertainment | 2 | $69B |
|
||
Price history
5 events — show timeline
- 2026-04-09 Pending — OneKey® MLS as Distributed by MLS Grid
- 2026-03-13 Relisted — OneKey® MLS as Distributed by MLS Grid
- 2026-01-17 Listing Removed — OneKey® MLS as Distributed by MLS Grid
- 2025-11-21 Relisted — OneKey® MLS as Distributed by MLS Grid
- 2025-07-16 Listed $130,000 OneKey® MLS as Distributed by MLS Grid
Property tax history
-0.2%/yrLatest (2025): $2,399 · -0.3% YoY. Source: county tax records.
Cash-flow waterfall
monthlySold comps — $/sqft
last 12 mo · ≤1 miLoading sold comps…