121 Hollys Eddy Ln · Rosenberg, TX
Flood risk No data
- FEMA flood zone
- —
- Chance of flooding over 30 yrs
- —
- Est. flood insurance / yr
- —
Fire risk No data
- Est. fire insurance / yr
- —
Heat risk No data
- Hot days now (above threshold)
- —
- Hot days in 30 yrs
- —
Wind risk No data
- Chance of severe wind over 30 yrs
- —
Air-quality risk No data
- Unhealthy air days now
- —
- Unhealthy air days in 30 yrs
- —
Risk factors via First Street. Map © Google.
Why this score? — see what drove the B grade
The composite is a weighted blend of 9 inputs, each scored 0–100. Each bar is that input's sub-score; the figure is the points it added to the 100-point composite (weight × sub-score).
- Cash flow +30.0/30.0
- 1% rule +10.0/10.0
- DSCR +10.0/10.0
- ARV discount +7.5/15.0
- Schools +4.6/10.0
- Condition / age +4.0/5.0
- Livability +3.1/5.0
- Rent growth +2.3/5.0
- Appreciation +0.0/10.0
$76,995
🖨 Deal sheet 📄 Offer letter ✓ Due diligence
Listing remarks
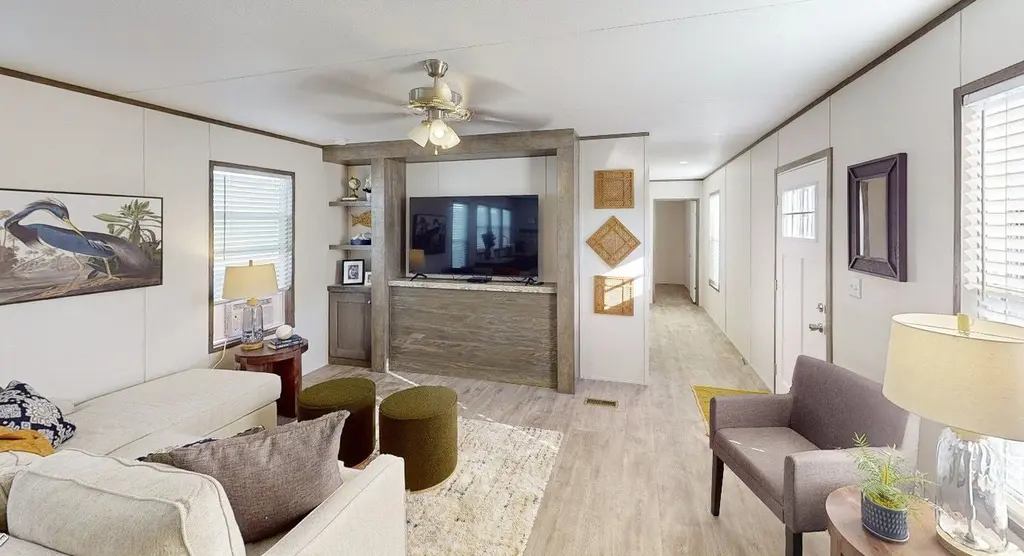
Welcome Home to Easy Living in Rosenberg, TX! Freshly built and thoughtfully designed, this 3-bedroom, 2-bathroom home offers 1,216 sq ft of comfort and convenience in a peaceful new neighborhood. What makes it special: Bright, open living space perfect for hosting or relaxing - Stylish kitchen with modern finishes and room to gather - Private primary suite for your own retreat - Spacious deck for morning coffee or evening chats - Detached 10x10 storage shed for tools, toys, or extras Off-street parking - your spot is always waiting This community is all about low-maintenance living - no busy amenities, just beautiful homes and room to breathe. Located in fast-growing Rosenberg, this is
Key facts
- Stylish kitchen
- Spacious deck
- Open living space
Tags
Property features AI
Finance
- Financial info: List price provided
Exterior
- Utilities: Electric heating and cooling utilities available
- Home design: New construction (spec); Plan name: Wilson
- Construction: Living area approximately 1216 (listed)
- Exterior features: Shake roof
Interior
- Kitchen: Includes dishwasher, refrigerator, and microwave
- Bedrooms: 3 bedrooms
- Bathrooms: 2 full bathrooms
- Heating & cooling: Electric forced-air heating; Central air conditioning; Ceiling fans
- Interior features: Dishwasher; Refrigerator; Microwave
Neighborhood map
What this means for you Summary
Snapshot
- This is a 3-bed/2.0-bath manufactured listed at $77k. Condition is rated good.
Deal economics
- At list price, monthly cash flow is $925 ($11k/yr) — positive.
- The deal already cash-flows at list — no discount required.
- Meets the 1% rule at list price ($2k rent vs $77k).
- Recommended offer: $75k (3.0% below list) — sets the bar for market timing.
- Cap rate 20.7% vs local median 3.4% in Rosenberg — top-decile yield for the area; either an underpriced asset or a hidden risk that comps aren't pricing in. Stress-test before assuming the spread holds.
Location & tenants
- Location reads 62/100 on livability (#922 in TX) — a middle-class / working-renter tenant base. Strengths: cost of living A+, housing A+, crime B; Watch: schools D-, amenities F, commute F.
- Lamar CISD (suburban): math 50% / reading 53% proficiency, ranked #116 of 826 in TX (top 14%) — acceptable for families but not a draw, mixed tenant base, ~2y average lease.
- Market conditions: Rents soft (-1.0%/yr); 716 active listings in the ZIP; 3 comparable units currently listed for rent nearby; rentals at typical pace (median 24d on market — plan ~3-4 weeks tenant-placement turnaround); 12,093 units permitted in Fort Bend County in 2024 (815 in 5+ unit buildings).
- This rent runs 30% of the median local income ($73k/yr) — at the standard rent-burdened threshold; future hikes will face affordability resistance.
Forward outlook
- Local home prices are declining (-3.0%/yr); year-one equity from $532 of loan paydown is wiped out by about $2k of value loss. Plan a longer hold.
- Fort Bend County population projected at +75% by 2050 — long-run rental-demand tailwind backs the buy-and-hold thesis.
- At projected returns (-3.0% appreciation + 0.0% rent growth), your $22k cash investment doubles in ~3 years — after that, you're playing with house money.
Negotiation context
- It's been on market 48 days — a 3% lower offer ($75k) is reasonable based on typical stale-listing flexibility.
Questions for the listing agent
- It's been on market 48 days. Have you received any prior offers? Is the seller open to a 3% concession, seller financing, or rate buy-down credit?
- Is there a deadline driving the sale (1031 exchange, divorce, estate, relocation)? That informs how much negotiation room exists.
- Schools are D-rated, which usually means shorter tenancies and higher turnover. Who's the typical renter profile here, and what's been the actual vacancy rate?
- What's the average days-on-market for RENTAL listings here right now (not sales)? A rising rental-DOM trend means longer vacancies and softer asking-rent achievability than the comps imply.
- What's the recent tenant-quality profile in this submarket — average credit score on applications, eviction rate, late-payment / NSF rate, and stable-employment percentage? A property-management company in the area should have these aggregated.
- How much new for-sale + rental construction is in the pipeline within 1–3 miles? Heavy new supply typically softens prices + rents 12–24 months out; constrained supply supports both.
Investment metrics
- 1% rule
- 2.40% ✓
- Cap rate
- 20.71%
- Cash-on-cash
- 51.50%
- DSCR
- 3.29
- GRM
- 3.5
CMA / ARV
No comps found within radius.
Projected returns pro-forma
-3.0% appreciation · 0.0% rent growth · sell at horizon
- IRR
- 45.9%
- Equity multiple
- 2.91×
- Total profit
- $41,072
- Equity at exit
- $11,480
- IRR
- 50.4%
- Equity multiple
- 5.21×
- Total profit
- $90,863
- Equity at exit
- $6,657
Cash invested: $21,559 (down + closing). Projections, not guarantees.
Landlord ↔ Tenant lean methodology
- Overall (STATE)
- 87 Strongly Landlord-Friendly
- State Texas
- 87 Strongly Landlord-Friendly · R+5
- County
- — inherits STATE
- City
- — inherits STATE
ZIP-level market 77471
- Home prices YoY
- -19.3%
- Rents YoY
- -1.0%
- Active inventory
- 716
- Price-to-rent
- 3.5×
Monthly cashflow live
- Estimated rent
- $1,845 medium interval (Pro) →
- Mortgage (P&I)
- −$404
- Tax est. 1.5%
- −$96 /mo · $1,155/yr
- Insurance
- −$32
- HOA
- −$0
- Vacancy / Maint / Mgmt
- −$387
- Net cashflow
- $925
Break-even live
UW: 25.0% down · 7.5% · 30yr · 1.5% tax · 5.0% vac · 8.0% maint · 8.0% mgmt
Financing live
Cash to close
- Down payment
- $19,249
- Closing costs
- $2,310
- Reserves months
- —
- Total cash needed
- —
Loan-product check · same deal, 3 products live
Conventional
25% down · 7.5% · 30yr
- Down + closing
- —
- Monthly P&I
- —
- Monthly cashflow
- —
- DSCR
- —
- Eligible?
- —
Personal DTI + credit; lowest rate.
DSCR
20% down · 8.5% · 30yr
- Down + closing
- —
- Monthly P&I
- —
- Monthly cashflow
- —
- DSCR
- —
- Eligible?
- —
No personal income docs; deal must DSCR.
Hard money
10% down · 12.0% · 12mo
- Down + closing
- —
- Monthly P&I
- —
- Monthly cashflow
- —
- DSCR
- —
- Eligible?
- —
Short-term bridge; refi at stabilization.
Rent comps 3 comps
| Address | Beds | Baths | Sqft | Rent | $/sqft | DOM | Units | Dist |
|---|---|---|---|---|---|---|---|---|
| 637 Brazos Point Dr Rosenberg, TX | 3.0 | 2.0 | 1140 | $1,850 | $1.62 | 24d | 1 | 0.14mi |
| 1209 Mulcahy St Unit 1205 Rosenberg, TX | 2.0 | 1.0 | 700 | $1,075 | $1.54 | 1d | 1 | 0.89mi |
| 1202 3rd St Rosenberg, TX | 3.0 | 2.0 | 1400 | $1,575 | $1.12 | 24d | 1 | 1.17mi |
Listing history 14 events
-
2026-06-18days on market $76,995 Active 48 DOM
-
2026-06-17days on market $76,995 Active 47 DOM
-
2026-06-16days on market $76,995 Active 46 DOM
-
2026-06-15days on market $76,995 Active 45 DOM
-
2026-06-13days on market $76,995 Active 43 DOM
-
2026-06-10days on market $76,995 Active 39 DOM
-
2026-06-08days on market $76,995 Active 38 DOM
-
2026-06-07days on market $76,995 Active 37 DOM
-
2026-06-04days on market $76,995 Active 34 DOM
-
2026-06-03days on market $76,995 Active 33 DOM
-
2026-06-02days on market $76,995 Active 32 DOM
-
2026-06-01days on market $76,995 Active 31 DOM
-
2026-05-31days on market $76,995 Active 30 DOM
-
2026-05-01$76,995 Active 865-char remark
ⓘ Source: listings_history table (triggers on properties + properties_extension) + one-shot
backfill from property_details.listing_events for pre-trigger history.
Nearby sold comps map
Loading sold comps map…
Walkable amenities ~0.75 mi
Loading nearby amenities…
Taxation est. · year 1
- Rental income
- $22,136
- − Mortgage interest
- −$4,313
- − Property taxes
- −$1,155
- − Insurance
- −$385
- − Repairs & maintenance
- −$1,771
- − Management
- −$1,771
- − Depreciation
- −$2,240
- Taxable income
- $10,502
- Est. tax owed @ 24.0%
- −$2,520
- After-tax cash flow
- $8,582/yr
For passive investors: Depreciation is non-cash, so a rental often shows a tax loss while cash-flowing — sheltering income. Rental losses are passive: they offset passive income freely, and up to $25,000/yr can offset ordinary (W-2) income if you actively participate and your MAGI is under $100k (phasing out to $0 by $150k); unused losses carry forward. On sale, claimed depreciation is recaptured at up to 25%, and gains may owe capital-gains tax (a 1031 exchange can defer both). Figures are a year-1 estimate at your 24.0% rate — not tax advice; consult a CPA.
Condition & rehab AI · 10 photos
This 3-bedroom, 2-bathroom home in Rosenberg, TX is in excellent condition with modern finishes and a low-maintenance design. It offers a bright, open living space and a private primary suite, making it ideal for both resale and rental.
Value-add opportunities
- Both Painting the exterior — Enhances curb appeal and value
- Both Landscaping improvements — Enhances curb appeal and value
- Both Add a smart home system — Improves convenience and marketability
Renovation cost estimate screening
Value-add ROI direction
- Both Painting the exterior — Enhances curb appeal and value ↑
- Both Landscaping improvements — Enhances curb appeal and value ↑
- Both Add a smart home system — Improves convenience and marketability ↑
ⓘ Cost ranges are severity-bucket heuristics (US national rule-of-thumb). Get contractor quotes + a written scope before underwriting a rehab budget.
Schools (NCES district)
- District
- Lamar CISD
- NCES district ID
- 4826580
- Math proficiency
- 50% ▼ -12.00%
- Reading proficiency
- 53% ▼ -4.00%
- Median HH income
- $75,213
- Composite
- 46.43/100
- National rank
- #2452
- State rank
- #116 of 826 in TX
Livability — Rosenberg
- Score
- 62/100
- State rank
- #922
- US rank
- #16414
Category grades
Schools grade is shown separately in the Schools card above.
Census & demographics
- Census place
- Rosenberg, TX
- County
- Fort Bend County · 836,777 people
- City population
- 115,151
- Metro
- Houston-The Woodlands-Sugar Land, TX
- Population (ZIP)
- 45,325
- Household income
- $73,186
- Rent vs Own
- Severe rent burden
- 1688.0
Population outlook (Fort Bend County) Hauer SSP2
- Today (2025)
- 1,004,526 people
- By 2030
- 1,153,104 · +14.8%
- By 2040
- 1,453,718 · +44.7%
- By 2050
- 1,753,781 · +74.6%
- By 2075
- 2,455,772 · +144.5%
- By 2100
- 2,930,528 · +191.7%
Race, ethnicity, and origin ACS 2023
- Neighborhood character
- Diverse neighborhood (Simpson 0.61)
- Race & ethnicity
- Hispanic / Latino 56% White 23% Two or more races 21% Black 12% Asian 7%
- Hispanic origin (detail)
- Mexican 46%
- Common ancestry
- Romanian 1% Lithuanian 1% Slovak 1%
- Foreign-born
- 18% · Canada, China, Vietnam
- Languages at home
- 57% English-only · Spanish 35% Tagalog/Filipino 2% Other Indo-European 1%
Political lean MEDSL · Fort Bend
- 2024 margin
- Toss-up / Even · D 49.5% · R 47.9% · Other 2.6%
- 2008→2024 swing
- +4.0pp toward D · 2008: -2.4pp · 2024: 1.6pp
- All cycles
- 2024: D+1.6 2020: D+10.6 2016: D+6.6 2012: R+6.8 2008: R+2.4
Not yet ingested
- Civics
- —
Market trends
- HPI YoY
- ▼ -74.06%
- Current HPI
- 309.5425
- Rent YoY
- ▼ -0.97%
- Metro
- Houston-The Woodlands-Sugar Land, TX
- State GDP YoY
- ▲ 3.95%
- F500 in state
- 110
Industry mix (Fortune 500 HQ in TX)
| Industry | F500 HQs | Revenue |
|---|---|---|
| Energy | 16 | $1,198B |
|
||
| Technology | 5 | $198B |
|
||
| Engineering / Construction | 4 | $72B |
|
||
| Energy Services | 3 | $60B |
|
||
| Utilities | 3 | $41B |
|
||
| Healthcare | 2 | $330B |
|
||
Cash-flow waterfall
monthlySold comps — $/sqft
last 12 mo · ≤1 miLoading sold comps…