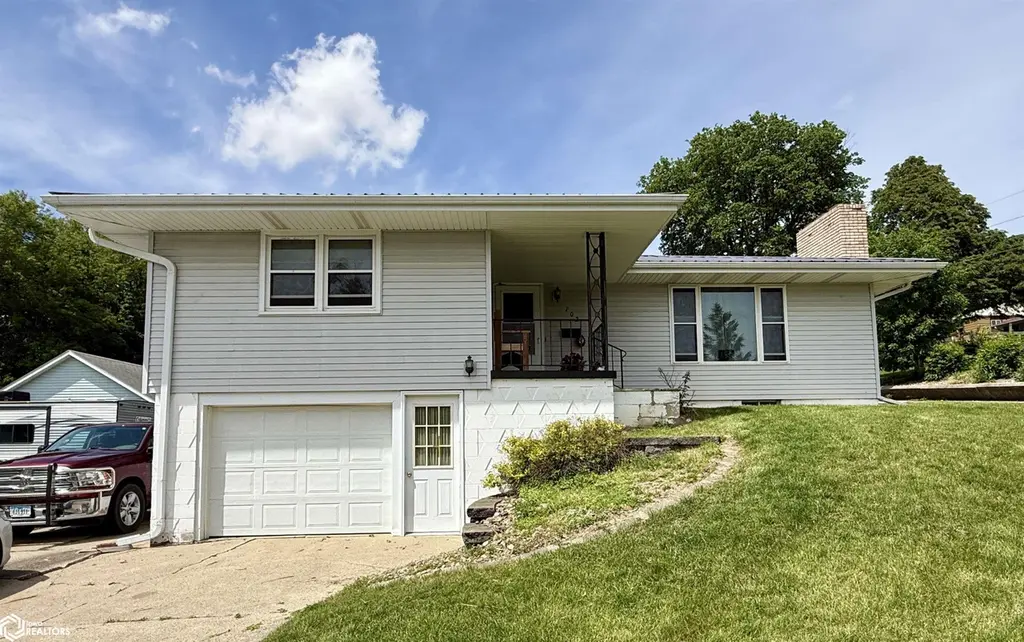
702 Chicago St · Audubon, IA
Flood risk 1/10 · Minimal
- FEMA flood zone
- X (unshaded)
- Chance of flooding over 30 yrs
- 0.0%
- Est. flood insurance / yr
- $473 – $860
Fire risk 1/10 · Minimal
- Est. fire insurance / yr
- $902 – $1,676
Heat risk 2/10 · Minimal
- Hot days now (above 104°F)
- 7 days/yr
- Hot days in 30 yrs
- 15 days/yr
Wind risk 2/10 · Minimal
- Chance of severe wind over 30 yrs
- —
Air-quality risk 1/10 · Minimal
- Unhealthy air days now
- 0 days/yr
- Unhealthy air days in 30 yrs
- 0 days/yr
Risk factors via First Street. Map © Google.
Why this score? — see what drove the C grade
The composite is a weighted blend of 9 inputs, each scored 0–100. Each bar is that input's sub-score; the figure is the points it added to the 100-point composite (weight × sub-score).
- ARV discount +13.6/15.0
- Cash flow +10.7/30.0
- Appreciation +10.0/10.0
- Schools +6.4/10.0
- Livability +4.0/5.0
- DSCR +3.1/10.0
- 1% rule +2.8/10.0
- Rent growth +2.5/5.0
- Condition / age +2.5/5.0
$130,000
🖨 Deal sheet 📄 Offer letter ✓ Due diligence
Listing remarks
If you are considering downsizing or looking for a solid investment opportunity, this property presents an excellent combination of cozy living and practicality. It features two bedrooms and a full bathroom on the main floor, which has been tastefully updated with a new toilet, a modern tub surround, and new flooring. The walk-out basement includes the laundry room, a three-quarter bathroom, and two additional rooms. The attached one-car tuck-under garage offers convenient access to the home. This property is ready for its next owners to personalize it.
Key facts
- 7,420 sq ft lot
- Garage
- Built 1966
Property features AI
Exterior
- Parking: Garage (1 space) with basement access
- Utilities: Public water; Public sewer; 200+ amp electric service with circuit breakers
- Home design: Single-family residence; Residential property
- Construction: Block, frame, and vinyl siding construction; Metal roof
- Exterior features: No fencing; Lot approximately 70 x 106
Interior
- Kitchen: Range; Microwave; Dishwasher; Refrigerator; Disposal; Electric water heater
- Flooring: Carpet; Hardwood; Linoleum
- Bathrooms: One full bathroom; One three-quarter bathroom
- Heating & cooling: Forced air heating; Central air conditioning
- Interior features: Fireplace in the living room (gas); Basement
- Laundry & utility: Washer; Dryer
Neighborhood map
What this means for you Summary
Snapshot
- This is a 2-bed/1.5-bath single-family listed at $130k.
Deal economics
- At list price, monthly cash flow is $-62 ($-742/yr) — negative.
- To cash-flow at today's rent, offer at most $119k (8.4% below list).
- To meet the 1% rule (rent ≥ 1% of price), the offer needs to be $102k (21.6% below list).
- Recommended offer: $102k (21.6% below list) — sets the bar for 1% rule.
Location & tenants
- Location reads 79/100 on livability (#95 in IA, #1,992 nationally) — a middle-class / working-renter tenant base. Strengths: crime A+, cost of living A+, housing A+; Watch: employment D+, amenities F, commute F.
- Audubon Community School District (rural): math 73% / reading 80% proficiency, ranked #64 of 289 in IA (top 22%) — strong family-tenant draw, lease renewals of 3-5y typical.
- Market conditions: 24 active listings in the ZIP; 4 units permitted in Audubon County in 2024 (0 in 5+ unit buildings).
Forward outlook
- In year one you build about $14k of equity ($899 loan paydown + $13k appreciation (10.0% local appreciation)).
- Audubon County population projected at -29% by 2050 — secular population decline; favor cash flow + early exit over multi-decade hold.
- At projected returns (10.0% appreciation + 3.0% rent growth), your $36k cash investment doubles in ~3 years — after that, you're playing with house money.
- By year 3, paydown + projected appreciation supports a ~$35k cash-out refi (75% LTV) — recoverable capital for the next deal without selling this one.
Negotiation context
- It's been on market 22 days — a 2% lower offer ($128k) is reasonable based on typical stale-listing flexibility.
- Current owner paid $50k; list at $130k implies a 163% gain — meaningful room to come down on a strong offer.
Questions for the listing agent
- What do current leases actually rent for vs. the listed asking? Can we see a recent rent roll and the last 12 months of T-12 income?
- Built in 1966 — when were the roof, HVAC, electrical panel, plumbing, and water heater last replaced?
- Is there a deadline driving the sale (1031 exchange, divorce, estate, relocation)? That informs how much negotiation room exists.
- Schools are B-rated — typically a magnet for longer-tenancy family renters. What's the average tenant stay here, and is there a school-zone premium baked into asking?
- What's the average days-on-market for RENTAL listings here right now (not sales)? A rising rental-DOM trend means longer vacancies and softer asking-rent achievability than the comps imply.
- What's the recent tenant-quality profile in this submarket — average credit score on applications, eviction rate, late-payment / NSF rate, and stable-employment percentage? A property-management company in the area should have these aggregated.
- How much new for-sale + rental construction is in the pipeline within 1–3 miles? Heavy new supply typically softens prices + rents 12–24 months out; constrained supply supports both.
Investment metrics
- 1% rule
- 0.78% ✗
- Cap rate
- 5.72%
- Cash-on-cash
- -2.04%
- DSCR
- 0.91
- GRM
- 10.6
CMA / ARV
- ARV (on-the-fly)
- $150,368
- Comps found
- 12
Show comp detail 12 sales within ~0.75 mi
| Address | Dist | Beds/Ba | Sqft | Sold | Price | $/sf | Match |
|---|---|---|---|---|---|---|---|
| 613 Tracy St | 0.30mi | 2/1.0 | 1,204 (+2%) | 0mo | $117,000 | $97 | 81 |
| 911 Broadway St | 0.15mi | 3/2.0 (+1) | 1,144 (-3%) | 8mo | $165,000 | $144 | 74 |
| 206 5th Ave | 0.33mi | 3/2.0 (+1) | 1,152 (-3%) | 8mo | $140,000 | $122 | 66 |
| 619 Tracy St | 0.31mi | 3/2.0 (+1) | 1,218 (+3%) | 11mo | $117,500 | $96 | 65 |
| 505 South St | 0.17mi | 2/2.0 | 1,320 (+12%) | 10mo | $175,000 | $133 | 62 |
| 1012 N Division St | 0.33mi | 3/2.0 (+1) | 1,248 (+5%) | 9mo | $232,000 | $186 | 61 |
| 702 E Division St | 0.38mi | 2/1.0 | 1,302 (+10%) | 4mo | $95,000 | $73 | 60 |
| 313 Mantz Ave | 0.49mi | 3/2.0 (+1) | 1,123 (-5%) | 4mo | $175,000 | $156 | 58 |
| 510 E Division St | 0.27mi | 3/2.0 (+1) | 1,025 (-13%) | 2mo | $165,000 | $161 | 57 |
| 303 Pacific Ave | 0.70mi | 3/1.5 (+1) | 1,238 (+5%) | 3mo | $154,000 | $124 | 52 |
| 500 South St | 0.18mi | 1/2.5 (-1) | 1,008 (-15%) | 8mo | $102,000 | $101 | 51 |
| 202 Walnut St | 0.64mi | 2/2.0 | 1,040 (-12%) | 1mo | $132,500 | $127 | 47 |
Match score weights: distance 35% · size 25% · config 20% · recency 20%. Top-matched comps best support the ARV.
Projected returns pro-forma
10.0% appreciation · 3.0% rent growth · sell at horizon
- IRR
- 22.8%
- Equity multiple
- 2.84×
- Total profit
- $66,859
- Equity at exit
- $117,114
- IRR
- 20.4%
- Equity multiple
- 6.49×
- Total profit
- $199,977
- Equity at exit
- $252,561
Cash invested: $36,400 (down + closing). Projections, not guarantees.
Landlord ↔ Tenant lean methodology
- Overall (STATE)
- 83 Strongly Landlord-Friendly
- State Iowa
- 83 Strongly Landlord-Friendly · R+6
- County
- — inherits STATE
- City
- — inherits STATE
ZIP-level market 50025
- Home prices YoY
- 5.4%
- Active inventory
- 24
- Price-to-rent
- 10.6×
Monthly cashflow live
- Estimated rent
- $1,019 medium interval (Pro) →
- Mortgage (P&I)
- −$682
- Tax from tax record
- −$131 /mo · $1,570/yr
- Insurance
- −$54
- HOA
- −$0
- Vacancy / Maint / Mgmt
- −$214
- Net cashflow
- $-62
Break-even live
UW: 25.0% down · 7.5% · 30yr · 1.5% tax · 5.0% vac · 8.0% maint · 8.0% mgmt
Financing live
Cash to close
- Down payment
- $32,500
- Closing costs
- $3,900
- Reserves months
- —
- Total cash needed
- —
Loan-product check · same deal, 3 products live
Conventional
25% down · 7.5% · 30yr
- Down + closing
- —
- Monthly P&I
- —
- Monthly cashflow
- —
- DSCR
- —
- Eligible?
- —
Personal DTI + credit; lowest rate.
DSCR
20% down · 8.5% · 30yr
- Down + closing
- —
- Monthly P&I
- —
- Monthly cashflow
- —
- DSCR
- —
- Eligible?
- —
No personal income docs; deal must DSCR.
Hard money
10% down · 12.0% · 12mo
- Down + closing
- —
- Monthly P&I
- —
- Monthly cashflow
- —
- DSCR
- —
- Eligible?
- —
Short-term bridge; refi at stabilization.
Listing history 17 events
-
2026-06-18days on market $130,000 Active 22 DOM
-
2026-06-17days on market $130,000 Active 21 DOM
-
2026-06-16days on market $130,000 Active 20 DOM
-
2026-06-15days on market $130,000 Active 19 DOM
-
2026-06-13days on market $130,000 Active 17 DOM
-
2026-06-12days on market $130,000 Active 16 DOM
-
2026-06-09days on market $130,000 Active 13 DOM
-
2026-06-08days on market $130,000 Active 12 DOM
-
2026-06-07days on market $130,000 Active 11 DOM
-
2026-06-05days on market $130,000 Active 9 DOM
-
2026-06-04days on market $130,000 Active 7 DOM
-
2026-06-02days on market $130,000 Active 6 DOM
-
2026-06-01days on market $130,000 Active 5 DOM
-
2026-05-31days on market $130,000 Active 4 DOM
-
2026-05-31days on market $130,000 Active 3 DOM
-
2026-05-27$130,000 Active
-
2010-03-12soldstatus $49,500
ⓘ Source: listings_history table (triggers on properties + properties_extension) + one-shot
backfill from property_details.listing_events for pre-trigger history.
Tax reassessment forecast IA · Partial reset (capped growth)
- Current annual tax
- $1,570 · $131/mo
- Projected year-2 tax
- $1,806 · $150/mo
- Expected delta
- +$236/yr (+$20/mo · 15.0%)
ⓘ Screening estimate from a state-policy table — verify with the county assessor before closing.
Climate risk First Street
- Flood 1/10 Low FEMA zone X (unshaded) · 0% chance over 30 yrs
- Wildfire 1/10 Low
- Heat 2/10 Low 7 d/yr ≥104°F today · 15 d/yr by 30 yrs out
- Wind 2/10 Low
- Air quality 1/10 Low 0 unhealthy d/yr today · 0 by 30 yrs out
Nearby sold comps map
Loading sold comps map…
Walkable amenities ~0.75 mi
Loading nearby amenities…
Taxation est. · year 1
- Rental income
- $12,226
- − Mortgage interest
- −$7,282
- − Property taxes
- −$1,570
- − Insurance
- −$650
- − Repairs & maintenance
- −$978
- − Management
- −$978
- − Depreciation
- −$3,782
- Taxable loss
- −$3,014
- Est. tax savings @ 24.0%
- +$723
- After-tax cash flow
- $-19/yr
For passive investors: Depreciation is non-cash, so a rental often shows a tax loss while cash-flowing — sheltering income. Rental losses are passive: they offset passive income freely, and up to $25,000/yr can offset ordinary (W-2) income if you actively participate and your MAGI is under $100k (phasing out to $0 by $150k); unused losses carry forward. On sale, claimed depreciation is recaptured at up to 25%, and gains may owe capital-gains tax (a 1031 exchange can defer both). Figures are a year-1 estimate at your 24.0% rate — not tax advice; consult a CPA.
Schools (NCES district)
- District
- Audubon Community School District
- NCES district ID
- 1903960
- Math proficiency
- 73% ▲ 4.00%
- Reading proficiency
- 80% ▲ 7.00%
- Median HH income
- $45,632
- Composite
- 64.32/100
- National rank
- #552
- State rank
- #64 of 289 in IA
Livability — Audubon
- Score
- 79/100
- State rank
- #95
- US rank
- #1992
Category grades
Schools grade is shown separately in the Schools card above.
Census & demographics
- Census place
- Audubon, IA
- Population (ZIP)
- 2,893
Population outlook (Audubon County) Hauer SSP2
- Today (2025)
- 5,157 people
- By 2030
- 4,837 · -6.2%
- By 2040
- 4,241 · -17.8%
- By 2050
- 3,679 · -28.7%
- By 2075
- 2,917 · -43.4%
- By 2100
- 2,408 · -53.3%
Race, ethnicity, and origin ACS 2023
- Neighborhood character
- Predominantly White (94%)
- Race & ethnicity
- White 94% Two or more races 3% Hispanic / Latino 2%
- Common ancestry
- Iranian 3% Portuguese 2% Italian 1%
- Foreign-born
- 1% · Canada
- Languages at home
- 99% English-only · Spanish 1%
Political lean MEDSL · Audubon
- 2024 margin
- Solid R (+38.4) · D 29.9% · R 68.3% · Other 1.7%
- 2008→2024 swing
- -41.5pp toward R · 2008: 3.1pp · 2024: -38.4pp
- All cycles
- 2024: R+38.4 2020: R+35.8 2016: R+31.2 2012: R+5.6 2008: D+3.1
Not yet ingested
- Civics
- —
Market trends
- HPI YoY
- ▲ 11.14%
- Current HPI
- 217.58
- Rent YoY
- —
- Metro
- —
- State GDP YoY
- ▲ 2.48%
- F500 in state
- 4
Industry mix (Fortune 500 HQ in IA)
| Industry | F500 HQs | Revenue |
|---|---|---|
| Financial Services | 1 | $16B |
|
||
| Retail / Convenience | 1 | $15B |
|
||
Price history
+162.6% since first listed2 events — show timeline
- 2026-05-27 Listed $130,000 IAR
- 2010-03-12 Sold (Public Records) $49,500 Public Records
Property tax history
+4.0%/yrLatest (2025): $1,570 · -10.7% YoY. Source: county tax records.
Cash-flow waterfall
monthlySold comps — $/sqft
last 12 mo · ≤1 miLoading sold comps…