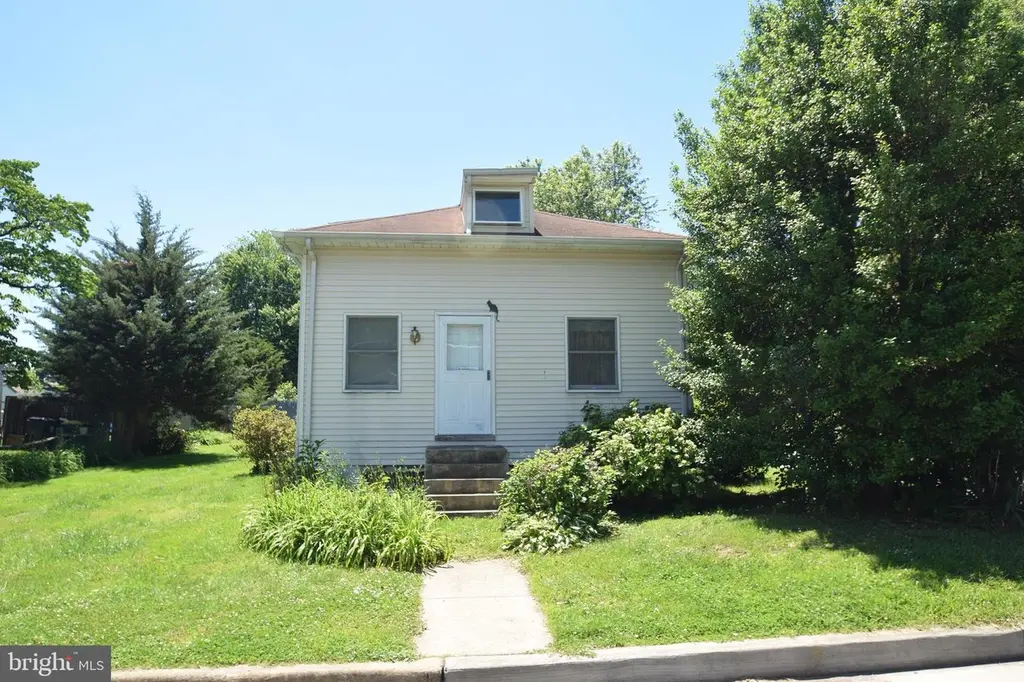
1000 Highland Ave · Bellefonte, DE
Flood risk 1/10 · Minimal
- FEMA flood zone
- X (unshaded)
- Chance of flooding over 30 yrs
- 0.0%
- Est. flood insurance / yr
- $473 – $860
Fire risk 1/10 · Minimal
- Est. fire insurance / yr
- $476 – $884
Heat risk 7/10 · Major
- Hot days now (above 104°F)
- 7 days/yr
- Hot days in 30 yrs
- 15 days/yr
Wind risk 6/10 · Moderate
- Chance of severe wind over 30 yrs
- 27.0%
Air-quality risk 3/10 · Minor
- Unhealthy air days now
- 2 days/yr
- Unhealthy air days in 30 yrs
- 3 days/yr
Risk factors via First Street. Map © Google.
Why this score? — see what drove the D+ grade
The composite is a weighted blend of 9 inputs, each scored 0–100. Each bar is that input's sub-score; the figure is the points it added to the 100-point composite (weight × sub-score).
- ARV discount +15.0/15.0
- Cash flow +13.0/30.0
- Rent growth +4.0/5.0
- DSCR +3.9/10.0
- Livability +3.8/5.0
- Schools +3.1/10.0
- 1% rule +2.9/10.0
- Condition / age +2.5/5.0
- Appreciation +0.0/10.0
$249,000
🖨 Deal sheet 📄 Offer letter ✓ Due diligence
Listing remarks
Take advantage of this 2 bedroom, 1 1/2 story home in the town of Bellefonte! Large living room, kitchen with gas stovetop on center island and more. Full stairway to unfinished attic, which could be converted to den, office or 2 additional bedrooms. Taxes include local Bellefonte tax ($261.00) which covers trash pick up and snow removal. Close to major roads, state parks and restaurants. This home is in need of TLC and renovation. Being sold in its present "AS IS" condition with no warranties. Shed is excluded.
Key facts
- Close to state parks
- Close to restaurants
- Gas stovetop
Tags
Property features AI
Finance
- Other: Lot dimensions approximately 50 x 100; Ground rent paid annually
- Financial info: Ownership: Fee simple; Property condition: Major rehab needed
Exterior
- Parking: On-street parking
- Utilities: Public water; Public sewer; Natural gas for heat and hot water; Cable TV available; Municipal trash service
- Home design: Detached property; Main entrance faces northeast
- Construction: Aluminum siding; Stone foundation; Asphalt shingle roof; Insulated windows; Building not winterized; Year built (assessor)
- Exterior features: Corner lot; Deck(s); Shed; Above-grade and below-grade outdoor structures; Not in a federal flood zone
Interior
- Kitchen: Kitchen island; Galley-style kitchen; Combination kitchen/dining
- Bedrooms: 2 bedrooms on main level; Rooms include: Living Room, Dining Room, Family Room, Kitchen, Bedroom 1, Bedroom 2
- Bathrooms: 2 full bathrooms on main level; 2 full bathrooms total
- Heating & cooling: 90% efficient forced air heating; Natural gas heating and hot water
- Interior features: Ceiling fans; Combination kitchen and dining area; Galley kitchen layout; Kitchen island; Traditional floor plan; Attic; Drywall and plaster walls; Full basement
- Laundry & utility: Washer included; Laundry area in basement
Neighborhood map
What this means for you Summary
Snapshot
- This is a 2-bed/1.0-bath single-family listed at $249k.
Deal economics
- At list price, monthly cash flow is $-16 ($-189/yr) — negative.
- To cash-flow at today's rent, offer at most $246k (1.1% below list).
- To meet the 1% rule (rent ≥ 1% of price), the offer needs to be $196k (21.3% below list).
- Recommended offer: $196k (21.3% below list) — sets the bar for 1% rule.
Location & tenants
- Location reads 75/100 on livability (#6 in DE, #4,252 nationally) — a middle-class / working-renter tenant base. Strengths: crime A+, housing A+, employment A; Watch: amenities F, commute F, health & safety D-.
- Brandywine School District (suburban): math 28% / reading 40% proficiency, ranked #11 of 26 in DE (top 42%) — families likely to look elsewhere, expect single-tenant / working-renter base with shorter leases.
- Zoned schools: Mount Pleasant Elementary School (math 37% / reading 37%, grade F, #31 of 105 statewide, top 31%, 704 students, 0% FRL); Dupont (Pierre S.) Middle School (math 40% / reading 50%, grade D, #4 of 36 statewide, top 11%, 821 students, 0% FRL); Mount Pleasant High School (math 27% / reading 57%, grade F, #10 of 40 statewide, top 26%, 1,107 students, 0% FRL) — zoned schools average 0% FRL vs 38% district-wide (38 pts lower); this property's tenant base skews higher-income than the district average.
- Market conditions: Rents rising fast (+6.2%/yr); 48 active listings in the ZIP; 2 comparable units currently listed for rent nearby; solid renter incomes; 1,367 units permitted in New Castle County in 2024 (201 in 5+ unit buildings).
Forward outlook
- Local home prices are declining (-3.0%/yr); year-one equity from $2k of loan paydown is wiped out by about $7k of value loss. Plan a longer hold.
- New Castle County population projected at +9% by 2050 — modest demand growth; plan on rents tracking national, not racing it.
Negotiation context
- It's been on market 15 days — a 2% lower offer ($245k) is reasonable based on typical stale-listing flexibility.
- Current owner paid $18k; list at $249k implies a 1246% gain — meaningful room to come down on a strong offer.
Risks & watch-outs
- Watch-outs: built in 1923 — expect roof / HVAC / electrical / plumbing capex.
- Climate carrying-cost: major wind risk, 27% chance of damaging wind over 30y; extreme-heat days projected 7→15/yr by 2055 (HVAC capex compounding) — expect insurance premiums to compound above CPI over the hold.
Questions for the listing agent
- What do current leases actually rent for vs. the listed asking? Can we see a recent rent roll and the last 12 months of T-12 income?
- Built in 1923 — when were the roof, HVAC, electrical panel, plumbing, and water heater last replaced?
- Is there a deadline driving the sale (1031 exchange, divorce, estate, relocation)? That informs how much negotiation room exists.
- The area grade is low — what's the realistic commute time and amenity access for the typical tenant pool here? Any planned neighborhood developments (good or bad) we should know about?
- What's the average days-on-market for RENTAL listings here right now (not sales)? A rising rental-DOM trend means longer vacancies and softer asking-rent achievability than the comps imply.
- What's the recent tenant-quality profile in this submarket — average credit score on applications, eviction rate, late-payment / NSF rate, and stable-employment percentage? A property-management company in the area should have these aggregated.
- How much new for-sale + rental construction is in the pipeline within 1–3 miles? Heavy new supply typically softens prices + rents 12–24 months out; constrained supply supports both.
Investment metrics
- 1% rule
- 0.79% ✗
- Cap rate
- 6.22%
- Cash-on-cash
- -0.27%
- DSCR
- 0.99
- GRM
- 10.6
CMA / ARV
- ARV (on-the-fly)
- $412,275
- Comps found
- 12
Show comp detail 12 sales within ~0.75 mi
| Address | Dist | Beds/Ba | Sqft | Sold | Price | $/sf | Match |
|---|---|---|---|---|---|---|---|
| 1108 Prospect Ave | 0.11mi | 3/1.5 (+1) | 1,600 (-7%) | 2mo | $390,000 | $244 | 74 |
| 1100 Grandview Ave | 0.11mi | 3/1.0 (+1) | 1,800 (+4%) | 12mo | $395,000 | $219 | 73 |
| 206 School House Ln | 0.32mi | 3/2.0 (+1) | 1,675 (-3%) | 7mo | $397,703 | $237 | 66 |
| 1213 Talley Rd | 0.24mi | 3/2.5 (+1) | 1,525 (-12%) | 3mo | $396,550 | $260 | 56 |
| 805 Woodsdale Rd | 0.70mi | 3/2.0 (+1) | 1,725 (0%) | 4mo | $449,900 | $261 | 55 |
| 902 Philadelphia Pike | 0.49mi | 3/2.5 (+1) | 1,800 (+4%) | 7mo | $460,000 | $256 | 53 |
| 3 Corinne Ct | 0.52mi | 3/2.0 (+1) | 1,650 (-4%) | 12mo | $395,000 | $239 | 50 |
| 708 Sonora Ave | 0.51mi | 3/2.0 (+1) | 1,800 (+4%) | 14mo | $385,100 | $214 | 48 |
| 11 Beverly Pl | 0.64mi | 3/1.5 (+1) | 1,525 (-12%) | 10mo | $315,000 | $207 | 36 |
| 512 Lennox Rd | 0.72mi | 3/2.5 (+1) | 1,975 (+14%) | 1mo | $460,000 | $233 | 30 |
| 1500 River Rd | 0.38mi | 3/2.0 (+1) | 1,975 (+14%) | 23mo | $474,900 | $240 | 30 |
| 5506 Washington St Ext | 0.56mi | 3/1.5 (+1) | 1,500 (-13%) | 22mo | $310,000 | $207 | 26 |
Match score weights: distance 35% · size 25% · config 20% · recency 20%. Top-matched comps best support the ARV.
Projected returns pro-forma
-3.0% appreciation · 6.18% rent growth · sell at horizon
- IRR
- -13.6%
- Equity multiple
- 0.50×
- Total profit
- $-34,949
- Equity at exit
- $37,127
- IRR
- -0.7%
- Equity multiple
- 0.95×
- Total profit
- $-3,647
- Equity at exit
- $21,529
Cash invested: $69,720 (down + closing). Projections, not guarantees.
Landlord ↔ Tenant lean methodology
- Overall (STATE)
- 70 Landlord-Friendly
- State Delaware
- 70 Landlord-Friendly · D+7
- County
- — inherits STATE
- City
- — inherits STATE
ZIP-level market 19809
- Rents YoY
- 6.2%
- Active inventory
- 48
- Price-to-rent
- 10.6×
Monthly cashflow live
- Estimated rent
- $1,960 medium interval (Pro) →
- Mortgage (P&I)
- −$1,306
- Tax from tax record
- −$155 /mo · $1,858/yr
- Insurance
- −$104
- HOA
- −$0
- Vacancy / Maint / Mgmt
- −$412
- Net cashflow
- $-16
Break-even live
UW: 25.0% down · 7.5% · 30yr · 1.5% tax · 5.0% vac · 8.0% maint · 8.0% mgmt
Financing live
Cash to close
- Down payment
- $62,250
- Closing costs
- $7,470
- Reserves months
- —
- Total cash needed
- —
Loan-product check · same deal, 3 products live
Conventional
25% down · 7.5% · 30yr
- Down + closing
- —
- Monthly P&I
- —
- Monthly cashflow
- —
- DSCR
- —
- Eligible?
- —
Personal DTI + credit; lowest rate.
DSCR
20% down · 8.5% · 30yr
- Down + closing
- —
- Monthly P&I
- —
- Monthly cashflow
- —
- DSCR
- —
- Eligible?
- —
No personal income docs; deal must DSCR.
Hard money
10% down · 12.0% · 12mo
- Down + closing
- —
- Monthly P&I
- —
- Monthly cashflow
- —
- DSCR
- —
- Eligible?
- —
Short-term bridge; refi at stabilization.
Rent comps 2 comps
| Address | Beds | Baths | Sqft | Rent | $/sqft | DOM | Units | Dist |
|---|---|---|---|---|---|---|---|---|
| 240 Philadelphia Pike Wilmington, DE | 3.0 | 2.0 | 1400 | $2,100 | $1.50 | 2d | 1 | 0.82mi |
| 2 Colony Blvd Wilmington, DE | 1.0–2.0 | 1.0–2.0 | 1112 | $2,500 | $2.25 | 1d | 6 | 1.32mi |
Listing history 11 events
-
2026-06-18days on market $249,000 Active 15 DOM
-
2026-06-17days on market $249,000 Active 14 DOM
-
2026-06-16days on market $249,000 Active 13 DOM
-
2026-06-16price $249,000 Active 12 DOM
-
2026-06-15days on market $274,900 Active 12 DOM
-
2026-06-13days on market $274,900 Active 10 DOM
-
2026-06-09days on market $274,900 Active 6 DOM
-
2026-06-08days on market $274,900 Active 5 DOM
-
2026-06-07days on market $274,900 Active 4 DOM
-
2026-06-04remarks 517-char remark
-
2026-06-04$274,900 Active 1 DOM
ⓘ Source: listings_history table (triggers on properties + properties_extension) + one-shot
backfill from property_details.listing_events for pre-trigger history.
Tax reassessment forecast DE · Partial reset (capped growth)
- Current annual tax
- $1,858 · $155/mo
- Projected year-2 tax
- $1,858 · $155/mo
- Expected delta
- $0/yr ($0/mo · 0.0%)
ⓘ Screening estimate from a state-policy table — verify with the county assessor before closing.
Climate risk First Street
- Flood 1/10 Low FEMA zone X (unshaded) · 0% chance over 30 yrs
- Wildfire 1/10 Low
- Heat 7/10 Severe 7 d/yr ≥104°F today · 15 d/yr by 30 yrs out
- Wind 6/10 Major 27% chance of damaging wind over 30 yrs
- Air quality 3/10 Moderate 2 unhealthy d/yr today · 3 by 30 yrs out
Nearby sold comps map
Loading sold comps map…
Walkable amenities ~0.75 mi
Loading nearby amenities…
Taxation est. · year 1
- Rental income
- $23,523
- − Mortgage interest
- −$13,948
- − Property taxes
- −$1,858
- − Insurance
- −$1,245
- − Repairs & maintenance
- −$1,882
- − Management
- −$1,882
- − Depreciation
- −$7,244
- Taxable loss
- −$4,535
- Est. tax savings @ 24.0%
- +$1,088
- After-tax cash flow
- $899/yr
For passive investors: Depreciation is non-cash, so a rental often shows a tax loss while cash-flowing — sheltering income. Rental losses are passive: they offset passive income freely, and up to $25,000/yr can offset ordinary (W-2) income if you actively participate and your MAGI is under $100k (phasing out to $0 by $150k); unused losses carry forward. On sale, claimed depreciation is recaptured at up to 25%, and gains may owe capital-gains tax (a 1031 exchange can defer both). Figures are a year-1 estimate at your 24.0% rate — not tax advice; consult a CPA.
Schools (NCES district)
- District
- Brandywine School District
- NCES district ID
- 1001240
- Math proficiency
- 28% ▼ -13.00%
- Reading proficiency
- 40% ▼ -13.00%
- Median HH income
- $68,743
- Composite
- 31.27/100
- National rank
- #6019
- State rank
- #11 of 26 in DE
Livability — Bellefonte
- Score
- 75/100
- State rank
- #6
- US rank
- #4252
Category grades
Schools grade is shown separately in the Schools card above.
Census & demographics
- Census place
- Bellefonte, DE
- County
- New Castle County · 483,412 people
- Metro
- Philadelphia-Camden-Wilmington, PA-NJ-DE-MD
- Population (ZIP)
- 14,311
- Household income
- $81,288
- Rent vs Own
- Severe rent burden
- 468.0
Population outlook (New Castle County) Hauer SSP2
- Today (2025)
- 594,686 people
- By 2030
- 609,164 · +2.4%
- By 2040
- 632,154 · +6.3%
- By 2050
- 649,068 · +9.1%
- By 2075
- 687,771 · +15.7%
- By 2100
- 694,961 · +16.9%
Race, ethnicity, and origin ACS 2023
- Neighborhood character
- Majority White (64%)
- Race & ethnicity
- White 64% Black 24% Two or more races 6% Asian 4% Hispanic / Latino 4%
- Common ancestry
- Romanian 6% Lithuanian 2% Slovak 1%
- Foreign-born
- 6% · Canada, China
- Languages at home
- 93% English-only · Spanish 2% Tagalog/Filipino 1% Other Asian/Pacific 1%
Political lean MEDSL · New Castle
- 2024 margin
- Solid D (+32.6) · D 65.5% · R 32.9% · Other 1.6%
- 2008→2024 swing
- -8.1pp toward R · 2008: 40.6pp · 2024: 32.6pp
- All cycles
- 2024: D+32.6 2020: D+37.1 2016: D+29.6 2012: D+34.1 2008: D+40.6
Not yet ingested
- Civics
- —
Market trends
- HPI YoY
- ▼ -153.39%
- Current HPI
- 232.6107
- Rent YoY
- ▲ 6.18%
- Metro
- Philadelphia-Camden-Wilmington, PA-NJ-DE-MD
- State GDP YoY
- —
- F500 in state
- 0
Price history
+1385.9% since first listed2 events — show timeline
- 2026-06-03 Listed $274,900 BRIGHT MLS
- 1979-03-01 Sold (Public Records) $18,500 Public Records
Property tax history
+2.0%/yrLatest (2024): $1,858 · +9.3% YoY. Source: county tax records.
Cash-flow waterfall
monthlySold comps — $/sqft
last 12 mo · ≤1 miLoading sold comps…