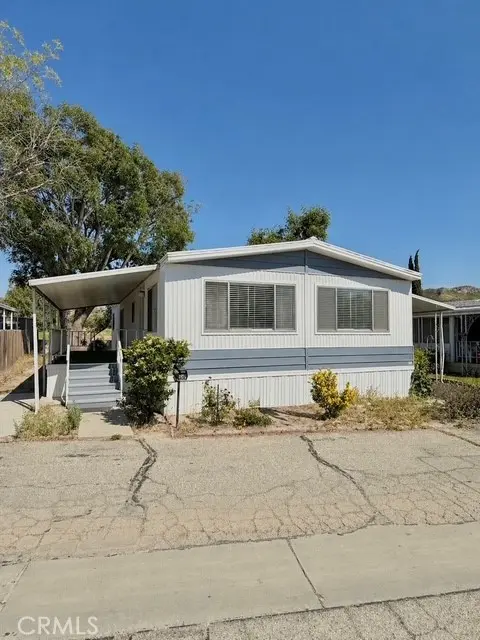
16274 Vasquez Canyon Rd #52 · Santa Clarita, CA
Flood risk 1/10 · Minimal
- FEMA flood zone
- X (unshaded)
- Chance of flooding over 30 yrs
- 0.0%
- Est. flood insurance / yr
- $507 – $1,088
Fire risk 9/10 · Severe
- Est. fire insurance / yr
- $659 – $1,223
Heat risk 7/10 · Major
- Hot days now (above 98°F)
- 7 days/yr
- Hot days in 30 yrs
- 18 days/yr
Wind risk 1/10 · Minimal
- Chance of severe wind over 30 yrs
- —
Air-quality risk 9/10 · Severe
- Unhealthy air days now
- 22 days/yr
- Unhealthy air days in 30 yrs
- 26 days/yr
Risk factors via First Street. Map © Google.
Why this score? — see what drove the B+ grade
The composite is a weighted blend of 9 inputs, each scored 0–100. Each bar is that input's sub-score; the figure is the points it added to the 100-point composite (weight × sub-score).
- Cash flow +30.0/30.0
- ARV discount +14.5/15.0
- DSCR +10.0/10.0
- 1% rule +8.6/10.0
- Schools +5.9/10.0
- Condition / age +4.0/5.0
- Livability +3.5/5.0
- Rent growth +2.9/5.0
- Appreciation +0.0/10.0
$215,000
🖨 Deal sheet 📄 Offer letter ✓ Due diligence
Listing remarks
Beautifully remodeled 2-bedroom, 2-bath home located at 16274 Vasquez Canyon Road! Thoughtfully updated throughout, this home offers a fresh, modern feel with quality upgrades in every room including new flooring. The kitchen has been completely renovated with brand-new cabinets, stunning quartz countertops with a full subway tiled backsplash, and all-new stainless steel appliances, LED recessed lighting. Both bathrooms have been refreshed with new vanities, lighting, mirrors and accessories adding a clean and contemporary touch to the space. It has brand new flooring, new roof, brand new heating and air conditioning unit (HVAC), lighting, new freshly painted inside and out. This home has a
Key facts
- Brand-new cabinets
- Updated throughout
- New flooring
Tags
Property features AI
Finance
- Other: Park name: Canyon Country Mobile
- HOA & community: Land lease of $1,030
Exterior
- Parking: Located in Canyon Country Mobile park
- Utilities: Public sewer; District/Public water
- Home design: Single-story mobile home; Entry on street level; Mobile home remains on site
- Construction: Mobile home dimensions approximately 56' x 24'; Total of 1 story; Year built information: other
- Exterior features: Community pool; Yard; Street lighting in the community
Interior
- Bathrooms: 2 full bathrooms
- Interior features: Street-level entry; One-level layout
- Laundry & utility: Washer hookup; Gas dryer hookup
Neighborhood map
What this means for you Summary
Snapshot
- This is a 2-bed/2.0-bath manufactured listed at $215k. Condition is rated good.
Deal economics
- At list price, monthly cash flow is $1k ($13k/yr) — positive.
- The deal already cash-flows at list — no discount required.
- Meets the 1% rule at list price ($3k rent vs $215k).
- Recommended offer: $202k (6.0% below list) — sets the bar for market timing.
- Cap rate 12.1% vs local median 2.8% in Santa Clarita — top-decile yield for the area; either an underpriced asset or a hidden risk that comps aren't pricing in. Stress-test before assuming the spread holds.
Location & tenants
- Location reads 70/100 on livability (#229 in CA) — a middle-class / working-renter tenant base. Strengths: employment A+, housing A, crime A-; Watch: amenities D+, cost of living F, health & safety F.
- William S. Hart Union High (suburban): math 52% / reading 72% proficiency, ranked #155 of 1,400 in CA (top 11%) — acceptable for families but not a draw, mixed tenant base, ~2y average lease; only 18% free/reduced lunch — higher-income household profile.
- Market conditions: Rents rising (+1.7%/yr); 106 active listings in the ZIP; high-income renter base; 19,697 units permitted in Los Angeles County in 2024 (9,426 in 5+ unit buildings).
- This rent runs 30% of the median local income ($115k/yr) — at the standard rent-burdened threshold; future hikes will face affordability resistance.
Forward outlook
- Local home prices are declining (-3.0%/yr); year-one equity from $1k of loan paydown is wiped out by about $6k of value loss. Plan a longer hold.
- Los Angeles County population projected at +9% by 2050 — modest demand growth; plan on rents tracking national, not racing it.
- At projected returns (-3.0% appreciation + 1.7% rent growth), your $60k cash investment doubles in ~7 years — after that, you're playing with house money.
Negotiation context
- It's been on market 66 days — a 6% lower offer ($202k) is reasonable based on typical stale-listing flexibility.
- 3 sale attempts with the ask held roughly flat each time — persistent listings suggest the price (not the market) is what's stuck; bring a comps-based counter.
Risks & watch-outs
- Climate carrying-cost: severe wildfire risk; extreme-heat days projected 7→18/yr by 2055 (HVAC capex compounding) — expect insurance premiums to compound above CPI over the hold.
Questions for the listing agent
- It's been on market 66 days. Have you received any prior offers? Is the seller open to a 6% concession, seller financing, or rate buy-down credit?
- Built in 1975 — when were the roof, HVAC, electrical panel, plumbing, and water heater last replaced?
- Why hasn't it sold? Are there any deal-killer items the seller is aware of (foundation, flood, title, zoning, code violations)?
- Is there a deadline driving the sale (1031 exchange, divorce, estate, relocation)? That informs how much negotiation room exists.
- Schools are B-rated — typically a magnet for longer-tenancy family renters. What's the average tenant stay here, and is there a school-zone premium baked into asking?
- What's the average days-on-market for RENTAL listings here right now (not sales)? A rising rental-DOM trend means longer vacancies and softer asking-rent achievability than the comps imply.
- What's the recent tenant-quality profile in this submarket — average credit score on applications, eviction rate, late-payment / NSF rate, and stable-employment percentage? A property-management company in the area should have these aggregated.
- How much new for-sale + rental construction is in the pipeline within 1–3 miles? Heavy new supply typically softens prices + rents 12–24 months out; constrained supply supports both.
Investment metrics
- 1% rule
- 1.36% ✓
- Cap rate
- 12.13%
- Cash-on-cash
- 20.86%
- DSCR
- 1.93
- GRM
- 6.1
CMA / ARV
- ARV (on-the-fly)
- $254,880
- Comps found
- 9
Show comp detail 9 sales within ~0.75 mi
| Address | Dist | Beds/Ba | Sqft | Sold | Price | $/sf | Match |
|---|---|---|---|---|---|---|---|
| 16274 Vazquez Cyn #19 | 0.00mi | 3/2.0 (+1) | 1,344 (-7%) | 8mo | $250,000 | $186 | 77 |
| 16274 Vazquez Cyn Rd | 0.00mi | 3/2.0 (+1) | 1,400 (-3%) | 16mo | $165,000 | $118 | 77 |
| 16274 Vasquez Canyon Rd #27 | 0.00mi | 2/2.0 | 1,248 (-13%) | 12mo | $165,000 | $132 | 68 |
| 16274 VASQUEZ CANYON Rd #45 | 0.00mi | 3/2.0 (+1) | 1,248 (-13%) | 8mo | $150,000 | $120 | 66 |
| 30000 Sand Cyn #95 | 0.44mi | 3/2.0 (+1) | 1,368 (-5%) | 18mo | $242,300 | $177 | 51 |
| 30000 Sand Canyon Rd #102 | 0.44mi | 3/2.0 (+1) | 1,368 (-5%) | 23mo | $250,000 | $183 | 47 |
| 30000 Sand Canyon Rd #105 | 0.44mi | 2/2.0 | 1,272 (-12%) | 16mo | $210,000 | $165 | 47 |
| 30000 Sand Canyon Rd #20 | 0.44mi | 3/2.0 (+1) | 1,599 (+11%) | 23mo | $283,000 | $177 | 37 |
| 30000 Sand Canyon Rd #47 | 0.44mi | 3/2.0 (+1) | 1,248 (-13%) | 18mo | $241,000 | $193 | 37 |
Match score weights: distance 35% · size 25% · config 20% · recency 20%. Top-matched comps best support the ARV.
Projected returns pro-forma
-3.0% appreciation · 1.7% rent growth · sell at horizon
- IRR
- 11.9%
- Equity multiple
- 1.46×
- Total profit
- $27,935
- Equity at exit
- $32,057
- IRR
- 19.8%
- Equity multiple
- 2.57×
- Total profit
- $94,688
- Equity at exit
- $18,589
Cash invested: $60,200 (down + closing). Projections, not guarantees.
Landlord ↔ Tenant lean methodology
- Overall (STATE)
- 18 Strongly Tenant-Friendly
- State California
- 18 Strongly Tenant-Friendly · D+13
- County
- — inherits STATE
- City
- — inherits STATE
ZIP-level market 91351
- Rents YoY
- 1.7%
- Active inventory
- 106
- Price-to-rent
- 6.1×
Monthly cashflow live
- Estimated rent
- $2,916 medium interval (Pro) →
- Mortgage (P&I)
- −$1,127
- Tax from tax record
- −$40 /mo · $480/yr
- Insurance
- −$90
- HOA
- −$0
- Vacancy / Maint / Mgmt
- −$612
- Net cashflow
- $1,046
Break-even live
UW: 25.0% down · 7.5% · 30yr · 1.5% tax · 5.0% vac · 8.0% maint · 8.0% mgmt
Financing live
Cash to close
- Down payment
- $53,750
- Closing costs
- $6,450
- Reserves months
- —
- Total cash needed
- —
Loan-product check · same deal, 3 products live
Conventional
25% down · 7.5% · 30yr
- Down + closing
- —
- Monthly P&I
- —
- Monthly cashflow
- —
- DSCR
- —
- Eligible?
- —
Personal DTI + credit; lowest rate.
DSCR
20% down · 8.5% · 30yr
- Down + closing
- —
- Monthly P&I
- —
- Monthly cashflow
- —
- DSCR
- —
- Eligible?
- —
No personal income docs; deal must DSCR.
Hard money
10% down · 12.0% · 12mo
- Down + closing
- —
- Monthly P&I
- —
- Monthly cashflow
- —
- DSCR
- —
- Eligible?
- —
Short-term bridge; refi at stabilization.
Listing history 19 events
-
2026-06-18days on market $215,000 Active 66 DOM
-
2026-06-17days on market $215,000 Active 65 DOM
-
2026-06-16days on market $215,000 Active 64 DOM
-
2026-06-15days on market $215,000 Active 63 DOM
-
2026-06-13days on market $215,000 Active 61 DOM
-
2026-06-13days on market $215,000 Active 60 DOM
-
2026-06-09days on market $215,000 Active 57 DOM
-
2026-06-08days on market $215,000 Active 56 DOM
-
2026-06-07days on market $215,000 Active 55 DOM
-
2026-06-04days on market $215,000 Active 52 DOM
-
2026-06-03days on market $215,000 Active 51 DOM
-
2026-06-02days on market $215,000 Active 50 DOM
-
2026-06-01days on market $215,000 Active 49 DOM
-
2026-05-31days on market $215,000 Active 48 DOM
-
2026-04-13status Active
-
2026-04-10$215,000 Active
-
2026-04-10historical
-
2026-02-05historical
-
2025-08-25$169,900 Active
ⓘ Source: listings_history table (triggers on properties + properties_extension) + one-shot
backfill from property_details.listing_events for pre-trigger history.
Tax reassessment forecast CA · Resets to sale price
- Current annual tax
- $480 · $40/mo
- Projected year-2 tax
- $1,634 · $136/mo
- Expected delta
- +$1,154/yr (+$96/mo · 240.8%)
ⓘ Screening estimate from a state-policy table — verify with the county assessor before closing.
Climate risk First Street
- Flood 1/10 Low FEMA zone X (unshaded) · 0% chance over 30 yrs
- Wildfire 9/10 Extreme
- Heat 7/10 Severe 7 d/yr ≥98°F today · 18 d/yr by 30 yrs out
- Wind 1/10 Low
- Air quality 9/10 Extreme 22 unhealthy d/yr today · 26 by 30 yrs out
Nearby sold comps map
Loading sold comps map…
Walkable amenities ~0.75 mi
Loading nearby amenities…
Taxation est. · year 1
- Rental income
- $34,986
- − Mortgage interest
- −$12,043
- − Property taxes
- −$480
- − Insurance
- −$1,075
- − Repairs & maintenance
- −$2,799
- − Management
- −$2,799
- − Depreciation
- −$6,255
- Taxable income
- $9,536
- Est. tax owed @ 24.0%
- −$2,289
- After-tax cash flow
- $10,266/yr
For passive investors: Depreciation is non-cash, so a rental often shows a tax loss while cash-flowing — sheltering income. Rental losses are passive: they offset passive income freely, and up to $25,000/yr can offset ordinary (W-2) income if you actively participate and your MAGI is under $100k (phasing out to $0 by $150k); unused losses carry forward. On sale, claimed depreciation is recaptured at up to 25%, and gains may owe capital-gains tax (a 1031 exchange can defer both). Figures are a year-1 estimate at your 24.0% rate — not tax advice; consult a CPA.
Condition & rehab AI · 13 photos
This beautifully remodeled 2-bedroom, 2-bath home offers a fresh, modern feel with quality upgrades in every room. The property is in good condition with new flooring, a new roof, and a new HVAC unit, making it ready for immediate occupancy.
Value-add opportunities
- Both Landscaping and curb appeal improvements — Enhances curb appeal and can attract more buyers or renters.
- Both Painting exterior and interior walls — Fresh paint can make the home look more inviting and maintain its value.
- Both Upgrading lighting fixtures — Modern lighting can improve the home's ambiance and energy efficiency.
Renovation cost estimate screening
Value-add ROI direction
- Both Landscaping and curb appeal improvements — Enhances curb appeal and can attract more buyers or renters. ↑
- Both Painting exterior and interior walls — Fresh paint can make the home look more inviting and maintain its value. ↑
- Both Upgrading lighting fixtures — Modern lighting can improve the home's ambiance and energy efficiency. ↑
ⓘ Cost ranges are severity-bucket heuristics (US national rule-of-thumb). Get contractor quotes + a written scope before underwriting a rehab budget.
Schools (NCES district)
- District
- William S. Hart Union High
- NCES district ID
- 0642510
- Math proficiency
- 52% ▬ 0.00%
- Reading proficiency
- 72% ▲ 1.00%
- Median HH income
- $95,844
- Composite
- 58.6/100
- National rank
- #2030
- State rank
- #155 of 1400 in CA
Livability — Santa Clarita
- Score
- 70/100
- State rank
- #229
- US rank
- #7378
Category grades
Schools grade is shown separately in the Schools card above.
Census & demographics
- County
- Los Angeles County · 9,444,647 people
- City population
- 219,066
- Metro
- Los Angeles-Long Beach-Anaheim, CA
- Population (ZIP)
- 33,155
- Household income
- $115,364
- Rent vs Own
- Severe rent burden
- 784.0
Population outlook (Los Angeles County) Hauer SSP2
- Today (2025)
- 10,940,515 people
- By 2030
- 11,256,481 · +2.9%
- By 2040
- 11,729,929 · +7.2%
- By 2050
- 11,948,407 · +9.2%
- By 2075
- 11,818,114 · +8.0%
- By 2100
- 10,842,928 · -0.9%
Race, ethnicity, and origin ACS 2023
- Neighborhood character
- Diverse neighborhood (Simpson 0.64)
- Race & ethnicity
- Hispanic / Latino 49% White 34% Two or more races 21% Asian 6% Black 4% Native American 1%
- Hispanic origin (detail)
- Mexican 36%
- Common ancestry
- Romanian 1% Lithuanian 1% Scotch-Irish 1%
- Foreign-born
- 23% · Canada, Jamaica, South Korea
- Languages at home
- 54% English-only · Spanish 35% Other Indo-European 3% Tagalog/Filipino 2%
Political lean MEDSL · Los Angeles
- 2024 margin
- Solid D (+32.9) · D 64.8% · R 31.9% · Other 3.3%
- 2008→2024 swing
- -7.4pp toward R · 2008: 40.4pp · 2024: 32.9pp
- All cycles
- 2024: D+32.9 2020: D+44.2 2016: D+48.0 2012: D+40.0 2008: D+40.4
Not yet ingested
- Civics
- —
Market trends
- HPI YoY
- ▼ -703.16%
- Current HPI
- 360.9901
- Rent YoY
- ▲ 1.70%
- Metro
- Los Angeles-Long Beach-Anaheim, CA
- State GDP YoY
- ▲ 3.21%
- F500 in state
- 116
Industry mix (Fortune 500 HQ in CA)
| Industry | F500 HQs | Revenue |
|---|---|---|
| Technology | 27 | $1,492B |
|
||
| Financial Services | 3 | $174B |
|
||
| Retail | 3 | $44B |
|
||
| Insurance | 3 | $26B |
|
||
| Media / Entertainment | 2 | $115B |
|
||
| Pharmaceuticals / Biotech | 2 | $62B |
|
||
Price history
+26.5% since first listed5 events — show timeline
- 2026-04-13 Relisted — CRMLS
- 2026-04-10 Listing Removed — CRMLS
- 2026-04-10 Listed $215,000 CRMLS
- 2026-02-05 Listing Removed — CRMLS
- 2025-08-25 Listed $169,900 CRMLS
Property tax history
+5.9%/yrLatest (2025): $480 · +5.9% YoY. Source: county tax records.
Cash-flow waterfall
monthlySold comps — $/sqft
last 12 mo · ≤1 miLoading sold comps…