 Multi-family
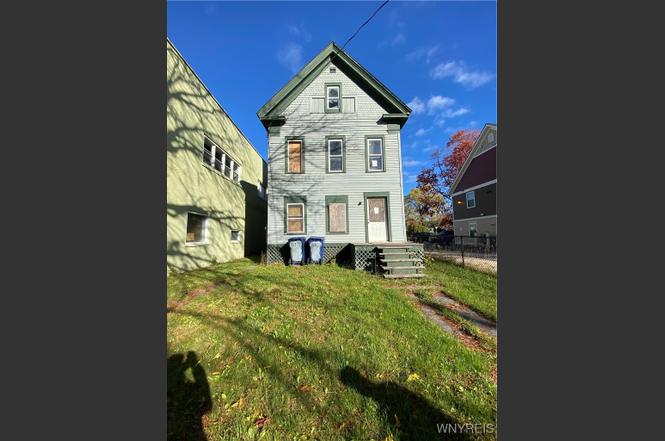
87 Locust St · Lockport, NY
Flood risk 1/10 · Minimal
- FEMA flood zone
- X (unshaded)
- Chance of flooding over 30 yrs
- 0.0%
- Est. flood insurance / yr
- $473 – $860
Fire risk 2/10 · Minimal
- Est. fire insurance / yr
- $691 – $1,283
Heat risk 2/10 · Minimal
- Hot days now (above 95°F)
- 7 days/yr
- Hot days in 30 yrs
- 15 days/yr
Wind risk 1/10 · Minimal
- Chance of severe wind over 30 yrs
- —
Air-quality risk 2/10 · Minimal
- Unhealthy air days now
- 1 days/yr
- Unhealthy air days in 30 yrs
- 2 days/yr
Risk factors via First Street. Map © Google.
Why this score? — see what drove the D+ grade
The composite is a weighted blend of 9 inputs, each scored 0–100. Each bar is that input's sub-score; the figure is the points it added to the 100-point composite (weight × sub-score).
- Cash flow +15.0/30.0
- ARV discount +7.5/15.0
- 1% rule +5.0/10.0
- DSCR +5.0/10.0
- Schools +3.9/10.0
- Livability +3.8/5.0
- Rent growth +3.4/5.0
- Condition / age +2.5/5.0
- Appreciation +0.0/10.0
$40,000
🖨 Deal sheet 📄 Offer letter ✓ Due diligence
Multi-family units
County records classify this as Multi-Family (2-4 Unit). Listing-text estimate: 1 unit. estimate disagrees with records
Listing remarks MLS
Calling all fixer uppers & flippers. Great opportunity with these two or three units. Featuring new roof, and electric. Number of the rooms is approximate. Make an offer and take advantage of low inventory. Selling AS-IS, cash only. Bring the flashlight and use caution when walking the property.
Key facts
- 3,049 sq ft lot
- Built 1880
- Listed 129 days
Property features AI
Finance
- Other: Owner/tenant payment responsibilities referenced in remarks; Rent includes referenced in remarks
- Financial info: Three total units in the building; Three separate gas meters; Two separate electric meters; Operating expense details referenced in remarks
Exterior
- Parking: No driveway; on-street parking
- Utilities: Electricity connected; Public water connected; Sewer connected
- Home design: Two-story multi-unit building; Existing structure
- Construction: Wood siding exterior; Asphalt roof; Stone foundation; Built (existing) — year not specified
- Exterior features: Rectangular residential lot with city street frontage
Interior
- Kitchen: No specific kitchen appliance list provided
- Bedrooms: Three rental units: one 1-bedroom unit and two 2-bedroom units
- Flooring: Hardwood; Varies by area/unit
- Bathrooms: Three full bathrooms (one in each unit)
- Heating & cooling: Gas forced air heating
- Interior features: Hardwood and varied flooring throughout; Full basement
- Laundry & utility: Gas water heater
Neighborhood map
What this means for you Summary
Snapshot
- This is a 3-bed/3.0-bath multifamily listed at $40k.
Deal economics
- At list price, monthly cash flow is $3k ($31k/yr) — positive.
- The deal already cash-flows at list — no discount required.
- Meets the 1% rule at list price ($4k rent vs $40k).
- Recommended offer: $35k (12.0% below list) — sets the bar for market timing.
- Cap rate 85.0% vs local median 4.5% in Lockport — top-decile yield for the area; either an underpriced asset or a hidden risk that comps aren't pricing in. Stress-test before assuming the spread holds.
Location & tenants
- Location reads 76/100 on livability (#232 in NY, #3,669 nationally) — a middle-class / working-renter tenant base. Strengths: amenities A+, cost of living A+, housing A+; Watch: commute D+, crime F, employment D-.
- Lockport City School District (town): math 44% / reading 49% proficiency, ranked #452 of 590 in NY (top 77%) — families likely to look elsewhere, expect single-tenant / working-renter base with shorter leases.
- Market conditions: Rents rising (+3.7%/yr); 357 active listings in the ZIP; solid renter incomes; 167 units permitted in Niagara County in 2024 (0 in 5+ unit buildings).
- At $3,739/mo this rent would consume 59% of the median local household income ($75k/yr) (locally 1112% of renters already pay >50% of income on rent) — very limited rent-growth headroom before tenants either downsize or default.
Forward outlook
- Local home prices are declining (-3.0%/yr); year-one equity from $277 of loan paydown is wiped out by about $1k of value loss. Plan a longer hold.
- Niagara County population projected at -19% by 2050 — secular population decline; favor cash flow + early exit over multi-decade hold.
- At projected returns (-3.0% appreciation + 3.7% rent growth), your $11k cash investment doubles in ~1 year — after that, you're playing with house money.
Negotiation context
- It's been on market 129 days — a 12% lower offer ($35k) is reasonable based on typical stale-listing flexibility.
- 5 sale attempts since 4y ago; this cycle's ask has dropped $10k (20%) from the opening price — seller is motivated, your offer sets the floor, not the list.
- Current owner paid $33k; 21% above their basis — modest negotiation headroom, anchor on the comps not their cost.
Risks & watch-outs
- Watch-outs: property tax is 3.1% of price; built in 1880 — expect roof / HVAC / electrical / plumbing capex.
Questions for the listing agent
- It's been on market 129 days. Have you received any prior offers? Is the seller open to a 12% concession, seller financing, or rate buy-down credit?
- Built in 1880 — when were the roof, HVAC, electrical panel, plumbing, and water heater last replaced?
- Property tax is high relative to price — has the assessment been appealed recently, and will the sale trigger a re-assessment?
- Why hasn't it sold? Are there any deal-killer items the seller is aware of (foundation, flood, title, zoning, code violations)?
- Is there a deadline driving the sale (1031 exchange, divorce, estate, relocation)? That informs how much negotiation room exists.
- Schools are B-rated — typically a magnet for longer-tenancy family renters. What's the average tenant stay here, and is there a school-zone premium baked into asking?
- Crime grade is F in this area — have there been break-ins, vandalism, or insurance claims at this property in the last 3 years? What carrier currently insures it and at what premium?
- The area grade is low — what's the realistic commute time and amenity access for the typical tenant pool here? Any planned neighborhood developments (good or bad) we should know about?
- What's the average days-on-market for RENTAL listings here right now (not sales)? A rising rental-DOM trend means longer vacancies and softer asking-rent achievability than the comps imply.
- What's the recent tenant-quality profile in this submarket — average credit score on applications, eviction rate, late-payment / NSF rate, and stable-employment percentage? A property-management company in the area should have these aggregated.
- How much new apartment / multifamily construction is in the pipeline within 1–3 miles? Heavy new supply (>2% of stock underway) typically softens rents 12–24 months out; light construction supports rent growth.
Investment metrics
- 1% rule
- 9.35% ✓
- Cap rate
- 85.03%
- Cash-on-cash
- 281.20%
- DSCR
- 13.51
- GRM
- 0.9
CMA / ARV
- ARV (on-the-fly)
- $152,352
- Comps found
- 5
Show comp detail 5 sales within ~0.75 mi
| Address | Dist | Beds/Ba | Sqft | Sold | Price | $/sf | Match |
|---|---|---|---|---|---|---|---|
| 35 Pound St | 0.61mi | 3/2.5 | 2,163 (-2%) | 9mo | $150,000 | $69 | 59 |
| 179 Lock St | 0.60mi | 4/2.0 (+1) | 2,275 (+3%) | 11mo | $200,000 | $88 | 49 |
| 14 Cave St | 0.49mi | 4/2.0 (+1) | 2,056 (-7%) | 11mo | $95,000 | $46 | 48 |
| 129 Lock St | 0.50mi | 4/2.0 (+1) | 2,492 (+13%) | 0mo | $96,000 | $39 | 46 |
| 267 Chestnut St | 0.62mi | 4/2.0 (+1) | 2,016 (-9%) | 9mo | $221,450 | $110 | 40 |
Match score weights: distance 35% · size 25% · config 20% · recency 20%. Top-matched comps best support the ARV.
Projected returns pro-forma
-3.0% appreciation · 3.67% rent growth · sell at horizon
- IRR
- —
- Equity multiple
- 15.58×
- Total profit
- $163,303
- Equity at exit
- $5,964
- IRR
- —
- Equity multiple
- 33.89×
- Total profit
- $368,359
- Equity at exit
- $3,458
Cash invested: $11,200 (down + closing). Projections, not guarantees.
Landlord ↔ Tenant lean methodology
- Overall (STATE)
- 15 Strongly Tenant-Friendly
- State New York
- 15 Strongly Tenant-Friendly · D+10
- County
- — inherits STATE
- City
- — inherits STATE
ZIP-level market 14094
- Rents YoY
- 3.7%
- Active inventory
- 357
- Price-to-rent
- 2.7×
Monthly cashflow live
- Estimated rent
- $3,739 medium interval (Pro) →
- Mortgage (P&I)
- −$210
- Tax from tax record
- −$103 /mo · $1,234/yr
- Insurance
- −$17
- HOA
- −$0
- Vacancy / Maint / Mgmt
- −$785
- Net cashflow
- $2,625
Break-even live
3-unit breakdown (identical units grouped — click to expand)
| Units | Beds | Baths | Est. rent |
|---|---|---|---|
| 3× units | 2 | 1.5 | $3,738 |
| #1 | 2 | 1.5 | $1,246 |
| #2 | 2 | 1.5 | $1,246 |
| #3 | 2 | 1.5 | $1,246 |
| Total (3 units) | $3,739 | ||
UW: 25.0% down · 7.5% · 30yr · 1.5% tax · 5.0% vac · 8.0% maint · 8.0% mgmt
Financing live
Cash to close
- Down payment
- $10,000
- Closing costs
- $1,200
- Reserves months
- —
- Total cash needed
- —
Loan-product check · same deal, 3 products live
Conventional
25% down · 7.5% · 30yr
- Down + closing
- —
- Monthly P&I
- —
- Monthly cashflow
- —
- DSCR
- —
- Eligible?
- —
Personal DTI + credit; lowest rate.
DSCR
20% down · 8.5% · 30yr
- Down + closing
- —
- Monthly P&I
- —
- Monthly cashflow
- —
- DSCR
- —
- Eligible?
- —
No personal income docs; deal must DSCR.
Hard money
10% down · 12.0% · 12mo
- Down + closing
- —
- Monthly P&I
- —
- Monthly cashflow
- —
- DSCR
- —
- Eligible?
- —
Short-term bridge; refi at stabilization.
Listing history 19 events
-
2026-05-14status Pending
-
2026-03-26status Active
-
2026-01-22status Pending
-
2025-12-23price $40,000
-
2025-11-23price $45,000
-
2025-11-03$50,000 Active
-
2024-08-07historical
-
2024-04-23price $55,000
-
2024-03-01price $50,000
-
2024-02-12price $69,000
-
2024-02-09$85,000 Active
-
2023-06-26soldstatus $33,000 Closed Sale or Rented 302-char remark
Show marketing remark (302 chars)
Calling all fixer uppers & flippers. Great opportunity with these two or three units. Featuring new roof, and electric. Number of the rooms is approximate. Make an offer and take advantage of low inventory. Selling AS-IS, cash only. Bring the flashlight and use caution when walking the property.
-
2023-06-26soldstatus $33,000
Show marketing remark (302 chars)
Calling all fixer uppers & flippers. Great opportunity with these two or three units. Featuring new roof, and electric. Number of the rooms is approximate. Make an offer and take advantage of low inventory. Selling AS-IS, cash only. Bring the flashlight and use caution when walking the property.
-
2023-03-08status Pending Sale 302-char remark
Show marketing remark (302 chars)
Calling all fixer uppers & flippers. Great opportunity with these two or three units. Featuring new roof, and electric. Number of the rooms is approximate. Make an offer and take advantage of low inventory. Selling AS-IS, cash only. Bring the flashlight and use caution when walking the property.
-
2023-02-19$29,900 Active 302-char remark
Show marketing remark (302 chars)
Calling all fixer uppers & flippers. Great opportunity with these two or three units. Featuring new roof, and electric. Number of the rooms is approximate. Make an offer and take advantage of low inventory. Selling AS-IS, cash only. Bring the flashlight and use caution when walking the property.
-
2023-01-07historical
-
2022-09-07$44,900 Active
-
2008-09-10soldstatus $61,000
-
2007-07-27soldstatus $760,000
ⓘ Source: listings_history table (triggers on properties + properties_extension) + one-shot
backfill from property_details.listing_events for pre-trigger history.
Tax reassessment forecast NY · Partial reset (capped growth)
- Current annual tax
- $1,234 · $103/mo
- Projected year-2 tax
- $1,234 · $103/mo
- Expected delta
- $0/yr ($0/mo · 0.0%)
ⓘ Screening estimate from a state-policy table — verify with the county assessor before closing.
Climate risk First Street
- Flood 1/10 Low FEMA zone X (unshaded) · 0% chance over 30 yrs
- Wildfire 2/10 Low
- Heat 2/10 Low 7 d/yr ≥95°F today · 15 d/yr by 30 yrs out
- Wind 1/10 Low
- Air quality 2/10 Low 1 unhealthy d/yr today · 2 by 30 yrs out
Nearby sold comps map
Loading sold comps map…
Walkable amenities ~0.75 mi
Loading nearby amenities…
Taxation est. · year 1
- Rental income
- $44,868
- − Mortgage interest
- −$2,241
- − Property taxes
- −$1,234
- − Insurance
- −$200
- − Repairs & maintenance
- −$3,589
- − Management
- −$3,589
- − Depreciation
- −$1,164
- Taxable income
- $32,851
- Est. tax owed @ 24.0%
- −$7,884
- After-tax cash flow
- $23,610/yr
For passive investors: Depreciation is non-cash, so a rental often shows a tax loss while cash-flowing — sheltering income. Rental losses are passive: they offset passive income freely, and up to $25,000/yr can offset ordinary (W-2) income if you actively participate and your MAGI is under $100k (phasing out to $0 by $150k); unused losses carry forward. On sale, claimed depreciation is recaptured at up to 25%, and gains may owe capital-gains tax (a 1031 exchange can defer both). Figures are a year-1 estimate at your 24.0% rate — not tax advice; consult a CPA.
Schools (NCES district)
- District
- Lockport City School District
- NCES district ID
- 3617670
- Math proficiency
- 44% ▼ -7.00%
- Reading proficiency
- 49% ▲ 3.00%
- Median HH income
- $43,793
- Composite
- 39.28/100
- National rank
- #3997
- State rank
- #452 of 590 in NY
Livability — Lockport
- Score
- 76/100
- State rank
- #232
- US rank
- #3669
Category grades
Schools grade is shown separately in the Schools card above.
Census & demographics
- Census place
- Lockport, NY
- County
- Niagara County · 157,377 people
- City population
- 50,153
- Metro
- Buffalo-Cheektowaga, NY
- Population (ZIP)
- 50,153
- Household income
- $75,427
- Rent vs Own
- Severe rent burden
- 1112.0
Population outlook (Niagara County) Hauer SSP2
- Today (2025)
- 204,149 people
- By 2030
- 197,900 · -3.1%
- By 2040
- 182,239 · -10.7%
- By 2050
- 165,198 · -19.1%
- By 2075
- 129,416 · -36.6%
- By 2100
- 96,222 · -52.9%
Race, ethnicity, and origin ACS 2023
- Neighborhood character
- Predominantly White (84%)
- Race & ethnicity
- White 84% Two or more races 6% Black 6% Hispanic / Latino 3%
- Common ancestry
- Romanian 9% Slovak 2% Lithuanian 2%
- Foreign-born
- 3% · Canada
- Languages at home
- 96% English-only · Spanish 1% Russian/Polish/Slavic 1% Other Indo-European 1%
Political lean MEDSL · Niagara
- 2024 margin
- R (+14.9) · D 42.5% · R 57.5%
- 2008→2024 swing
- -15.9pp toward R · 2008: 1.0pp · 2024: -14.9pp
- All cycles
- 2024: R+14.9 2020: R+9.7 2016: R+19.0 2012: D+0.6 2008: D+1.0
Not yet ingested
- Civics
- —
Market trends
- HPI YoY
- ▼ -262.57%
- Current HPI
- 303.6109
- Rent YoY
- ▲ 3.67%
- Metro
- Buffalo-Cheektowaga, NY
- State GDP YoY
- ▲ 2.60%
- F500 in state
- 92
Industry mix (Fortune 500 HQ in NY)
| Industry | F500 HQs | Revenue |
|---|---|---|
| Financial Services | 10 | $950B |
|
||
| Consumer Goods | 9 | $162B |
|
||
| Insurance | 4 | $225B |
|
||
| Telecommunications | 2 | $144B |
|
||
| Pharmaceuticals | 2 | $112B |
|
||
| Media / Entertainment | 2 | $69B |
|
||
Price history
-94.7% since first listed19 events — show timeline
- 2026-05-14 Pending — WNYREIS
- 2026-03-26 Relisted — WNYREIS
- 2026-01-22 Pending — WNYREIS
- 2025-12-23 Price Changed $40,000 WNYREIS
- 2025-11-23 Price Changed $45,000 WNYREIS
- 2025-11-03 Listed $50,000 WNYREIS
- 2024-08-07 Listing Removed — WNYREIS
- 2024-04-23 Price Changed $55,000 WNYREIS
- 2024-03-01 Price Changed $50,000 WNYREIS
- 2024-02-12 Price Changed $69,000 WNYREIS
- 2024-02-09 Listed $85,000 WNYREIS
- 2023-06-26 Sold (Public Records) $33,000 Public Records
- 2023-06-26 Sold (MLS) $33,000 WNYREIS
- 2023-03-08 Pending — WNYREIS
- 2023-02-19 Listed $29,900 WNYREIS
- 2023-01-07 Listing Removed — WNYREIS
- 2022-09-07 Listed $44,900 WNYREIS
- 2008-09-10 Sold (Public Records) $61,000 Public Records
- 2007-07-27 Sold (Public Records) $760,000 Public Records
Property tax history
+3.1%/yrLatest (2025): $1,234 · -34.9% YoY. Source: county tax records.
Cash-flow waterfall
monthlySold comps — $/sqft
last 12 mo · ≤1 miLoading sold comps…