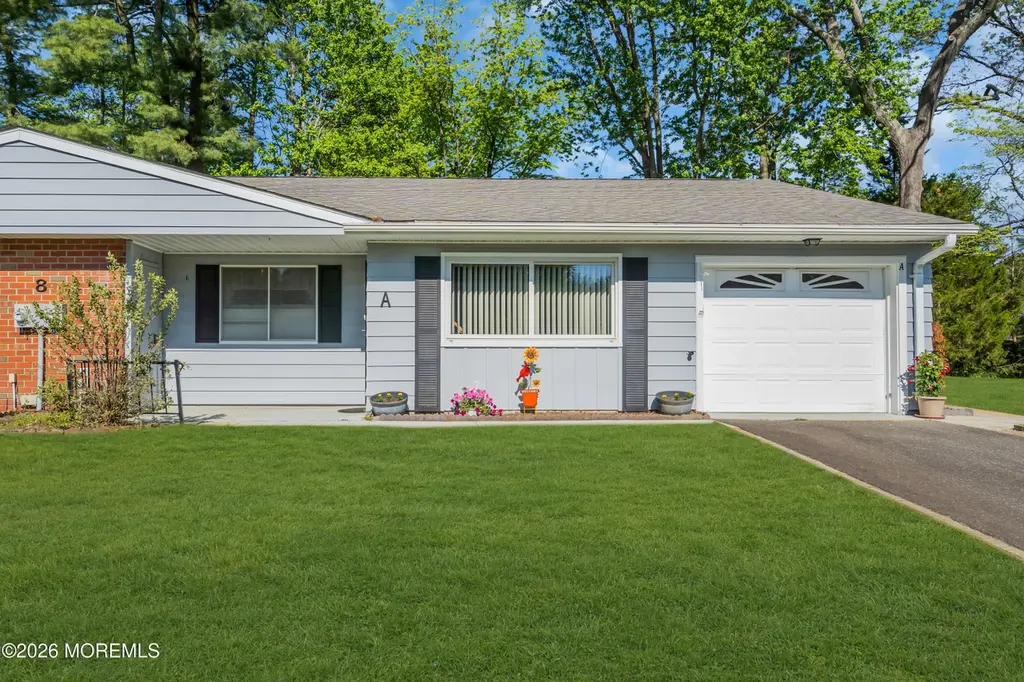
8 Montana Dr Unit A · Cedar Glen Lakes, NJ
Flood risk 1/10 · Minimal
- FEMA flood zone
- X (unshaded)
- Chance of flooding over 30 yrs
- 0.0%
- Est. flood insurance / yr
- $507 – $1,088
Fire risk 6/10 · Moderate
- Est. fire insurance / yr
- $526 – $976
Heat risk 6/10 · Moderate
- Hot days now (above 103°F)
- 7 days/yr
- Hot days in 30 yrs
- 14 days/yr
Wind risk 6/10 · Moderate
- Chance of severe wind over 30 yrs
- 67.0%
Air-quality risk 4/10 · Minor
- Unhealthy air days now
- 4 days/yr
- Unhealthy air days in 30 yrs
- 5 days/yr
Risk factors via First Street. Map © Google.
Why this score? — see what drove the D grade
The composite is a weighted blend of 9 inputs, each scored 0–100. Each bar is that input's sub-score; the figure is the points it added to the 100-point composite (weight × sub-score).
- Cash flow +15.2/30.0
- 1% rule +7.9/10.0
- DSCR +4.7/10.0
- Condition / age +3.8/5.0
- ARV discount +3.6/15.0
- Livability +3.2/5.0
- Schools +2.9/10.0
- Rent growth +2.5/5.0
- Appreciation +0.0/10.0
$170,000
🖨 Deal sheet (PDF) 📄 Offer letter ✓ Due diligence
Listing remarks
Move-in ready and well maintained, this spacious 2-bedroom, 1-bath Madison model duplex in Cedar Glen Lakes offers comfortable single-level living in a vibrant, pet-friendly 55+ community. Features include a large living room, a large country eat-in kitchen (open concept) with white appliances, central A/C, walk-in closets, and a full bath with walk in shower. Remodeled with newer carpet, this home also offers outdoor storage and an attached 1-car garage with direct entry and no steps. The low HOA covers taxes, water/sewer, lawn care, snow removal, trash, roof maintenance, and more. Community amenities include a clubhouse, activities, and bus service. Conveniently located near Routes 70 &a
Key facts
- Single level living
- Walk-in closets
- Large living room
Tags
Property features AI
Finance
- HOA & community: Monthly association fee (includes trash, common area, sewer, snow removal, water); Community amenities: exercise room, community room, clubhouse, bocci (no pool)
Exterior
- Parking: Attached 1-car garage
- Utilities: Public sewer
- Home design: Cooperative ownership; Model: Madison Remodel
- Construction: No basement
- Exterior features: Shingle roof; Attached/connected property
Interior
- Kitchen: Electric cooking; Stove; Microwave; Dishwasher; Refrigerator
- Bedrooms: 2 bedrooms (all on the first floor)
- Flooring: Linoleum; Laminate
- Bathrooms: 1 full bathroom
- Heating & cooling: Electric baseboard heat; Central air conditioning
- Interior features: Ceiling fan(s); Blinds/Shades; No fireplace
- Laundry & utility: Washer; Dryer
Neighborhood map
What this means for you Summary
Snapshot
- This is a 2-bed/1.0-bath single-family listed at $170k. Condition is rated good.
Deal economics
- At list price, monthly cash flow is $60 ($722/yr) — positive.
- The deal already cash-flows at list — no discount required.
- Meets the 1% rule at list price ($2k rent vs $170k).
- Recommended offer: $165k (3.0% below list) — sets the bar for market timing.
Location & tenants
- Location reads 64/100 on livability (#406 in NJ) — a middle-class / working-renter tenant base. Strengths: crime A+, cost of living A+, housing A+; Watch: amenities F, commute F, employment D-.
- Manchester Township School District (suburban): math 25% / reading 44% proficiency, ranked #320 of 472 in NJ (top 68%) — families likely to look elsewhere, expect single-tenant / working-renter base with shorter leases.
- Zoned schools: Whiting Elementary School (math 22% / reading 47%, grade F, #582 of 1,303 statewide, top 49%, 301 students, 25% FRL); Manchester Township Middle School (math 28% / reading 45%, grade F, #226 of 431 statewide, top 55%, 582 students, 41% FRL); Manchester Township High School (math 21% / reading 38%, grade F, #290 of 399 statewide, top 74%, 959 students, 38% FRL).
- Market conditions: 658 active listings in the ZIP; 1 comparable units currently listed for rent nearby; 4,434 units permitted in Ocean County in 2024 (868 in 5+ unit buildings).
Forward outlook
- Local home prices are declining (-3.0%/yr); year-one equity from $1k of loan paydown is wiped out by about $5k of value loss. Plan a longer hold.
- Ocean County population projected to shrink 8% by 2050 — rents likely to lag national; underwrite the cash flow, not the appreciation.
Negotiation context
- It's been on market 40 days — a 3% lower offer ($165k) is reasonable based on typical stale-listing flexibility.
Risks & watch-outs
- Watch-outs: HOA is 23% of rent.
- Climate carrying-cost: major wind risk, 67% chance of damaging wind over 30y; major wildfire risk; extreme-heat days projected 7→14/yr by 2055 (HVAC capex compounding) — expect insurance premiums to compound above CPI over the hold.
Questions for the listing agent
- It's been on market 40 days. Have you received any prior offers? Is the seller open to a 3% concession, seller financing, or rate buy-down credit?
- Built in 1977 — when were the roof, HVAC, electrical panel, plumbing, and water heater last replaced?
- What does the HOA fee cover, when was the last increase, and are there any pending special assessments or reserve-fund shortfalls?
- Is there a deadline driving the sale (1031 exchange, divorce, estate, relocation)? That informs how much negotiation room exists.
- Schools are F-rated, which usually means shorter tenancies and higher turnover. Who's the typical renter profile here, and what's been the actual vacancy rate?
- The area grade is low — what's the realistic commute time and amenity access for the typical tenant pool here? Any planned neighborhood developments (good or bad) we should know about?
- What's the average days-on-market for RENTAL listings here right now (not sales)? A rising rental-DOM trend means longer vacancies and softer asking-rent achievability than the comps imply.
- What's the recent tenant-quality profile in this submarket — average credit score on applications, eviction rate, late-payment / NSF rate, and stable-employment percentage? A property-management company in the area should have these aggregated.
- How much new for-sale + rental construction is in the pipeline within 1–3 miles? Heavy new supply typically softens prices + rents 12–24 months out; constrained supply supports both.
Investment metrics
- 1% rule
- 1.29% ✓
- Cap rate
- 6.72%
- Cash-on-cash
- 1.52%
- DSCR
- 1.07
- GRM
- 6.4
CMA / ARV
- ARV (median comp)
- $156,412
- List price
- $170,000
- Delta
- 8.69%
- Verdict
- FAIR
- Comps
- 20 within 1.0 mi
Show comp detail 12 sales within ~0.75 mi
| Address | Dist | Beds/Ba | Sqft | Sold | Price | $/sf | Match |
|---|---|---|---|---|---|---|---|
| 8A Alaska Ave | 0.12mi | 2/1.0 | 1,200 (-2%) | 1mo | $148,000 | $123 | 91 |
| 12 Vermont Way | 0.19mi | 2/1.5 | 1,200 (-2%) | 3mo | $185,000 | $154 | 84 |
| 8 Maine Ave Unit A | 0.28mi | 2/1.0 | 1,222 (0%) | 4mo | $150,000 | $123 | 84 |
| 5 Oregon Dr Unit B | 0.26mi | 2/1.0 | 1,222 (0%) | 8mo | $120,000 | $98 | 81 |
| 10 Minnesota Ave Unit A | 0.34mi | 2/1.0 | 1,222 (0%) | 9mo | $136,500 | $112 | 77 |
| 9 Oklahoma Way Unit A | 0.47mi | 2/1.0 | 1,222 (0%) | 7mo | $135,000 | $110 | 73 |
| 7 Roosevelt City Rd Unit B | 0.54mi | 2/1.0 | 1,222 (0%) | 3mo | $142,000 | $116 | 72 |
| 50 Texas Blvd | 0.21mi | 2/1.0 | 1,344 (+10%) | 8mo | $177,000 | $132 | 67 |
| 7 Connecticut Dr Unit B | 0.58mi | 2/1.0 | 1,222 (0%) | 8mo | $105,000 | $86 | 66 |
| 4 Delaware Way Unit A | 0.61mi | 2/1.0 | 1,222 (0%) | 8mo | $169,000 | $138 | 65 |
| 11 Hawaii Way Unit B | 0.43mi | 2/1.0 | 1,100 (-10%) | 3mo | $48,000 | $44 | 61 |
| 4 Washington Ln | 0.63mi | 1/1.0 (-1) | 1,222 (0%) | 9mo | $130,000 | $106 | 58 |
Match score weights: distance 35% · size 25% · config 20% · recency 20%. Top-matched comps best support the ARV.
Projected returns pro-forma
-3.0% appreciation · 3.0% rent growth · sell at horizon
- IRR
- -13.6%
- Equity multiple
- 0.51×
- Total profit
- $-23,373
- Equity at exit
- $25,348
- IRR
- -4.4%
- Equity multiple
- 0.71×
- Total profit
- $-14,027
- Equity at exit
- $14,698
Cash invested: $47,600 (down + closing). Projections, not guarantees.
Landlord ↔ Tenant lean methodology
- Overall (STATE)
- 21 Tenant-Leaning
- State New Jersey
- 21 Tenant-Leaning · D+6
- County
- — inherits STATE
- City
- — inherits STATE
ZIP-level market 08759
- Active inventory
- 658
- Price-to-rent
- 6.4×
Monthly cashflow live
- Estimated rent
- $2,200 medium interval (Pro) →
- Mortgage (P&I)
- −$891
- Tax est. 1.5%
- −$212 /mo · $2,550/yr
- Insurance
- −$71
- HOA
- −$503
- Vacancy / Maint / Mgmt
- −$462
- Net cashflow
- $60
Break-even live
Sensitivity live
| Price | -10% $178 | -5% $119 | +0% $60 | +5% $1 | +10% $-57 |
|---|---|---|---|---|---|
| Rent | -10% $-114 | -5% $-27 | +0% $60 | +5% $147 | +10% $234 |
| Rate | -1.0pp $146 | -0.5pp $103 | base $60 | +0.5pp $16 | +1.0pp $-29 |
UW: 25.0% down · 7.5% · 30yr · 1.5% tax · 5.0% vac · 8.0% maint · 8.0% mgmt
Financing live
Cash to close
- Down payment
- $42,500
- Closing costs
- $5,100
- Reserves months
- —
- Total cash needed
- —
Loan-product check · same deal, 3 products live
Conventional
25% down · 7.5% · 30yr
- Down + closing
- —
- Monthly P&I
- —
- Monthly cashflow
- —
- DSCR
- —
- Eligible?
- —
Personal DTI + credit; lowest rate.
DSCR
20% down · 8.5% · 30yr
- Down + closing
- —
- Monthly P&I
- —
- Monthly cashflow
- —
- DSCR
- —
- Eligible?
- —
No personal income docs; deal must DSCR.
Hard money
10% down · 12.0% · 12mo
- Down + closing
- —
- Monthly P&I
- —
- Monthly cashflow
- —
- DSCR
- —
- Eligible?
- —
Short-term bridge; refi at stabilization.
Rent comps 1 comps
| Address | Beds | Baths | Sqft | Rent | $/sqft | DOM | Units | Dist |
|---|---|---|---|---|---|---|---|---|
| 50 Westport Dr #71 Whiting, NJ | 2.0 | 1.0 | 1120 | $2,200 | $1.96 | 0d | 1 | 1.48mi |
HOA detail
- Monthly dues
- $503 · $6,036/yr
- Likely covers
- watersewertrashlandscapingsnow removalroof
Listing history 16 events
-
2026-06-21days on market $170,000 Active 40 DOM
-
2026-06-18days on market $170,000 Active 37 DOM
-
2026-06-17days on market $170,000 Active 36 DOM
-
2026-06-16days on market $170,000 Active 35 DOM
-
2026-06-15days on market $170,000 Active 34 DOM
-
2026-06-13days on market $170,000 Active 32 DOM
-
2026-06-09days on market $170,000 Active 28 DOM
-
2026-06-08days on market $170,000 Active 27 DOM
-
2026-06-08price $170,000 Active 26 DOM
-
2026-06-07days on market $180,000 Active 26 DOM
-
2026-06-04days on market $180,000 Active 23 DOM
-
2026-06-03days on market $180,000 Active 22 DOM
-
2026-06-02days on market $180,000 Active 21 DOM
-
2026-06-01days on market $180,000 Active 20 DOM
-
2026-05-31days on market $180,000 Active 19 DOM
-
2026-05-12$180,000 Active 786-char remark
ⓘ Source: listings_history table (triggers on properties + properties_extension) + one-shot
backfill from property_details.listing_events for pre-trigger history.
Climate risk First Street
- Flood 1/10 Low FEMA zone X (unshaded) · 0% chance over 30 yrs
- Wildfire 6/10 Major
- Heat 6/10 Major 7 d/yr ≥103°F today · 14 d/yr by 30 yrs out
- Wind 6/10 Major 67% chance of damaging wind over 30 yrs
- Air quality 4/10 Moderate 4 unhealthy d/yr today · 5 by 30 yrs out
Nearby sold comps map
Loading sold comps map…
Walkable amenities ~0.75 mi
Loading nearby amenities…
Taxation est. · year 1
- Rental income
- $26,400
- − Mortgage interest
- −$9,523
- − Property taxes
- −$2,550
- − Insurance
- −$850
- − Repairs & maintenance
- −$2,112
- − Management
- −$2,112
- − HOA
- −$6,036
- − Depreciation
- −$4,945
- Taxable loss
- −$1,728
- Est. tax savings @ 24.0%
- +$415
- After-tax cash flow
- $1,137/yr
For passive investors: Depreciation is non-cash, so a rental often shows a tax loss while cash-flowing — sheltering income. Rental losses are passive: they offset passive income freely, and up to $25,000/yr can offset ordinary (W-2) income if you actively participate and your MAGI is under $100k (phasing out to $0 by $150k); unused losses carry forward. On sale, claimed depreciation is recaptured at up to 25%, and gains may owe capital-gains tax (a 1031 exchange can defer both). Figures are a year-1 estimate at your 24.0% rate — not tax advice; consult a CPA.
Condition & rehab AI · 30 photos
This move-in ready home in Cedar Glen Lakes offers comfortable single-level living with good condition and minimal repairs needed.
Value-add opportunities
- Both Paint exterior trim — Enhances curb appeal and value
- Both Replace window blinds — Improves energy efficiency and aesthetics
Renovation cost estimate screening
Value-add ROI direction
- Both Paint exterior trim — Enhances curb appeal and value ↑
- Both Replace window blinds — Improves energy efficiency and aesthetics ↑
ⓘ Cost ranges are severity-bucket heuristics (US national rule-of-thumb). Get contractor quotes + a written scope before underwriting a rehab budget.
Schools (NCES district)
- District
- Manchester Township School District
- NCES district ID
- 3409450
- Math proficiency
- 25% ▼ -17.00%
- Reading proficiency
- 44% ▼ -5.00%
- Median HH income
- $38,905
- Composite
- 28.8/100
- National rank
- #6662
- State rank
- #320 of 472 in NJ
Livability — Cedar Glen Lakes
- Score
- 64/100
- State rank
- #406
- US rank
- #14186
Category grades
Schools grade is shown separately in the Schools card above.
Census & demographics
- Census place
- Cedar Glen Lakes, NJ
- Population (ZIP)
- 34,290
Population outlook (Ocean County) Hauer SSP2
- Today (2025)
- 586,991 people
- By 2030
- 581,403 · -1.0%
- By 2040
- 564,913 · -3.8%
- By 2050
- 538,149 · -8.3%
- By 2075
- 468,845 · -20.1%
- By 2100
- 350,297 · -40.3%
Race, ethnicity, and origin ACS 2023
- Neighborhood character
- Predominantly White (87%)
- Race & ethnicity
- White 87% Hispanic / Latino 5% Black 4% Two or more races 4% Asian 2%
- Hispanic origin (detail)
- Puerto Rican 2%
- Common ancestry
- Romanian 8% Scotch-Irish 2% Lithuanian 2%
- Foreign-born
- 11% · Canada, China
- Languages at home
- 88% English-only · Spanish 3% Russian/Polish/Slavic 2% Other Indo-European 2%
Political lean MEDSL · Ocean
- 2024 margin
- Solid R (+36.0) · D 31.4% · R 67.4% · Other 1.2%
- 2008→2024 swing
- -17.6pp toward R · 2008: -18.4pp · 2024: -36.0pp
- All cycles
- 2024: R+36.0 2020: R+28.7 2016: R+34.0 2012: R+17.7 2008: R+18.4
Not yet ingested
- Civics
- —
Market trends
- HPI YoY
- ▼ -347.85%
- Current HPI
- 274.4679
- Rent YoY
- —
- Metro
- —
- State GDP YoY
- ▲ 2.05%
- F500 in state
- 34
Industry mix (Fortune 500 HQ in NJ)
| Industry | F500 HQs | Revenue |
|---|---|---|
| Consumer Goods | 3 | $31B |
|
||
| Pharmaceuticals | 2 | $153B |
|
||
| Technology | 2 | $21B |
|
||
| Insurance | 2 | $20B |
|
||
| Healthcare | 2 | $19B |
|
||
| Financial Services | 1 | $70B |
|
||
Price history
-5.6% since first listed2 events — show timeline
- 2026-06-07 Price Changed $170,000 MOMLS
- 2026-05-12 Listed $180,000 MOMLS
Cash-flow waterfall
monthlySold comps — $/sqft
last 12 mo · ≤1 miLoading sold comps…