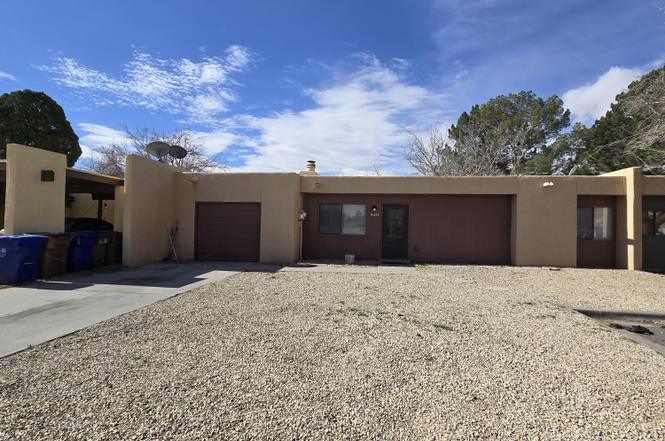
1235 Birch Dr · Las Cruces, NM
Flood risk 1/10 · Minimal
- FEMA flood zone
- X (unshaded)
- Chance of flooding over 30 yrs
- 0.0%
- Est. flood insurance / yr
- $507 – $1,088
Fire risk 3/10 · Minor
- Est. fire insurance / yr
- $706 – $1,312
Heat risk 6/10 · Moderate
- Hot days now (above 99°F)
- 6 days/yr
- Hot days in 30 yrs
- 21 days/yr
Wind risk 1/10 · Minimal
- Chance of severe wind over 30 yrs
- —
Air-quality risk 1/10 · Minimal
- Unhealthy air days now
- 0 days/yr
- Unhealthy air days in 30 yrs
- 0 days/yr
Risk factors via First Street. Map © Google.
Why this score? — see what drove the D grade
The composite is a weighted blend of 9 inputs, each scored 0–100. Each bar is that input's sub-score; the figure is the points it added to the 100-point composite (weight × sub-score).
- Cash flow +12.8/30.0
- ARV discount +7.5/15.0
- Schools +4.6/10.0
- DSCR +3.8/10.0
- Rent growth +3.4/5.0
- Livability +3.0/5.0
- 1% rule +2.7/10.0
- Condition / age +2.5/5.0
- Appreciation +0.0/10.0
$190,000
🖨 Deal sheet 📄 Offer letter ✓ Due diligence
Key facts
- Mature trees
- Garage
- Built 1979
Tags
Neighborhood map
What this means for you Summary
Snapshot
- This is a 3-bed/2.0-bath townhouse listed at $190k.
Deal economics
- At list price, monthly cash flow is $-16 ($-197/yr) — negative.
- To cash-flow at today's rent, offer at most $187k (1.5% below list).
- To meet the 1% rule (rent ≥ 1% of price), the offer needs to be $146k (23.3% below list).
- Recommended offer: $146k (23.3% below list) — sets the bar for 1% rule.
Location & tenants
- Location reads 59/100 on livability (#120 in NM) — a working-class tenant base; expect higher turnover. Strengths: cost of living A+, housing A; Watch: amenities D+, schools D-, crime F.
- Las Cruces Public Schools (urban): math 42% / reading 68% proficiency, ranked #5 of 29 in NM (top 17%) — acceptable for families but not a draw, mixed tenant base, ~2y average lease; 62% free/reduced lunch — lower-income household profile, screen leases tightly.
- Market conditions: Rents rising (+3.5%/yr); 143 active listings in the ZIP; 20 comparable units currently listed for rent nearby; rentals at typical pace (median 21d on market — plan ~3-4 weeks tenant-placement turnaround); lower-income renter base — watch delinquency; 964 units permitted in Doña Ana County in 2024 (0 in 5+ unit buildings).
- At $1,457/mo this rent would consume 53% of the median local household income ($33k/yr) (locally 2590% of renters already pay >50% of income on rent) — very limited rent-growth headroom before tenants either downsize or default.
Forward outlook
- Local home prices are declining (-3.0%/yr); year-one equity from $1k of loan paydown is wiped out by about $6k of value loss. Plan a longer hold.
Negotiation context
- It's been on market 57 days — a 3% lower offer ($184k) is reasonable based on typical stale-listing flexibility.
Risks & watch-outs
- Climate carrying-cost: extreme-heat days projected 6→21/yr by 2055 (HVAC capex compounding) — expect insurance premiums to compound above CPI over the hold.
Questions for the listing agent
- What do current leases actually rent for vs. the listed asking? Can we see a recent rent roll and the last 12 months of T-12 income?
- It's been on market 57 days. Have you received any prior offers? Is the seller open to a 23% concession, seller financing, or rate buy-down credit?
- Built in 1979 — when were the roof, HVAC, electrical panel, plumbing, and water heater last replaced?
- Is there a deadline driving the sale (1031 exchange, divorce, estate, relocation)? That informs how much negotiation room exists.
- Schools are D-rated, which usually means shorter tenancies and higher turnover. Who's the typical renter profile here, and what's been the actual vacancy rate?
- Crime grade is F in this area — have there been break-ins, vandalism, or insurance claims at this property in the last 3 years? What carrier currently insures it and at what premium?
- The area grade is low — what's the realistic commute time and amenity access for the typical tenant pool here? Any planned neighborhood developments (good or bad) we should know about?
- What's the average days-on-market for RENTAL listings here right now (not sales)? A rising rental-DOM trend means longer vacancies and softer asking-rent achievability than the comps imply.
- What's the recent tenant-quality profile in this submarket — average credit score on applications, eviction rate, late-payment / NSF rate, and stable-employment percentage? A property-management company in the area should have these aggregated.
- How much new for-sale + rental construction is in the pipeline within 1–3 miles? Heavy new supply typically softens prices + rents 12–24 months out; constrained supply supports both.
Investment metrics
- 1% rule
- 0.77% ✗
- Cap rate
- 6.19%
- Cash-on-cash
- -0.37%
- DSCR
- 0.98
- GRM
- 10.9
CMA / ARV
No comps found within radius.
Projected returns pro-forma
-3.0% appreciation · 3.45% rent growth · sell at horizon
- IRR
- -16.5%
- Equity multiple
- 0.41×
- Total profit
- $-31,236
- Equity at exit
- $28,330
- IRR
- -7.6%
- Equity multiple
- 0.51×
- Total profit
- $-26,075
- Equity at exit
- $16,428
Cash invested: $53,200 (down + closing). Projections, not guarantees.
Landlord ↔ Tenant lean methodology
- Overall (STATE)
- 55 Moderately Landlord-Leaning
- State New Mexico
- 55 Moderately Landlord-Leaning · D+3
- County
- — inherits STATE
- City
- — inherits STATE
ZIP-level market 88001
- Rents YoY
- 3.5%
- Active inventory
- 143
- Price-to-rent
- 10.9×
Monthly cashflow live
- Estimated rent
- $1,457 high interval (Pro) →
- Mortgage (P&I)
- −$996
- Tax from tax record
- −$92 /mo · $1,099/yr
- Insurance
- −$79
- HOA
- −$0
- Vacancy / Maint / Mgmt
- −$306
- Net cashflow
- $-16
Break-even live
UW: 25.0% down · 7.5% · 30yr · 1.5% tax · 5.0% vac · 8.0% maint · 8.0% mgmt
Financing live
Cash to close
- Down payment
- $47,500
- Closing costs
- $5,700
- Reserves months
- —
- Total cash needed
- —
Loan-product check · same deal, 3 products live
Conventional
25% down · 7.5% · 30yr
- Down + closing
- —
- Monthly P&I
- —
- Monthly cashflow
- —
- DSCR
- —
- Eligible?
- —
Personal DTI + credit; lowest rate.
DSCR
20% down · 8.5% · 30yr
- Down + closing
- —
- Monthly P&I
- —
- Monthly cashflow
- —
- DSCR
- —
- Eligible?
- —
No personal income docs; deal must DSCR.
Hard money
10% down · 12.0% · 12mo
- Down + closing
- —
- Monthly P&I
- —
- Monthly cashflow
- —
- DSCR
- —
- Eligible?
- —
Short-term bridge; refi at stabilization.
Rent comps 20 comps
| Address | Beds | Baths | Sqft | Rent | $/sqft | DOM | Units | Dist |
|---|---|---|---|---|---|---|---|---|
| 1000 Coyote Trl Las Cruces, NM | 3.0 | 2.0 | 1280 | $1,524 | $1.19 | 13d | 1 | 0.17mi |
| 204 N Virginia St Las Cruces, NM | 2.0 | 1.0 | 876 | $1,250 | $1.43 | 43d | 1 | 0.64mi |
| 1914 Sheryl Way Las Cruces, NM | 2.0 | 2.0 | 856 | $1,400 | $1.64 | 13d | 1 | 0.64mi |
| 1595 Carrillo Ct Unit A Las Cruces, NM | 3.0 | 2.0 | 1405 | $1,295 | $0.92 | 43d | 1 | 0.70mi |
| 1980 Buchanan Ave Las Cruces, NM | 3.0 | 2.0 | 1162 | $1,800 | $1.55 | 20d | 1 | 0.75mi |
| 2081 Nehemiah Ct Las Cruces, NM | 3.0 | 1.5 | 1380 | $1,700 | $1.23 | 20d | 1 | 0.75mi |
| 1151 Roadrunner Pkwy Apt 805 Las Cruces, NM | 2.0 | 2.0 | 1157 | $1,710 | $1.48 | 43d | 1 | 1.15mi |
| 1775 Roadrunner Pkwy Unit 1107 Las Cruces, NM | 2.0 | 2.0 | 996 | $1,535 | $1.54 | 43d | 1 | 1.23mi |
| 1775 Roadrunner Pkwy Unit 2901 Las Cruces, NM | 2.0 | 2.0 | 1246 | $1,750 | $1.40 | 20d | 1 | 1.23mi |
| 1775 Roadrunner Pkwy Unit 2405 Las Cruces, NM | 2.0 | 2.0 | 996 | $1,535 | $1.54 | 13d | 1 | 1.23mi |
| 1775 Roadrunner Pkwy Unit 2601 Las Cruces, NM | 3.0 | 2.0 | 1255 | $1,980 | $1.58 | 13d | 1 | 1.23mi |
| 2552 Los Misioneros Las Cruces, NM | 3.0 | 2.0 | 1466 | $1,450 | $0.99 | 20d | 1 | 1.25mi |
| 310 N Alameda Blvd Unit 110 Las Cruces, NM | 2.0 | 2.0 | 885 | $1,350 | $1.53 | 43d | 1 | 1.25mi |
| 501 N Roadrunner Pkwy Las Cruces, NM | 1.0–2.0 | 1.0–2.5 | 1263 | $2,165 | $1.71 | 13d | 3 | 1.28mi |
| 169 Oban Ct Las Cruces, NM | 3.0 | 2.0 | 1289 | $1,350 | $1.05 | 13d | 1 | 1.28mi |
| 2245 San Felipe Las Cruces, NM | 2.0 | 2.0 | 1340 | $1,450 | $1.08 | 43d | 1 | 1.32mi |
| 180 Three Crosses Ave Las Cruces, NM | 1.0–2.0 | 1.0–2.0 | 821 | $1,200 | $1.46 | 13d | 24 | 1.41mi |
| 251 N Roadrunner Pkwy Las Cruces, NM | 1.0–3.0 | 1.0–2.0 | 936 | $1,660 | $1.77 | 13d | 9 | 1.46mi |
| 180 Three Crosses Ave Apt 1022 Las Cruces, NM | 2.0 | 2.0 | 1020 | $1,200 | $1.18 | 20d | 1 | 1.47mi |
| 1020 S Triviz Dr Apt 101 Las Cruces, NM | 2.0 | 2.0 | 1000 | $895 | $0.90 | 44d | 1 | 1.47mi |
Listing history 3 events
-
2026-04-16status Pending
-
2026-03-17price $190,000
-
2026-02-18$195,000 Active
ⓘ Source: listings_history table (triggers on properties + properties_extension) + one-shot
backfill from property_details.listing_events for pre-trigger history.
Tax reassessment forecast NM · Resets to sale price
- Current annual tax
- $1,099 · $92/mo
- Projected year-2 tax
- $1,520 · $127/mo
- Expected delta
- +$421/yr (+$35/mo · 38.4%)
ⓘ Screening estimate from a state-policy table — verify with the county assessor before closing.
Climate risk First Street
- Flood 1/10 Low FEMA zone X (unshaded) · 0% chance over 30 yrs
- Wildfire 3/10 Moderate
- Heat 6/10 Major 6 d/yr ≥99°F today · 21 d/yr by 30 yrs out
- Wind 1/10 Low
- Air quality 1/10 Low 0 unhealthy d/yr today · 0 by 30 yrs out
Nearby sold comps map
Loading sold comps map…
Walkable amenities ~0.75 mi
Loading nearby amenities…
Taxation est. · year 1
- Rental income
- $17,479
- − Mortgage interest
- −$10,643
- − Property taxes
- −$1,099
- − Insurance
- −$950
- − Repairs & maintenance
- −$1,398
- − Management
- −$1,398
- − Depreciation
- −$5,527
- Taxable loss
- −$3,536
- Est. tax savings @ 24.0%
- +$849
- After-tax cash flow
- $652/yr
For passive investors: Depreciation is non-cash, so a rental often shows a tax loss while cash-flowing — sheltering income. Rental losses are passive: they offset passive income freely, and up to $25,000/yr can offset ordinary (W-2) income if you actively participate and your MAGI is under $100k (phasing out to $0 by $150k); unused losses carry forward. On sale, claimed depreciation is recaptured at up to 25%, and gains may owe capital-gains tax (a 1031 exchange can defer both). Figures are a year-1 estimate at your 24.0% rate — not tax advice; consult a CPA.
Schools (NCES district)
- District
- Las Cruces Public Schools
- NCES district ID
- 3501500
- Math proficiency
- 42% ▲ 24.00%
- Reading proficiency
- 68% ▲ 35.00%
- Median HH income
- $41,157
- Composite
- 45.98/100
- National rank
- #2535
- State rank
- #5 of 29 in NM
Livability — Las Cruces
- Score
- 59/100
- State rank
- #120
- US rank
- #19687
Category grades
Schools grade is shown separately in the Schools card above.
Census & demographics
- Census place
- Las Cruces, NM
- County
- Dona Ana County · 144,044 people
- City population
- 131,421
- Metro
- Las Cruces, NM
- Population (ZIP)
- 37,690
- Household income
- $33,087
- Rent vs Own
- Severe rent burden
- 2590.0
Population outlook (Doña Ana County) Hauer SSP2
- Today (2025)
- 219,177 people
- By 2030
- 220,967 · +0.8%
- By 2040
- 222,775 · +1.6%
- By 2050
- 223,576 · +2.0%
- By 2075
- 228,461 · +4.2%
- By 2100
- 214,536 · -2.1%
Race, ethnicity, and origin ACS 2023
- Neighborhood character
- Predominantly Hispanic (72%)
- Race & ethnicity
- Hispanic / Latino 72% Two or more races 24% White 21% Black 3% Asian 2% Native American 2%
- Hispanic origin (detail)
- Mexican 59%
- Common ancestry
- Slovak 1% Italian 1% Romanian 1%
- Foreign-born
- 12% · Canada, South Korea
- Languages at home
- 56% English-only · Spanish 39% Other Indo-European 1% Other Asian/Pacific 1%
Political lean MEDSL · Doña Ana
- 2024 margin
- Lean D (+9.8) · D 53.8% · R 44.0% · Other 2.2%
- 2008→2024 swing
- -7.9pp toward R · 2008: 17.6pp · 2024: 9.8pp
- All cycles
- 2024: D+9.8 2020: D+18.3 2016: D+18.0 2012: D+14.9 2008: D+17.6
Not yet ingested
- Civics
- —
Market trends
- HPI YoY
- ▼ -239.44%
- Current HPI
- 219.0404
- Rent YoY
- ▲ 3.45%
- Metro
- Las Cruces, NM
- State GDP YoY
- —
- F500 in state
- 0
Price history
-2.6% since first listed3 events — show timeline
- 2026-04-16 Pending — SNMMLS as distributed by MLS GRID
- 2026-03-17 Price Changed $190,000 SNMMLS as distributed by MLS GRID
- 2026-02-18 Listed $195,000 SNMMLS as distributed by MLS GRID
Property tax history
+2.8%/yrLatest (2025): $1,099 · +2.4% YoY. Source: county tax records.
Cash-flow waterfall
monthlySold comps — $/sqft
last 12 mo · ≤1 miLoading sold comps…