 Triplex
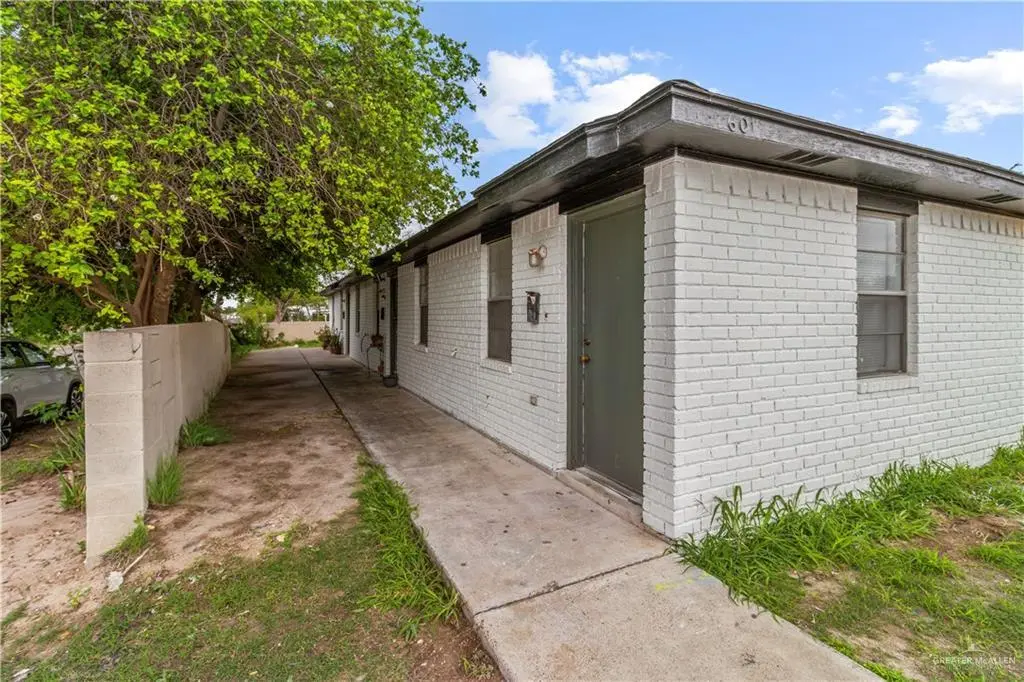
601 N Saint Marie St · Mission, TX
Flood risk 1/10 · Minimal
- FEMA flood zone
- X
- Chance of flooding over 30 yrs
- 0.0%
- Est. flood insurance / yr
- $507 – $1,088
Fire risk 4/10 · Minor
- Est. fire insurance / yr
- $1,222 – $2,270
Heat risk 9/10 · Severe
- Hot days now (above 111°F)
- 7 days/yr
- Hot days in 30 yrs
- 22 days/yr
Wind risk 8/10 · Major
- Chance of severe wind over 30 yrs
- 94.0%
Air-quality risk 2/10 · Minimal
- Unhealthy air days now
- 1 days/yr
- Unhealthy air days in 30 yrs
- 2 days/yr
Risk factors via First Street. Map © Google.
Why this score? — see what drove the B- grade
The composite is a weighted blend of 9 inputs, each scored 0–100. Each bar is that input's sub-score; the figure is the points it added to the 100-point composite (weight × sub-score).
- Cash flow +29.9/30.0
- DSCR +10.0/10.0
- ARV discount +9.1/15.0
- 1% rule +8.4/10.0
- Livability +3.8/5.0
- Rent growth +2.7/5.0
- Condition / age +2.2/5.0
- Schools +1.7/10.0
- Appreciation +0.0/10.0
$229,999
🖨 Deal sheet (PDF) 📄 Offer letter ✓ Due diligence
Multi-family units
County records classify this as Multi-Family (2-4 Unit). Listing-text estimate: 3 units. confirmed
Listing remarks MLS
Great investment opportunity in Mission, TX! This well maintained triplex offers 3 units with 2 bedrooms and 1 bathroom each. Ideal for house hacking; live in one unit while generating income from the others. Exterior has been recently remodeled, providing strong curb appeal and minimizing immediate capital expenses. Current rents are below market, offering clear upside potential for increased cash flow. Conveniently located near the expressway with easy access to schools, parks, dining, and shopping, all within a quiet, established area with strong rental demand. Additional opportunity: 603 N Saint Marie next door is also available for sale. Great potential to acquire multiple units side by side and scale your portfolio. Perfect for investors or owner occupants looking to build long term income and equity.
Key facts
- Strong curb appeal
- 7,500 sq ft lot
- Built 1996
Tags
Neighborhood map
What this means for you Summary
Snapshot
- This is a 3 × 2-bed/1-bath units multifamily listed at $230k. Condition is rated fair.
Deal economics
- At list price, monthly cash flow is $851 ($10k/yr) — positive. Per door: $284/mo.
- The deal already cash-flows at list — no discount required.
- Meets the 1% rule at list price ($3k rent vs $230k).
- Recommended offer: $223k (3.0% below list) — sets the bar for market timing.
- Cap rate 10.7% vs local median 3.5% in Mission — top-decile yield for the area; either an underpriced asset or a hidden risk that comps aren't pricing in. Stress-test before assuming the spread holds.
Location & tenants
- Location reads 75/100 on livability (#148 in TX, #4,155 nationally) — a middle-class / working-renter tenant base. Strengths: cost of living A+, housing A+, health & safety A+; Watch: schools C-, amenities F, commute F.
- Mission CISD (urban): math 15% / reading 28% proficiency, ranked #775 of 826 in TX (top 94%) — low school quality limits family demand, transient renter base, plan for 1-2y turnover; 78% free/reduced lunch — lower-income household profile, screen leases tightly.
- Market conditions: Rents flat; 852 active listings in the ZIP; 3 comparable units currently listed for rent nearby; rentals lingering (median 45d on market — plan ~5-8 weeks vacancy on turnover, expect pricing pressure); 67% of comp listings sitting > 30 days — soft ceiling on asking rent; 7,378 units permitted in Hidalgo County in 2024 (641 in 5+ unit buildings).
- At $3,089/mo this rent would consume 68% of the median local household income ($54k/yr) (locally 1714% of renters already pay >50% of income on rent) — very limited rent-growth headroom before tenants either downsize or default.
Forward outlook
- Local home prices are declining (-3.0%/yr); year-one equity from $2k of loan paydown is wiped out by about $7k of value loss. Plan a longer hold.
- Hidalgo County population projected at +28% by 2050 — long-run rental-demand tailwind backs the buy-and-hold thesis.
- At projected returns (-3.0% appreciation + 0.9% rent growth), your $64k cash investment doubles in ~10 years — after that, you're playing with house money.
Negotiation context
- It's been on market 59 days — a 3% lower offer ($223k) is reasonable based on typical stale-listing flexibility.
Risks & watch-outs
- Climate carrying-cost: severe wind risk, 94% chance of damaging wind over 30y; extreme-heat days projected 7→22/yr by 2055 (HVAC capex compounding) — expect insurance premiums to compound above CPI over the hold.
Questions for the listing agent
- It's been on market 59 days. Have you received any prior offers? Is the seller open to a 3% concession, seller financing, or rate buy-down credit?
- Can we see the unit-by-unit rent roll, current vacancy, and any below-market leases? What's the average tenancy length?
- What capital expenditures (roof, boiler, parking lot, exteriors) have been made in the last 5 years, and what's planned in the next 2?
- Have any recent inspections been done? Can we get a copy of the seller's disclosures and any deferred-maintenance estimates?
- Is there a deadline driving the sale (1031 exchange, divorce, estate, relocation)? That informs how much negotiation room exists.
- What's the average days-on-market for RENTAL listings here right now (not sales)? A rising rental-DOM trend means longer vacancies and softer asking-rent achievability than the comps imply.
- What's the recent tenant-quality profile in this submarket — average credit score on applications, eviction rate, late-payment / NSF rate, and stable-employment percentage? A property-management company in the area should have these aggregated.
- How much new apartment / multifamily construction is in the pipeline within 1–3 miles? Heavy new supply (>2% of stock underway) typically softens rents 12–24 months out; light construction supports rent growth.
Investment metrics
- 1% rule
- 1.34% ✓
- Cap rate
- 10.73%
- Cash-on-cash
- 15.85%
- DSCR
- 1.71
- GRM
- 6.2
CMA / ARV
- ARV (median comp)
- $238,577
- List price
- $229,999
- Delta
- -3.60%
- Verdict
- FAIR
- Comps
- 8 within 1.0 mi
Show comp detail 3 sales within ~0.75 mi
| Address | Dist | Beds/Ba | Sqft | Sold | Price | $/sf | Match |
|---|---|---|---|---|---|---|---|
| 921 Laredo St | 0.25mi | —/— | 2,240 (-3%) | 18mo | $155,000 | $69 | 68 |
| 1212 N Saint Marie St | 0.47mi | —/— | 2,172 (-6%) | 5mo | $130,000 | $60 | 64 |
| 523 Perkins Ave | 0.50mi | —/— | 2,100 (-9%) | 4mo | $235,000 | $112 | 58 |
Match score weights: distance 35% · size 25% · config 20% · recency 20%. Top-matched comps best support the ARV.
Projected returns pro-forma
-3.0% appreciation · 0.93% rent growth · sell at horizon
- IRR
- 4.4%
- Equity multiple
- 1.17×
- Total profit
- $10,663
- Equity at exit
- $34,294
- IRR
- 11.9%
- Equity multiple
- 1.85×
- Total profit
- $54,439
- Equity at exit
- $19,886
Cash invested: $64,400 (down + closing). Projections, not guarantees.
Landlord ↔ Tenant lean methodology
- Overall (STATE)
- 87 Strongly Landlord-Friendly
- State Texas
- 87 Strongly Landlord-Friendly · R+5
- County
- — inherits STATE
- City
- — inherits STATE
ZIP-level market 78572
- Home prices YoY
- -22.9%
- Rents YoY
- 0.9%
- Active inventory
- 852
- Price-to-rent
- 18.6×
Monthly cashflow live
- Estimated rent
- $3,089 high interval (Pro) →
- Mortgage (P&I)
- −$1,206
- Tax est. 1.5%
- −$287 /mo · $3,450/yr
- Insurance
- −$96
- HOA
- −$0
- Vacancy / Maint / Mgmt
- −$649
- Net cashflow
- $851
Break-even live
Sensitivity live
| Price | -10% $1,010 | -5% $930 | +0% $851 | +5% $771 | +10% $692 |
|---|---|---|---|---|---|
| Rent | -10% $607 | -5% $729 | +0% $851 | +5% $973 | +10% $1,095 |
| Rate | -1.0pp $967 | -0.5pp $909 | base $851 | +0.5pp $791 | +1.0pp $731 |
3-unit breakdown (identical units grouped — click to expand)
| Units | Beds | Baths | Est. rent |
|---|---|---|---|
| 3× units | 2 | 1 | $3,090 |
| #1 | 2 | 1 | $1,030 |
| #2 | 2 | 1 | $1,030 |
| #3 | 2 | 1 | $1,030 |
| Total (3 units) | $3,089 | ||
UW: 25.0% down · 7.5% · 30yr · 1.5% tax · 5.0% vac · 8.0% maint · 8.0% mgmt
Financing live
Cash to close
- Down payment
- $57,500
- Closing costs
- $6,900
- Reserves months
- —
- Total cash needed
- —
Loan-product check · same deal, 3 products live
Conventional
25% down · 7.5% · 30yr
- Down + closing
- —
- Monthly P&I
- —
- Monthly cashflow
- —
- DSCR
- —
- Eligible?
- —
Personal DTI + credit; lowest rate.
DSCR
20% down · 8.5% · 30yr
- Down + closing
- —
- Monthly P&I
- —
- Monthly cashflow
- —
- DSCR
- —
- Eligible?
- —
No personal income docs; deal must DSCR.
Hard money
10% down · 12.0% · 12mo
- Down + closing
- —
- Monthly P&I
- —
- Monthly cashflow
- —
- DSCR
- —
- Eligible?
- —
Short-term bridge; refi at stabilization.
Rent comps 3 comps
| Address | Beds | Baths | Sqft | Rent | $/sqft | DOM | Units | Dist |
|---|---|---|---|---|---|---|---|---|
| 825 W First St Unit 3 Mission, TX | 2.0 | 1.0 | 3040 | $625 | $0.21 | 44d | 1 | 1.05mi |
| 903 W 1st St Mission, TX | 2.0 | 1.0 | 2800 | $575 | $0.21 | 44d | 1 | 1.06mi |
| 2216 Robyn Ln Mission, TX | 3.0 | 3.0 | 2033 | $2,000 | $0.98 | 22d | 1 | 1.36mi |
Listing history 16 events
-
2026-06-18days on market $229,999 Active 59 DOM
-
2026-06-17days on market $229,999 Active 58 DOM
-
2026-06-16days on market $229,999 Active 57 DOM
-
2026-06-15days on market $229,999 Active 56 DOM
-
2026-06-14pricedays on market $229,999 Active 54 DOM
-
2026-06-10days on market $239,000 Active 51 DOM
-
2026-06-09days on market $239,000 Active 50 DOM
-
2026-06-08days on market $239,000 Active 49 DOM
-
2026-06-07days on market $239,000 Active 48 DOM
-
2026-06-03days on market $239,000 Active 44 DOM
-
2026-06-03price $239,000 Active 43 DOM
-
2026-06-02days on market $250,000 Active 43 DOM
-
2026-06-01days on market $250,000 Active 42 DOM
-
2026-05-31days on market $250,000 Active 41 DOM
-
2026-05-31days on market $250,000 Active 40 DOM
-
2026-04-21$250,000 Active 818-char remark
Show marketing remark (818 chars)
Great investment opportunity in Mission, TX! This well maintained triplex offers 3 units with 2 bedrooms and 1 bathroom each. Ideal for house hacking; live in one unit while generating income from the others. Exterior has been recently remodeled, providing strong curb appeal and minimizing immediate capital expenses. Current rents are below market, offering clear upside potential for increased cash flow. Conveniently located near the expressway with easy access to schools, parks, dining, and shopping, all within a quiet, established area with strong rental demand. Additional opportunity: 603 N Saint Marie next door is also available for sale. Great potential to acquire multiple units side by side and scale your portfolio. Perfect for investors or owner occupants looking to build long term income and equity.
ⓘ Source: listings_history table (triggers on properties + properties_extension) + one-shot
backfill from property_details.listing_events for pre-trigger history.
Climate risk First Street
- Flood 1/10 Low FEMA zone X · 0% chance over 30 yrs
- Wildfire 4/10 Moderate
- Heat 9/10 Extreme 7 d/yr ≥111°F today · 22 d/yr by 30 yrs out
- Wind 8/10 Severe 94% chance of damaging wind over 30 yrs
- Air quality 2/10 Low 1 unhealthy d/yr today · 2 by 30 yrs out
Nearby sold comps map
Loading sold comps map…
Walkable amenities ~0.75 mi
Loading nearby amenities…
Taxation est. · year 1
- Rental income
- $37,068
- − Mortgage interest
- −$12,884
- − Property taxes
- −$3,450
- − Insurance
- −$1,150
- − Repairs & maintenance
- −$2,965
- − Management
- −$2,965
- − Depreciation
- −$6,691
- Taxable income
- $6,963
- Est. tax owed @ 24.0%
- −$1,671
- After-tax cash flow
- $8,539/yr
For passive investors: Depreciation is non-cash, so a rental often shows a tax loss while cash-flowing — sheltering income. Rental losses are passive: they offset passive income freely, and up to $25,000/yr can offset ordinary (W-2) income if you actively participate and your MAGI is under $100k (phasing out to $0 by $150k); unused losses carry forward. On sale, claimed depreciation is recaptured at up to 25%, and gains may owe capital-gains tax (a 1031 exchange can defer both). Figures are a year-1 estimate at your 24.0% rate — not tax advice; consult a CPA.
Condition & rehab AI · 10 photos
This triplex requires moderate renovations to improve its condition and increase its value. Upgrades to the kitchen and bathrooms, along with roof repairs, will significantly enhance its appeal to both buyers and renters.
Repairs flagged
- Minor kitchen cabinets — slight wear
- Minor bathroom fixtures — slight wear
- Moderate roof — visible wear
Value-add opportunities
- Both update kitchen cabinets and fixtures — modernizing kitchen will appeal to buyers and renters
- Both replace checkered floor tiles — modernizing bathrooms will appeal to buyers and renters
- Both repair and replace roof — improving roof will increase property value and reduce maintenance costs
Renovation cost estimate screening
| Repair item | Severity | Est. cost |
|---|---|---|
| kitchen cabinets · slight wear | Minor | $500–3,000 |
| bathroom fixtures · slight wear | Minor | $500–3,000 |
| roof · visible wear | Moderate | $3,000–15,000 |
| Total estimated repair cost · 3 items | $4,000–21,000 |
Value-add ROI direction
- Both update kitchen cabinets and fixtures — modernizing kitchen will appeal to buyers and renters ↑
- Both replace checkered floor tiles — modernizing bathrooms will appeal to buyers and renters ↑
- Both repair and replace roof — improving roof will increase property value and reduce maintenance costs ↑
ⓘ Cost ranges are severity-bucket heuristics (US national rule-of-thumb). Get contractor quotes + a written scope before underwriting a rehab budget.
Schools (NCES district)
- District
- Mission CISD
- NCES district ID
- 4831040
- Math proficiency
- 15% ▼ -35.00%
- Reading proficiency
- 28% ▼ -15.00%
- Median HH income
- $32,855
- Composite
- 17.47/100
- National rank
- #9061
- State rank
- #775 of 826 in TX
Livability — Mission
- Score
- 75/100
- State rank
- #148
- US rank
- #4155
Category grades
Schools grade is shown separately in the Schools card above.
Census & demographics
- Census place
- Mission, TX
- County
- Hidalgo County · 623,128 people
- City population
- 78,024
- Metro
- McAllen-Edinburg-Mission, TX
- Population (ZIP)
- 78,024
- Household income
- $54,298
- Rent vs Own
- Severe rent burden
- 1714.0
Population outlook (Hidalgo County) Hauer SSP2
- Today (2025)
- 955,232 people
- By 2030
- 1,009,774 · +5.7%
- By 2040
- 1,120,332 · +17.3%
- By 2050
- 1,225,036 · +28.2%
- By 2075
- 1,439,189 · +50.7%
- By 2100
- 1,533,429 · +60.5%
Race, ethnicity, and origin ACS 2023
- Neighborhood character
- Predominantly Hispanic (85%)
- Race & ethnicity
- Hispanic / Latino 85% Two or more races 47% White 12% Asian 2%
- Hispanic origin (detail)
- Mexican 80%
- Common ancestry
- Slovak 1% Portuguese 0%
- Foreign-born
- 28% · Canada, South Korea
- Languages at home
- 22% English-only · Spanish 76%
Political lean MEDSL · Hidalgo
- 2024 margin
- Toss-up / Even · D 48.1% · R 51.0%
- 2008→2024 swing
- -41.6pp toward R · 2008: 38.7pp · 2024: -2.9pp
- All cycles
- 2024: R+2.9 2020: D+17.1 2016: D+40.5 2012: D+41.8 2008: D+38.7
Not yet ingested
- Civics
- —
Market trends
- HPI YoY
- ▼ -62.35%
- Current HPI
- 209.3573
- Rent YoY
- ▲ 0.93%
- Metro
- McAllen-Edinburg-Mission, TX
- State GDP YoY
- ▲ 3.95%
- F500 in state
- 110
Industry mix (Fortune 500 HQ in TX)
| Industry | F500 HQs | Revenue |
|---|---|---|
| Energy | 16 | $1,198B |
|
||
| Technology | 5 | $198B |
|
||
| Engineering / Construction | 4 | $72B |
|
||
| Energy Services | 3 | $60B |
|
||
| Utilities | 3 | $41B |
|
||
| Healthcare | 2 | $330B |
|
||
Price history
1 event — show timeline
- 2026-04-21 Listed $250,000 MCALLENMLS
Cash-flow waterfall
monthlySold comps — $/sqft
last 12 mo · ≤1 miLoading sold comps…