None · Akron, OH
Flood risk 1/10 · Minimal
- FEMA flood zone
- X (unshaded)
- Chance of flooding over 30 yrs
- 0.0%
- Est. flood insurance / yr
- $473 – $860
Fire risk 1/10 · Minimal
- Est. fire insurance / yr
- $713 – $1,323
Heat risk 3/10 · Minor
- Hot days now (above 96°F)
- 7 days/yr
- Hot days in 30 yrs
- 17 days/yr
Wind risk 1/10 · Minimal
- Chance of severe wind over 30 yrs
- —
Air-quality risk 2/10 · Minimal
- Unhealthy air days now
- 1 days/yr
- Unhealthy air days in 30 yrs
- 2 days/yr
Risk factors via First Street. Map © Google.
Why this score? — see what drove the C+ grade
The composite is a weighted blend of 9 inputs, each scored 0–100. Each bar is that input's sub-score; the figure is the points it added to the 100-point composite (weight × sub-score).
- Cash flow +21.8/30.0
- ARV discount +15.0/15.0
- 1% rule +7.3/10.0
- DSCR +7.0/10.0
- Livability +4.0/5.0
- Rent growth +3.5/5.0
- Condition / age +2.5/5.0
- Schools +2.1/10.0
- Appreciation +0.0/10.0
$81,900
🖨 Deal sheet 📄 Offer letter ✓ Due diligence
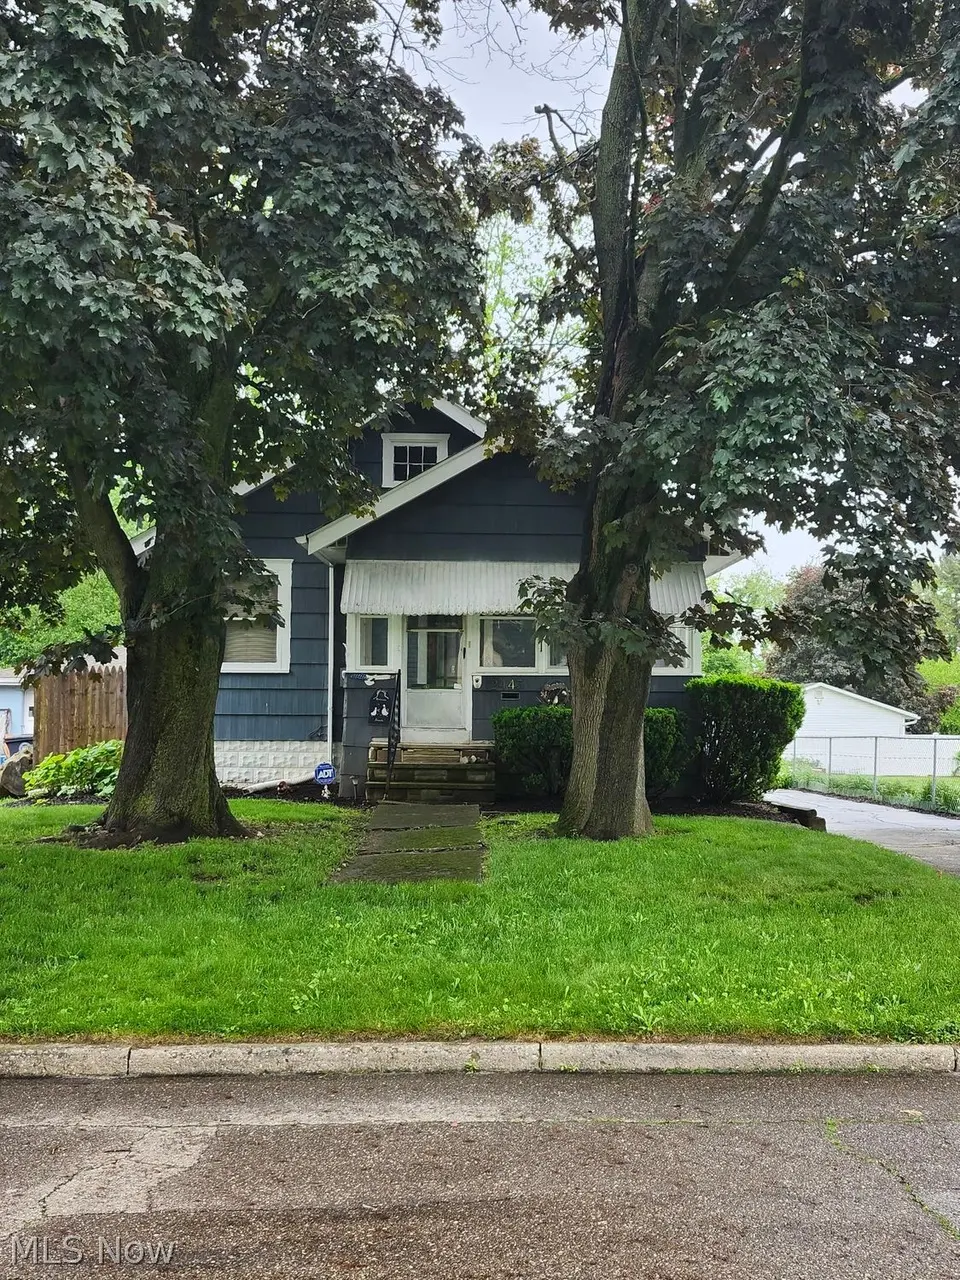
Listing remarks
Nestled in the well kept quiet Allenside neighborhood, this ranch style bungalow is sure to please. Just a block from the Ohio Canal Towpath Trail with fishing, biking, walking trails and more just a stone through away. You'll enjoy sipping your morning coffee on the tranquil enclosed sunporch. The cozy living room offers a decorative fireplace. Great formal dining room provides plenty of room for hosting those memorable family dinners. Kitchen provides quaint breakfast room overlooking the privacy fenced back yard. The spacious sun deck is ready for all your outdoor entertaining. Nice plus size garage adds additional storage space. Conveniently located to area shopping, restaurants, thrivi
Key facts
- Decorative fireplace
- Formal dining room
- Breakfast room
Tags
Neighborhood map
What this means for you Summary
Snapshot
- This is a 2-bed/1.0-bath single-family listed at $82k.
Deal economics
- At list price, monthly cash flow is $128 ($2k/yr) — positive.
- The deal already cash-flows at list — no discount required.
- Meets the 1% rule at list price ($1k rent vs $82k).
- Cap rate 8.2% vs local median 6.6% in Akron — meaningfully above typical; check what's discounted (condition, days-on-market, listing class) to confirm the premium yield is real.
Location & tenants
- Location reads 81/100 on livability (#104 in OH, #1,591 nationally) — a professional / high-income tenant draw. Strengths: amenities A+, commute A+, cost of living A+; Watch: crime F, employment F.
- Akron City (urban): math 22% / reading 30% proficiency, ranked #602 of 656 in OH (top 92%) — low school quality limits family demand, transient renter base, plan for 1-2y turnover; 66% free/reduced lunch — lower-income household profile, screen leases tightly.
- Market conditions: Rents rising (+3.9%/yr); 104 active listings in the ZIP; 12 comparable units currently listed for rent nearby; rentals lingering (median 44d on market — plan ~5-8 weeks vacancy on turnover, expect pricing pressure); 50% of comp listings sitting > 30 days — soft ceiling on asking rent; 1,114 units permitted in Summit County in 2024 (397 in 5+ unit buildings).
Forward outlook
- Local home prices are declining (-3.0%/yr); year-one equity from $566 of loan paydown is wiped out by about $2k of value loss. Plan a longer hold.
- Summit County population projected to shrink 6% by 2050 — rents likely to lag national; underwrite the cash flow, not the appreciation.
Negotiation context
- Only 1 days on market — expect competitive offers; lowballing is unlikely to land.
- 4 sale attempts since 35y ago with the ask held roughly flat each time — persistent listings suggest the price (not the market) is what's stuck; bring a comps-based counter.
- Current owner paid $65k; 26% above their basis — modest negotiation headroom, anchor on the comps not their cost.
Risks & watch-outs
- Watch-outs: property tax is 3.0% of price; built in 1929 — expect roof / HVAC / electrical / plumbing capex.
Questions for the listing agent
- Built in 1929 — when were the roof, HVAC, electrical panel, plumbing, and water heater last replaced?
- Property tax is high relative to price — has the assessment been appealed recently, and will the sale trigger a re-assessment?
- Is there a deadline driving the sale (1031 exchange, divorce, estate, relocation)? That informs how much negotiation room exists.
- Crime grade is F in this area — have there been break-ins, vandalism, or insurance claims at this property in the last 3 years? What carrier currently insures it and at what premium?
- What's the average days-on-market for RENTAL listings here right now (not sales)? A rising rental-DOM trend means longer vacancies and softer asking-rent achievability than the comps imply.
- What's the recent tenant-quality profile in this submarket — average credit score on applications, eviction rate, late-payment / NSF rate, and stable-employment percentage? A property-management company in the area should have these aggregated.
- How much new for-sale + rental construction is in the pipeline within 1–3 miles? Heavy new supply typically softens prices + rents 12–24 months out; constrained supply supports both.
Investment metrics
- 1% rule
- 1.23% ✓
- Cap rate
- 8.17%
- Cash-on-cash
- 6.69%
- DSCR
- 1.30
- GRM
- 6.8
CMA / ARV
- ARV (on-the-fly)
- $122,640
- Comps found
- 12
Show comp detail 12 sales within ~0.75 mi
| Address | Dist | Beds/Ba | Sqft | Sold | Price | $/sf | Match |
|---|---|---|---|---|---|---|---|
| 392 Rexford St | 0.09mi | 2/1.0 | 828 (-6%) | 1mo | $135,000 | $163 | 86 |
| 424 Lockwood St | 0.16mi | 2/1.0 | 876 (0%) | 11mo | $110,000 | $126 | 84 |
| 355 Lockwood St | 0.11mi | 2/1.0 | 772 (-12%) | 5mo | $108,000 | $140 | 71 |
| 2255 Nesmith Lake Blvd | 0.35mi | 2/1.0 | 942 (+8%) | 2mo | $116,500 | $124 | 70 |
| 363 Lockwood St | 0.11mi | 2/1.0 | 772 (-12%) | 7mo | $110,550 | $143 | 69 |
| 2407 Nesmith Lake Blvd | 0.12mi | 2/1.0 | 1,002 (+14%) | 2mo | $131,000 | $131 | 69 |
| 2313 Nesmith Lake Blvd | 0.25mi | 2/1.0 | 802 (-8%) | 12mo | $108,000 | $135 | 64 |
| 474 Rexford St | 0.24mi | 2/2.0 | 968 (+10%) | 11mo | $175,000 | $181 | 58 |
| 2676 Christensen Ave | 0.43mi | 3/2.0 (+1) | 798 (-9%) | 1mo | $175,000 | $219 | 55 |
| 372 Waterford St | 0.14mi | 3/2.0 (+1) | 988 (+13%) | 11mo | $146,000 | $148 | 54 |
| 486 Stanford St | 0.28mi | 3/1.0 (+1) | 971 (+11%) | 14mo | $119,600 | $123 | 53 |
| 2645 Pelton Ave | 0.45mi | 2/1.0 | 960 (+10%) | 14mo | $118,750 | $124 | 51 |
Match score weights: distance 35% · size 25% · config 20% · recency 20%. Top-matched comps best support the ARV.
Projected returns pro-forma
-3.0% appreciation · 3.91% rent growth · sell at horizon
- IRR
- -4.8%
- Equity multiple
- 0.82×
- Total profit
- $-4,130
- Equity at exit
- $12,212
- IRR
- 6.2%
- Equity multiple
- 1.48×
- Total profit
- $11,070
- Equity at exit
- $7,081
Cash invested: $22,932 (down + closing). Projections, not guarantees.
Landlord ↔ Tenant lean methodology
- Overall (STATE)
- 73 Landlord-Friendly
- State Ohio
- 73 Landlord-Friendly · R+6
- County
- — inherits STATE
- City
- — inherits STATE
ZIP-level market 44314
- Rents YoY
- 3.9%
- Active inventory
- 104
- Price-to-rent
- 6.8×
Monthly cashflow live
- Estimated rent
- $1,004 high interval (Pro) →
- Mortgage (P&I)
- −$429
- Tax from tax record
- −$202 /mo · $2,421/yr
- Insurance
- −$34
- HOA
- −$0
- Vacancy / Maint / Mgmt
- −$211
- Net cashflow
- $128
Break-even live
UW: 25.0% down · 7.5% · 30yr · 1.5% tax · 5.0% vac · 8.0% maint · 8.0% mgmt
Financing live
Cash to close
- Down payment
- $20,475
- Closing costs
- $2,457
- Reserves months
- —
- Total cash needed
- —
Loan-product check · same deal, 3 products live
Conventional
25% down · 7.5% · 30yr
- Down + closing
- —
- Monthly P&I
- —
- Monthly cashflow
- —
- DSCR
- —
- Eligible?
- —
Personal DTI + credit; lowest rate.
DSCR
20% down · 8.5% · 30yr
- Down + closing
- —
- Monthly P&I
- —
- Monthly cashflow
- —
- DSCR
- —
- Eligible?
- —
No personal income docs; deal must DSCR.
Hard money
10% down · 12.0% · 12mo
- Down + closing
- —
- Monthly P&I
- —
- Monthly cashflow
- —
- DSCR
- —
- Eligible?
- —
Short-term bridge; refi at stabilization.
Rent comps 12 comps
| Address | Beds | Baths | Sqft | Rent | $/sqft | DOM | Units | Dist |
|---|---|---|---|---|---|---|---|---|
| 2266 5th St SW Akron, OH | 2.0 | 1.0 | 676 | $750 | $1.11 | 14d | 1 | 0.84mi |
| 2264 5th St SW Unit 2266 Akron, OH | 2.0 | 1.0 | 676 | $750 | $1.11 | 14d | 1 | 0.84mi |
| 835 Kenmore Blvd Unit UP Akron, OH | 2.0 | 1.0 | 872 | $750 | $0.86 | 21d | 1 | 1.10mi |
| 101 E Firestone Blvd Akron, OH | 1.0 | 1.0 | 675 | $881 | $1.31 | 23d | 6 | 1.17mi |
| 58 E Archwood Ave Akron, OH | 2.0 | 1.0 | 750 | $850 | $1.13 | 43d | 1 | 1.25mi |
| 46 Brighton Dr Akron, OH | 2.0 | 1.0 | 850 | $1,100 | $1.29 | 43d | 1 | 1.29mi |
| 67 E Archwood Ave Unit A Akron, OH | 2.0 | 1.0 | 1000 | $850 | $0.85 | 43d | 1 | 1.30mi |
| 94 Brighton Dr Akron, OH | 3.0 | 1.0 | 1000 | $1,100 | $1.10 | 43d | 1 | 1.34mi |
| 45 E Emerling Ave Unit F Akron, OH | 2.0 | 1.0 | 850 | $795 | $0.94 | 43d | 1 | 1.34mi |
| 147 Brighton Dr Akron, OH | 3.0 | 1.0 | 1040 | $1,350 | $1.30 | 23d | 1 | 1.42mi |
| 234 Mallard Point Dr Akron, OH | 1.0–2.0 | 1.0–2.0 | 945 | $1,530 | $1.62 | 14d | 18 | 1.43mi |
| 2139 18th St SW Akron, OH | 2.0 | 1.0 | 992 | $1,100 | $1.11 | 43d | 1 | 1.49mi |
Listing history 3 events
-
2026-06-02status $81,900 Pending 1 DOM
-
2026-06-01remarks 699-char remark
-
2026-06-01$81,900 Active 1 DOM
ⓘ Source: listings_history table (triggers on properties + properties_extension) + one-shot
backfill from property_details.listing_events for pre-trigger history.
Tax reassessment forecast OH · Partial reset (capped growth)
- Current annual tax
- $2,421 · $202/mo
- Projected year-2 tax
- $2,421 · $202/mo
- Expected delta
- $0/yr ($0/mo · 0.0%)
ⓘ Screening estimate from a state-policy table — verify with the county assessor before closing.
Climate risk First Street
- Flood 1/10 Low FEMA zone X (unshaded) · 0% chance over 30 yrs
- Wildfire 1/10 Low
- Heat 3/10 Moderate 7 d/yr ≥96°F today · 17 d/yr by 30 yrs out
- Wind 1/10 Low
- Air quality 2/10 Low 1 unhealthy d/yr today · 2 by 30 yrs out
Nearby sold comps map
Loading sold comps map…
Walkable amenities ~0.75 mi
Loading nearby amenities…
Taxation est. · year 1
- Rental income
- $12,048
- − Mortgage interest
- −$4,588
- − Property taxes
- −$2,421
- − Insurance
- −$410
- − Repairs & maintenance
- −$964
- − Management
- −$964
- − Depreciation
- −$2,383
- Taxable income
- $319
- Est. tax owed @ 24.0%
- −$77
- After-tax cash flow
- $1,457/yr
For passive investors: Depreciation is non-cash, so a rental often shows a tax loss while cash-flowing — sheltering income. Rental losses are passive: they offset passive income freely, and up to $25,000/yr can offset ordinary (W-2) income if you actively participate and your MAGI is under $100k (phasing out to $0 by $150k); unused losses carry forward. On sale, claimed depreciation is recaptured at up to 25%, and gains may owe capital-gains tax (a 1031 exchange can defer both). Figures are a year-1 estimate at your 24.0% rate — not tax advice; consult a CPA.
Schools (NCES district)
- District
- Akron City
- NCES district ID
- 3904348
- Math proficiency
- 22% ▼ -17.00%
- Reading proficiency
- 30% ▼ -12.00%
- Median HH income
- $33,811
- Composite
- 21.31/100
- National rank
- #8383
- State rank
- #602 of 656 in OH
Livability — Akron
- Score
- 81/100
- State rank
- #104
- US rank
- #1591
Category grades
Schools grade is shown separately in the Schools card above.
Census & demographics
- Census place
- Akron, OH
- County
- Summit County · 440,783 people
- City population
- 174,375
- Metro
- Akron, OH
- Population (ZIP)
- 17,885
- Household income
- $47,468
- Rent vs Own
- Severe rent burden
- 975.0
Population outlook (Summit County) Hauer SSP2
- Today (2025)
- 546,583 people
- By 2030
- 544,028 · -0.5%
- By 2040
- 531,363 · -2.8%
- By 2050
- 514,923 · -5.8%
- By 2075
- 481,765 · -11.9%
- By 2100
- 432,265 · -20.9%
Race, ethnicity, and origin ACS 2023
- Neighborhood character
- Predominantly White (69%)
- Race & ethnicity
- White 69% Black 16% Two or more races 12% Hispanic / Latino 3% Asian 3%
- Common ancestry
- Slovak 2% Romanian 2% Lithuanian 1%
- Foreign-born
- 3% · India, Canada, Philippines
- Languages at home
- 96% English-only · Chinese 2% Russian/Polish/Slavic 1% Spanish 1%
Political lean MEDSL · Summit
- 2024 margin
- Lean D (+7.0) · D 53.0% · R 46.0%
- 2008→2024 swing
- -9.6pp toward R · 2008: 16.6pp · 2024: 7.0pp
- All cycles
- 2024: D+7.0 2020: D+9.6 2016: D+8.2 2012: D+14.8 2008: D+16.6
Not yet ingested
- Civics
- —
Market trends
- HPI YoY
- ▼ -166.61%
- Current HPI
- 151.066
- Rent YoY
- ▲ 3.91%
- Metro
- Akron, OH
- State GDP YoY
- ▲ 1.98%
- F500 in state
- 48
Industry mix (Fortune 500 HQ in OH)
| Industry | F500 HQs | Revenue |
|---|---|---|
| Insurance | 3 | $145B |
|
||
| Industrial Machinery | 3 | $49B |
|
||
| Financial Services | 3 | $24B |
|
||
| Consumer Goods | 2 | $93B |
|
||
| Aerospace / Defense | 2 | $47B |
|
||
| Utilities | 2 | $33B |
|
||
Price history
+76.1% since first listed23 events — show timeline
- 2026-05-29 Listed $81,900 MLSNOW
- 2023-07-14 Price Changed $69,900 MLSNOW
- 2023-07-14 Price Changed $69,900 MLSNOW
- 2023-07-14 Price Changed $69,900 MLSNOW
- 2023-07-14 Price Changed $69,900 MLSNOW
- 2020-10-27 Price Changed $69,900 MLSNOW
- 2020-05-02 Price Changed $69,900 MLSNOW
- 2014-02-12 Price Changed $69,900 MLSNOW
- 2014-02-12 Price Changed $69,900 MLSNOW
- 2000-09-01 Listing Removed — MLSNOW
- 2000-04-21 Listed $193,777 MLSNOW
- 1997-11-08 Price Changed $193,777 MLSNOW
- 1997-11-08 Price Changed $193,777 MLSNOW
- 1997-11-08 Price Changed $193,777 MLSNOW
- 1997-11-08 Price Changed $193,777 MLSNOW
- 1997-11-08 Price Changed $193,777 MLSNOW
- 1997-11-08 Price Changed $193,777 MLSNOW
- 1997-11-08 Price Changed $193,777 MLSNOW
- 1997-08-27 Sold (Public Records) $65,000 Public Records
- 1993-09-30 Sold (Public Records) $48,500 Public Records
- 1993-07-28 Listed $48,500 MLSNOW
- 1991-06-19 Sold (Public Records) $43,000 Public Records
- 1991-02-12 Listed $46,500 MLSNOW
Property tax history
+5.4%/yrLatest (2025): $2,421 · +19.2% YoY. Source: county tax records.
Cash-flow waterfall
monthlySold comps — $/sqft
last 12 mo · ≤1 miLoading sold comps…