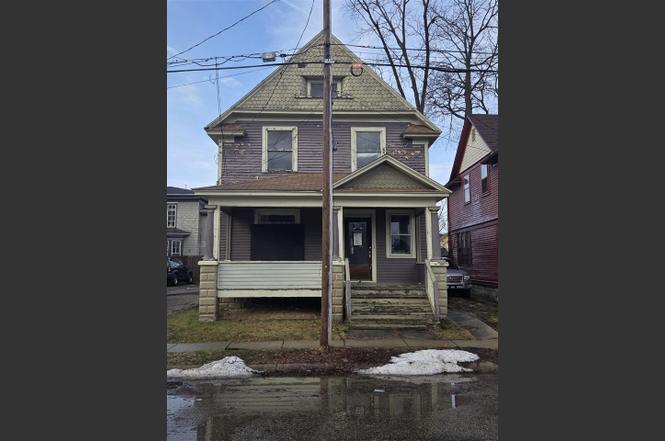
528 Potter St · Kalamazoo, MI
Flood risk 1/10 · Minimal
- FEMA flood zone
- X (unshaded)
- Chance of flooding over 30 yrs
- 0.0%
- Est. flood insurance / yr
- $507 – $1,088
Fire risk 1/10 · Minimal
- Est. fire insurance / yr
- $784 – $1,456
Heat risk 3/10 · Minor
- Hot days now (above 100°F)
- 7 days/yr
- Hot days in 30 yrs
- 16 days/yr
Wind risk 2/10 · Minimal
- Chance of severe wind over 30 yrs
- —
Air-quality risk 2/10 · Minimal
- Unhealthy air days now
- 1 days/yr
- Unhealthy air days in 30 yrs
- 2 days/yr
Risk factors via First Street. Map © Google.
Why this score? — see what drove the B grade
The composite is a weighted blend of 9 inputs, each scored 0–100. Each bar is that input's sub-score; the figure is the points it added to the 100-point composite (weight × sub-score).
- Cash flow +30.0/30.0
- 1% rule +10.0/10.0
- DSCR +10.0/10.0
- ARV discount +7.5/15.0
- Schools +4.7/10.0
- Livability +3.8/5.0
- Condition / age +2.5/5.0
- Rent growth +2.3/5.0
- Appreciation +0.0/10.0
$89,900
🖨 Deal sheet (PDF) 📄 Offer letter ✓ Due diligence
Listing remarks MLS
Downtown opportunity for customization for your personal house, flip, or an income property. The property is NOT in the historic district! Two story shell is ideal as a 3-4 bedroom home or a duplex. The house needs to be renovated. CASH ''AS IS'' OFFERS ONLY.
Key facts
- 2,178 sq ft lot
- Built 1910
- Listed 119 days
Property features AI
Exterior
- Utilities: Public water; Natural gas available and connected; Electricity available
- Home design: Traditional single-family residence; 1,552 sq. ft. living area; Built in 1910
- Construction: Wood siding; Year built: 1910
- Exterior features: Paved road access; Lot approximately 0.05 acres
Interior
- Bathrooms: 2 full bathrooms
- Interior features: 9 total rooms; Full basement
Neighborhood map
What this means for you Summary
Snapshot
- This is a 2-bed/2.0-bath single-family listed at $90k.
Deal economics
- At list price, monthly cash flow is $778 ($9k/yr) — positive.
- The deal already cash-flows at list — no discount required.
- Meets the 1% rule at list price ($2k rent vs $90k).
- Recommended offer: $82k (9.0% below list) — sets the bar for market timing.
- Cap rate 16.7% vs local median 4.1% in Kalamazoo — top-decile yield for the area; either an underpriced asset or a hidden risk that comps aren't pricing in. Stress-test before assuming the spread holds.
Location & tenants
- Location reads 76/100 on livability (#141 in MI, #3,492 nationally) — a middle-class / working-renter tenant base. Strengths: commute A+, cost of living A+, housing A+; Watch: crime F, employment D-.
- Kalamazoo Public Schools (urban): math 43% / reading 72% proficiency, ranked #71 of 540 in MI (top 13%) — acceptable for families but not a draw, mixed tenant base, ~2y average lease; 66% free/reduced lunch — lower-income household profile, screen leases tightly.
- Market conditions: Rents soft (-0.8%/yr); 77 active listings in the ZIP; 9 comparable units currently listed for rent nearby; rentals at typical pace (median 14d on market — plan ~3-4 weeks tenant-placement turnaround); lower-income renter base — watch delinquency; 339 units permitted in Kalamazoo County in 2024 (22 in 5+ unit buildings).
- At $1,741/mo this rent would consume 53% of the median local household income ($39k/yr) (locally 816% of renters already pay >50% of income on rent) — very limited rent-growth headroom before tenants either downsize or default.
Forward outlook
- Local home prices are declining (-3.0%/yr); year-one equity from $622 of loan paydown is wiped out by about $3k of value loss. Plan a longer hold.
- Kalamazoo County population projected at +18% by 2050 — long-run rental-demand tailwind backs the buy-and-hold thesis.
- At projected returns (-3.0% appreciation + 0.0% rent growth), your $25k cash investment doubles in ~4 years — after that, you're playing with house money.
Negotiation context
- It's been on market 119 days — a 9% lower offer ($82k) is reasonable based on typical stale-listing flexibility.
- 7 sale attempts since 31y ago with the ask held roughly flat each time — persistent listings suggest the price (not the market) is what's stuck; bring a comps-based counter.
- Current owner paid $24k; list at $90k implies a 278% gain — meaningful room to come down on a strong offer.
Risks & watch-outs
- Watch-outs: built in 1910 — expect roof / HVAC / electrical / plumbing capex.
Questions for the listing agent
- It's been on market 119 days. Have you received any prior offers? Is the seller open to a 9% concession, seller financing, or rate buy-down credit?
- Built in 1910 — when were the roof, HVAC, electrical panel, plumbing, and water heater last replaced?
- Why hasn't it sold? Are there any deal-killer items the seller is aware of (foundation, flood, title, zoning, code violations)?
- Is there a deadline driving the sale (1031 exchange, divorce, estate, relocation)? That informs how much negotiation room exists.
- Crime grade is F in this area — have there been break-ins, vandalism, or insurance claims at this property in the last 3 years? What carrier currently insures it and at what premium?
- What's the average days-on-market for RENTAL listings here right now (not sales)? A rising rental-DOM trend means longer vacancies and softer asking-rent achievability than the comps imply.
- What's the recent tenant-quality profile in this submarket — average credit score on applications, eviction rate, late-payment / NSF rate, and stable-employment percentage? A property-management company in the area should have these aggregated.
- How much new for-sale + rental construction is in the pipeline within 1–3 miles? Heavy new supply typically softens prices + rents 12–24 months out; constrained supply supports both.
Investment metrics
- 1% rule
- 1.94% ✓
- Cap rate
- 16.68%
- Cash-on-cash
- 37.08%
- DSCR
- 2.65
- GRM
- 4.3
CMA / ARV
- ARV (on-the-fly)
- $184,688
- Comps found
- 12
Show comp detail 12 sales within ~0.75 mi
| Address | Dist | Beds/Ba | Sqft | Sold | Price | $/sf | Match |
|---|---|---|---|---|---|---|---|
| 519 Walnut Ct | 0.16mi | 3/1.0 (+1) | 1,344 (-13%) | 1mo | $162,600 | $121 | 60 |
| 704 W Lovell | 0.26mi | 3/1.5 (+1) | 1,632 (+5%) | 16mo | $195,000 | $119 | 59 |
| 819 Oakland Dr | 0.56mi | 3/2.0 (+1) | 1,510 (-3%) | 7mo | $125,000 | $83 | 58 |
| 314 Douglas Ave | 0.73mi | 3/2.0 (+1) | 1,543 (-1%) | 15mo | $195,000 | $126 | 48 |
| 938 Bellevue Pl | 0.44mi | 3/1.0 (+1) | 1,402 (-10%) | 13mo | $107,500 | $77 | 43 |
| 1411 Oak St | 0.65mi | 3/2.0 (+1) | 1,389 (-10%) | 6mo | $79,900 | $58 | 43 |
| 806 Elmwood St | 0.73mi | 3/1.5 (+1) | 1,480 (-5%) | 11mo | $205,000 | $139 | 42 |
| 815 Elmwood St | 0.71mi | 3/1.5 (+1) | 1,475 (-5%) | 12mo | $175,000 | $119 | 42 |
| 608 W Ransom St | 0.73mi | 3/1.0 (+1) | 1,464 (-6%) | 8mo | $111,900 | $76 | 40 |
| 623 Mccourtie St | 0.63mi | 3/1.5 (+1) | 1,439 (-7%) | 13mo | $110,500 | $77 | 40 |
| 514 Forest St | 0.53mi | 3/1.5 (+1) | 1,323 (-15%) | 6mo | $130,000 | $98 | 38 |
| 812 Wheaton Ave | 0.51mi | 3/1.0 (+1) | 1,334 (-14%) | 9mo | $167,500 | $126 | 36 |
Match score weights: distance 35% · size 25% · config 20% · recency 20%. Top-matched comps best support the ARV.
Projected returns pro-forma
-3.0% appreciation · 0.0% rent growth · sell at horizon
- IRR
- 29.6%
- Equity multiple
- 2.19×
- Total profit
- $29,887
- Equity at exit
- $13,404
- IRR
- 35.2%
- Equity multiple
- 3.79×
- Total profit
- $70,153
- Equity at exit
- $7,773
Cash invested: $25,172 (down + closing). Projections, not guarantees.
Landlord ↔ Tenant lean methodology
- Overall (STATE)
- 62 Landlord-Friendly
- State Michigan
- 62 Landlord-Friendly · EVEN
- County
- — inherits STATE
- City
- — inherits STATE
ZIP-level market 49007
- Rents YoY
- -0.8%
- Active inventory
- 77
- Price-to-rent
- 4.3×
Monthly cashflow live
- Estimated rent
- $1,741 high interval (Pro) →
- Mortgage (P&I)
- −$471
- Tax from tax record
- −$88 /mo · $1,061/yr
- Insurance
- −$37
- HOA
- −$0
- Vacancy / Maint / Mgmt
- −$366
- Net cashflow
- $778
Break-even live
Sensitivity live
| Price | -10% $829 | -5% $803 | +0% $778 | +5% $752 | +10% $727 |
|---|---|---|---|---|---|
| Rent | -10% $640 | -5% $709 | +0% $778 | +5% $847 | +10% $915 |
| Rate | -1.0pp $823 | -0.5pp $801 | base $778 | +0.5pp $755 | +1.0pp $731 |
UW: 25.0% down · 7.5% · 30yr · 1.5% tax · 5.0% vac · 8.0% maint · 8.0% mgmt
Financing live
Cash to close
- Down payment
- $22,475
- Closing costs
- $2,697
- Reserves months
- —
- Total cash needed
- —
Loan-product check · same deal, 3 products live
Conventional
25% down · 7.5% · 30yr
- Down + closing
- —
- Monthly P&I
- —
- Monthly cashflow
- —
- DSCR
- —
- Eligible?
- —
Personal DTI + credit; lowest rate.
DSCR
20% down · 8.5% · 30yr
- Down + closing
- —
- Monthly P&I
- —
- Monthly cashflow
- —
- DSCR
- —
- Eligible?
- —
No personal income docs; deal must DSCR.
Hard money
10% down · 12.0% · 12mo
- Down + closing
- —
- Monthly P&I
- —
- Monthly cashflow
- —
- DSCR
- —
- Eligible?
- —
Short-term bridge; refi at stabilization.
Rent comps 9 comps
| Address | Beds | Baths | Sqft | Rent | $/sqft | DOM | Units | Dist |
|---|---|---|---|---|---|---|---|---|
| 807 Central Park Cir Kalamazoo, MI | 1.0–3.0 | 1.0–2.0 | 1089 | $1,908 | $1.75 | 14d | 12 | 0.22mi |
| 525 S Burdick St Kalamazoo, MI | 2.0 | 2.0 | 1555 | $2,928 | $1.88 | 14d | 2 | 0.33mi |
| 211 Rose Pl Kalamazoo, MI | 2.0 | 2.0 | 1695 | $1,200 | $0.71 | 21d | 1 | 0.35mi |
| 125 S Kalamazoo Mall Kalamazoo, MI | 2.0 | 2.0 | 1833 | $3,088 | $1.68 | 14d | 1 | 0.42mi |
| 232 Woodward Ave Unit 5 Kalamazoo, MI | 2.0 | 1.0 | 1400 | $999 | $0.71 | 14d | 1 | 0.55mi |
| 722 W Kalamazoo Ave Unit 2 Kalamazoo, MI | 3.0 | 1.0 | 1800 | $1,600 | $0.89 | 21d | 1 | 0.57mi |
| 310 E Michigan Ave Kalamazoo, MI | 2.0 | 2.0 | 1100 | $1,385 | $1.26 | 21d | 1 | 0.59mi |
| 525 E Ransom St Kalamazoo, MI | 1.0–2.0 | 1.0–2.0 | 807 | $1,625 | $2.01 | 21d | 1 | 0.95mi |
| 708 Elizabeth St Kalamazoo, MI | 3.0 | 1.5 | 1128 | $1,250 | $1.11 | 14d | 1 | 1.05mi |
Listing history 27 events
-
2026-06-18days on market $89,900 Active 119 DOM
-
2026-06-17days on market $89,900 Active 118 DOM
-
2026-06-16days on market $89,900 Active 117 DOM
-
2026-06-15days on market $89,900 Active 116 DOM
-
2026-06-14days on market $89,900 Active 114 DOM
-
2026-06-13days on market $89,900 Active 113 DOM
-
2026-06-10days on market $89,900 Active 111 DOM
-
2026-06-09days on market $89,900 Active 110 DOM
-
2026-06-08days on market $89,900 Active 109 DOM
-
2026-06-07days on market $89,900 Active 108 DOM
-
2026-06-05days on market $89,900 Active 105 DOM
-
2026-06-03days on market $89,900 Active 104 DOM
-
2026-06-02days on market $89,900 Active 103 DOM
-
2026-06-01days on market $89,900 Active 102 DOM
-
2026-05-31days on market $89,900 Active 101 DOM
-
2026-05-30days on market $89,900 Active 100 DOM
-
2026-02-19$89,900 Active 259-char remark
Show marketing remark (259 chars)
Downtown opportunity for customization for your personal house, flip, or an income property. The property is NOT in the historic district! Two story shell is ideal as a 3-4 bedroom home or a duplex. The house needs to be renovated. CASH ''AS IS'' OFFERS ONLY.
-
2026-02-19$89,900 Active
Show marketing remark (259 chars)
Downtown opportunity for customization for your personal house, flip, or an income property. The property is NOT in the historic district! Two story shell is ideal as a 3-4 bedroom home or a duplex. The house needs to be renovated. CASH ''AS IS'' OFFERS ONLY.
-
2026-02-19$89,900 Active 259-char remark
Show marketing remark (259 chars)
Downtown opportunity for customization for your personal house, flip, or an income property. The property is NOT in the historic district! Two story shell is ideal as a 3-4 bedroom home or a duplex. The house needs to be renovated. CASH ''AS IS'' OFFERS ONLY.
-
2007-01-12soldstatus $23,780
-
2007-01-12soldstatus $23,780
-
2006-12-12$25,000
-
2006-12-12$25,000
-
1995-06-10soldstatus $25,000
-
1995-06-10soldstatus $25,000
-
1995-02-28$28,900
-
1995-02-28$28,900
ⓘ Source: listings_history table (triggers on properties + properties_extension) + one-shot
backfill from property_details.listing_events for pre-trigger history.
Tax reassessment forecast MI · Partial reset (capped growth)
- Current annual tax
- $1,061 · $88/mo
- Projected year-2 tax
- $1,223 · $102/mo
- Expected delta
- +$162/yr (+$13/mo · 15.2%)
ⓘ Screening estimate from a state-policy table — verify with the county assessor before closing.
Climate risk First Street
- Flood 1/10 Low FEMA zone X (unshaded) · 0% chance over 30 yrs
- Wildfire 1/10 Low
- Heat 3/10 Moderate 7 d/yr ≥100°F today · 16 d/yr by 30 yrs out
- Wind 2/10 Low
- Air quality 2/10 Low 1 unhealthy d/yr today · 2 by 30 yrs out
Nearby sold comps map
Loading sold comps map…
Walkable amenities ~0.75 mi
Loading nearby amenities…
Taxation est. · year 1
- Rental income
- $20,890
- − Mortgage interest
- −$5,036
- − Property taxes
- −$1,061
- − Insurance
- −$450
- − Repairs & maintenance
- −$1,671
- − Management
- −$1,671
- − Depreciation
- −$2,615
- Taxable income
- $8,386
- Est. tax owed @ 24.0%
- −$2,013
- After-tax cash flow
- $7,322/yr
For passive investors: Depreciation is non-cash, so a rental often shows a tax loss while cash-flowing — sheltering income. Rental losses are passive: they offset passive income freely, and up to $25,000/yr can offset ordinary (W-2) income if you actively participate and your MAGI is under $100k (phasing out to $0 by $150k); unused losses carry forward. On sale, claimed depreciation is recaptured at up to 25%, and gains may owe capital-gains tax (a 1031 exchange can defer both). Figures are a year-1 estimate at your 24.0% rate — not tax advice; consult a CPA.
Schools (NCES district)
- District
- Kalamazoo Public Schools
- NCES district ID
- 2619950
- Math proficiency
- 43% ▲ 13.00%
- Reading proficiency
- 72% ▲ 33.00%
- Median HH income
- $35,291
- Composite
- 47.48/100
- National rank
- #2275
- State rank
- #71 of 540 in MI
Livability — Kalamazoo
- Score
- 76/100
- State rank
- #141
- US rank
- #3492
Category grades
Schools grade is shown separately in the Schools card above.
Census & demographics
- Census place
- Kalamazoo, MI
- County
- Kalamazoo County · 224,317 people
- City population
- 121,397
- Metro
- Kalamazoo-Portage, MI
- Population (ZIP)
- 9,836
- Household income
- $39,344
- Rent vs Own
- Severe rent burden
- 816.0
Population outlook (Kalamazoo County) Hauer SSP2
- Today (2025)
- 280,982 people
- By 2030
- 292,068 · +3.9%
- By 2040
- 312,191 · +11.1%
- By 2050
- 331,196 · +17.9%
- By 2075
- 379,021 · +34.9%
- By 2100
- 396,579 · +41.1%
Race, ethnicity, and origin ACS 2023
- Neighborhood character
- Diverse neighborhood (Simpson 0.61)
- Race & ethnicity
- White 44% Black 44% Two or more races 7% Hispanic / Latino 3%
- Common ancestry
- Iranian 3% Romanian 2% Lithuanian 1%
- Foreign-born
- 3% · Canada
- Languages at home
- 94% English-only · Spanish 4% French/Haitian/Cajun 1% Arabic 1%
Political lean MEDSL · Kalamazoo
- 2024 margin
- D (+17.7) · D 58.0% · R 40.3% · Other 1.7%
- 2008→2024 swing
- -1.8pp toward R · 2008: 19.5pp · 2024: 17.7pp
- All cycles
- 2024: D+17.7 2020: D+18.7 2016: D+12.8 2012: D+13.3 2008: D+19.5
Not yet ingested
- Civics
- —
Market trends
- HPI YoY
- ▼ -68.80%
- Current HPI
- 112.4973
- Rent YoY
- ▼ -0.85%
- Metro
- Kalamazoo-Portage, MI
- State GDP YoY
- ▲ 1.37%
- F500 in state
- 28
Industry mix (Fortune 500 HQ in MI)
| Industry | F500 HQs | Revenue |
|---|---|---|
| Automotive Parts | 3 | $48B |
|
||
| Automotive | 2 | $372B |
|
||
| Chemicals | 1 | $45B |
|
||
| Automotive Retail | 1 | $29B |
|
||
| Healthcare / Medical Devices | 1 | $23B |
|
||
| Automotive Technology | 1 | $20B |
|
||
Price history
+211.1% since first listed11 events — show timeline
- 2026-02-19 Listed $89,900 REALCOMP
- 2026-02-19 Listed $89,900 SW Michigan MLS
- 2026-02-19 Listed $89,900 MiRealSource-MiMLS
- 2007-01-12 Sold (MLS) $23,780 REALCOMP
- 2007-01-12 Sold (MLS) $23,780 SW Michigan MLS
- 2006-12-12 Listed $25,000 REALCOMP
- 2006-12-12 Listed $25,000 SW Michigan MLS
- 1995-06-10 Sold (MLS) $25,000 REALCOMP
- 1995-06-10 Sold (MLS) $25,000 SW Michigan MLS
- 1995-02-28 Listed $28,900 REALCOMP
- 1995-02-28 Listed $28,900 SW Michigan MLS
Property tax history
-6.5%/yrLatest (2025): $1,061 · +3.0% YoY. Source: county tax records.
Cash-flow waterfall
monthlySold comps — $/sqft
last 12 mo · ≤1 miLoading sold comps…