1084 Crenshaw Ave · Cottonwood, AZ
Flood risk 1/10 · Minimal
- FEMA flood zone
- X (unshaded)
- Chance of flooding over 30 yrs
- 0.0%
- Est. flood insurance / yr
- $507 – $1,088
Fire risk 5/10 · Moderate
- Est. fire insurance / yr
- $610 – $1,132
Heat risk 6/10 · Moderate
- Hot days now (above 103°F)
- 8 days/yr
- Hot days in 30 yrs
- 20 days/yr
Wind risk 1/10 · Minimal
- Chance of severe wind over 30 yrs
- —
Air-quality risk 1/10 · Minimal
- Unhealthy air days now
- 0 days/yr
- Unhealthy air days in 30 yrs
- 0 days/yr
Risk factors via First Street. Map © Google.
Why this score? — see what drove the D+ grade
The composite is a weighted blend of 9 inputs, each scored 0–100. Each bar is that input's sub-score; the figure is the points it added to the 100-point composite (weight × sub-score).
- Cash flow +18.1/30.0
- ARV discount +7.5/15.0
- DSCR +5.7/10.0
- 1% rule +4.9/10.0
- Livability +4.0/5.0
- Condition / age +2.5/5.0
- Rent growth +2.4/5.0
- Schools +1.9/10.0
- Appreciation +0.0/10.0
$234,900
🖨 Deal sheet 📄 Offer letter ✓ Due diligence
Listing remarks
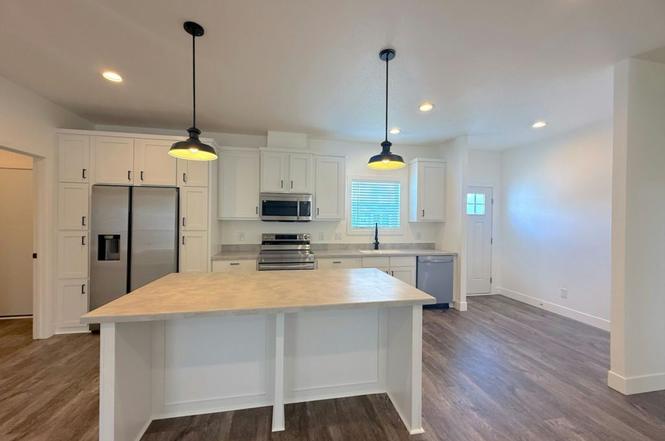
This is a fantastic opportunity to own a beautiful home in a golf course community. This showstopper is perfectly situated in On The Greens, a highly welcoming, Active Adult Community. Come see an inviting open concept floor plan, 3 bedrooms, 2 baths, and 1400 sq. ft of living space. You will quickly settle into your new neighborhood and lifestyle. This fantastic opportunity won't last long… Come visit On The Greens today, or give us a call to set up an appointment with one of our friendly sales associates.
Key facts
- Built 2025
- Listed 196 days
Tags
Property features AI
Finance
- Financial info: List price $234,900
Exterior
- Home design: Spec new construction; Address: 1084 Crenshaw Ave, Cottonwood AZ 86326
Interior
- Bedrooms: 3 bedrooms
- Bathrooms: 2 full bathrooms
- Interior features: Living area of 1,400
Neighborhood map
What this means for you Summary
Snapshot
- This is a 3-bed/2.0-bath manufactured listed at $235k.
Deal economics
- At list price, monthly cash flow is $207 ($2k/yr) — positive.
- The deal already cash-flows at list — no discount required.
- To meet the 1% rule (rent ≥ 1% of price), the offer needs to be $232k (1.4% below list).
- Recommended offer: $207k (12.0% below list) — sets the bar for market timing.
- Cap rate 7.3% vs local median 3.8% in Cottonwood — top-decile yield for the area; either an underpriced asset or a hidden risk that comps aren't pricing in. Stress-test before assuming the spread holds.
Location & tenants
- Location reads 79/100 on livability (#7 in AZ, #2,176 nationally) — a middle-class / working-renter tenant base. Strengths: health & safety A+, commute A, cost of living A; Watch: employment D, amenities F.
- Cottonwood-Oak Creek Elementary District (4487) (town): math 17% / reading 28% proficiency, ranked #174 of 249 in AZ (top 70%) — low school quality limits family demand, transient renter base, plan for 1-2y turnover.
- Market conditions: Rents soft (-0.2%/yr); 266 active listings in the ZIP; 4 comparable units currently listed for rent nearby; rentals leasing fast (median 13d on market — plan ~1-2 weeks tenant-placement turnaround); 2,062 units permitted in Yavapai County in 2024 (98 in 5+ unit buildings).
- At $2,317/mo this rent would consume 48% of the median local household income ($57k/yr) (locally 894% of renters already pay >50% of income on rent) — very limited rent-growth headroom before tenants either downsize or default.
Forward outlook
- Local home prices are declining (-3.0%/yr); year-one equity from $2k of loan paydown is wiped out by about $7k of value loss. Plan a longer hold.
- Yavapai County population projected at +10% by 2050 — modest demand growth; plan on rents tracking national, not racing it.
Negotiation context
- It's been on market 196 days — a 12% lower offer ($207k) is reasonable based on typical stale-listing flexibility.
Risks & watch-outs
- Climate carrying-cost: moderate wildfire risk; extreme-heat days projected 8→20/yr by 2055 (HVAC capex compounding) — expect insurance premiums to compound above CPI over the hold.
Questions for the listing agent
- It's been on market 196 days. Have you received any prior offers? Is the seller open to a 12% concession, seller financing, or rate buy-down credit?
- Why hasn't it sold? Are there any deal-killer items the seller is aware of (foundation, flood, title, zoning, code violations)?
- Is there a deadline driving the sale (1031 exchange, divorce, estate, relocation)? That informs how much negotiation room exists.
- The area grade is low — what's the realistic commute time and amenity access for the typical tenant pool here? Any planned neighborhood developments (good or bad) we should know about?
- What's the average days-on-market for RENTAL listings here right now (not sales)? A rising rental-DOM trend means longer vacancies and softer asking-rent achievability than the comps imply.
- What's the recent tenant-quality profile in this submarket — average credit score on applications, eviction rate, late-payment / NSF rate, and stable-employment percentage? A property-management company in the area should have these aggregated.
- How much new for-sale + rental construction is in the pipeline within 1–3 miles? Heavy new supply typically softens prices + rents 12–24 months out; constrained supply supports both.
Investment metrics
- 1% rule
- 0.99% ✗
- Cap rate
- 7.35%
- Cash-on-cash
- 3.77%
- DSCR
- 1.17
- GRM
- 8.4
CMA / ARV
- ARV (on-the-fly)
- $151,200
- Comps found
- 12
Show comp detail 12 sales within ~0.75 mi
| Address | Dist | Beds/Ba | Sqft | Sold | Price | $/sf | Match |
|---|---|---|---|---|---|---|---|
| 1065 Crenshaw Ave | 0.05mi | 3/2.0 | 1,440 (+3%) | 2mo | $180,000 | $125 | 92 |
| 972 Trevino Dr | 0.32mi | 3/2.0 | 1,382 (-1%) | 2mo | $179,900 | $130 | 81 |
| 992 Trevino Dr | 0.32mi | 3/2.0 | 1,431 (+2%) | 3mo | $195,000 | $136 | 79 |
| 2050 W St Route 89a -- #273 | 0.45mi | 3/2.0 | 1,440 (+3%) | 7mo | $150,000 | $104 | 69 |
| 2050 W State Route 89a -- #158 | 0.45mi | 3/2.0 | 1,334 (-5%) | 5mo | $130,000 | $97 | 67 |
| 2050 W SR 89a -- #104 | 0.45mi | 2/2.0 (-1) | 1,456 (+4%) | 1mo | $118,000 | $81 | 66 |
| 2050 W State Route 89a -- #86 | 0.62mi | 3/2.0 | 1,344 (-4%) | 2mo | $35,000 | $26 | 62 |
| 2050 W State Route 89-a -- #92 | 0.62mi | 3/2.0 | 1,344 (-4%) | 4mo | $145,000 | $108 | 61 |
| 1024 Rankin Ave | 0.29mi | 3/2.0 | 1,605 (+15%) | 2mo | $199,900 | $125 | 61 |
| 1216 Hogan Dr | 0.26mi | 2/2.0 (-1) | 1,600 (+14%) | 1mo | $248,000 | $155 | 59 |
| 2050 W State Route 89a -- #181 | 0.46mi | 2/2.0 (-1) | 1,216 (-13%) | 0mo | $120,000 | $99 | 51 |
| 2050 W SR 89-a -- #96 | 0.62mi | 3/2.0 | 1,568 (+12%) | 1mo | $155,000 | $99 | 50 |
Match score weights: distance 35% · size 25% · config 20% · recency 20%. Top-matched comps best support the ARV.
Projected returns pro-forma
-3.0% appreciation · 0.0% rent growth · sell at horizon
- IRR
- -13.8%
- Equity multiple
- 0.52×
- Total profit
- $-31,641
- Equity at exit
- $35,024
- IRR
- -10.7%
- Equity multiple
- 0.44×
- Total profit
- $-36,681
- Equity at exit
- $20,310
Cash invested: $65,772 (down + closing). Projections, not guarantees.
Landlord ↔ Tenant lean methodology
- Overall (STATE)
- 87 Strongly Landlord-Friendly
- State Arizona
- 87 Strongly Landlord-Friendly · R+3
- County
- — inherits STATE
- City
- — inherits STATE
ZIP-level market 86326
- Home prices YoY
- -32.2%
- Rents YoY
- -0.2%
- Active inventory
- 266
- Price-to-rent
- 8.4×
Monthly cashflow live
- Estimated rent
- $2,317 medium interval (Pro) →
- Mortgage (P&I)
- −$1,232
- Tax est. 1.5%
- −$294 /mo · $3,524/yr
- Insurance
- −$98
- HOA
- −$0
- Vacancy / Maint / Mgmt
- −$487
- Net cashflow
- $207
Break-even live
UW: 25.0% down · 7.5% · 30yr · 1.5% tax · 5.0% vac · 8.0% maint · 8.0% mgmt
Financing live
Cash to close
- Down payment
- $58,725
- Closing costs
- $7,047
- Reserves months
- —
- Total cash needed
- —
Loan-product check · same deal, 3 products live
Conventional
25% down · 7.5% · 30yr
- Down + closing
- —
- Monthly P&I
- —
- Monthly cashflow
- —
- DSCR
- —
- Eligible?
- —
Personal DTI + credit; lowest rate.
DSCR
20% down · 8.5% · 30yr
- Down + closing
- —
- Monthly P&I
- —
- Monthly cashflow
- —
- DSCR
- —
- Eligible?
- —
No personal income docs; deal must DSCR.
Hard money
10% down · 12.0% · 12mo
- Down + closing
- —
- Monthly P&I
- —
- Monthly cashflow
- —
- DSCR
- —
- Eligible?
- —
Short-term bridge; refi at stabilization.
Rent comps 4 comps
| Address | Beds | Baths | Sqft | Rent | $/sqft | DOM | Units | Dist |
|---|---|---|---|---|---|---|---|---|
| 992 Sterling Ln Cottonwood, AZ | 3.0 | 2.0 | 1652 | $2,395 | $1.45 | 20d | 1 | 0.48mi |
| 255 S Cottonwood Ranch Rd Cottonwood, AZ | 3.0 | 2.0 | 1695 | $2,195 | $1.29 | 13d | 1 | 1.25mi |
| 1910 W Trail Blazer Dr Cottonwood, AZ | 2.0 | 2.0 | 1278 | $2,900 | $2.27 | 13d | 1 | 1.26mi |
| 133 S 8th Pl Cottonwood, AZ | 2.0 | 2.0 | 1017 | $1,700 | $1.67 | 13d | 1 | 1.42mi |
Listing history 16 events
-
2026-06-18days on market $234,900 Active 196 DOM
-
2026-06-17days on market $234,900 Active 195 DOM
-
2026-06-16days on market $234,900 Active 194 DOM
-
2026-06-15days on market $234,900 Active 193 DOM
-
2026-06-14days on market $234,900 Active 191 DOM
-
2026-06-13days on market $234,900 Active 190 DOM
-
2026-06-10days on market $234,900 Active 188 DOM
-
2026-06-09days on market $234,900 Active 187 DOM
-
2026-06-08days on market $234,900 Active 186 DOM
-
2026-06-07days on market $234,900 Active 185 DOM
-
2026-06-05days on market $234,900 Active 182 DOM
-
2026-06-03days on market $234,900 Active 181 DOM
-
2026-06-02days on market $234,900 Active 180 DOM
-
2026-06-01days on market $234,900 Active 179 DOM
-
2026-05-31days on market $234,900 Active 178 DOM
-
2026-05-30days on market $234,900 Active 177 DOM
ⓘ Source: listings_history table (triggers on properties + properties_extension) + one-shot
backfill from property_details.listing_events for pre-trigger history.
Climate risk First Street
- Flood 1/10 Low FEMA zone X (unshaded) · 0% chance over 30 yrs
- Wildfire 5/10 Major
- Heat 6/10 Major 8 d/yr ≥103°F today · 20 d/yr by 30 yrs out
- Wind 1/10 Low
- Air quality 1/10 Low 0 unhealthy d/yr today · 0 by 30 yrs out
Nearby sold comps map
Loading sold comps map…
Walkable amenities ~0.75 mi
Loading nearby amenities…
Taxation est. · year 1
- Rental income
- $27,801
- − Mortgage interest
- −$13,158
- − Property taxes
- −$3,524
- − Insurance
- −$1,174
- − Repairs & maintenance
- −$2,224
- − Management
- −$2,224
- − Depreciation
- −$6,833
- Taxable loss
- −$1,337
- Est. tax savings @ 24.0%
- +$321
- After-tax cash flow
- $2,804/yr
For passive investors: Depreciation is non-cash, so a rental often shows a tax loss while cash-flowing — sheltering income. Rental losses are passive: they offset passive income freely, and up to $25,000/yr can offset ordinary (W-2) income if you actively participate and your MAGI is under $100k (phasing out to $0 by $150k); unused losses carry forward. On sale, claimed depreciation is recaptured at up to 25%, and gains may owe capital-gains tax (a 1031 exchange can defer both). Figures are a year-1 estimate at your 24.0% rate — not tax advice; consult a CPA.
Schools (NCES district)
- District
- Cottonwood-Oak Creek Elementary District (4487)
- NCES district ID
- 0402370
- Math proficiency
- 17% ▼ -10.00%
- Reading proficiency
- 28% ▼ -7.00%
- Median HH income
- $41,740
- Composite
- 19.16/100
- National rank
- #8822
- State rank
- #174 of 249 in AZ
Livability — Cottonwood
- Score
- 79/100
- State rank
- #7
- US rank
- #2176
Category grades
Schools grade is shown separately in the Schools card above.
Census & demographics
- Census place
- Cottonwood, AZ
- County
- Yavapai County · 190,406 people
- City population
- 24,852
- Metro
- Prescott Valley-Prescott, AZ
- Population (ZIP)
- 24,852
- Household income
- $57,378
- Rent vs Own
- Severe rent burden
- 894.0
Population outlook (Yavapai County) Hauer SSP2
- Today (2025)
- 241,389 people
- By 2030
- 249,523 · +3.4%
- By 2040
- 259,966 · +7.7%
- By 2050
- 264,736 · +9.7%
- By 2075
- 269,334 · +11.6%
- By 2100
- 256,505 · +6.3%
Race, ethnicity, and origin ACS 2023
- Neighborhood character
- Predominantly White (73%)
- Race & ethnicity
- White 73% Hispanic / Latino 20% Two or more races 14% Native American 1%
- Hispanic origin (detail)
- Mexican 17%
- Common ancestry
- Italian 3% Romanian 3% Lithuanian 2%
- Foreign-born
- 12% · Canada
- Languages at home
- 84% English-only · Spanish 14% German/W. Germanic 1%
Political lean MEDSL · Yavapai
- 2024 margin
- Solid R (+33.9) · D 32.6% · R 66.5%
- 2008→2024 swing
- -9.5pp toward R · 2008: -24.4pp · 2024: -33.9pp
- All cycles
- 2024: R+33.9 2020: R+29.3 2016: R+31.4 2012: R+30.7 2008: R+24.4
Not yet ingested
- Civics
- —
Market trends
- HPI YoY
- ▼ -165.27%
- Current HPI
- 347.5058
- Rent YoY
- ▼ -0.22%
- Metro
- Prescott Valley-Prescott, AZ
- State GDP YoY
- ▲ 4.54%
- F500 in state
- 20
Industry mix (Fortune 500 HQ in AZ)
| Industry | F500 HQs | Revenue |
|---|---|---|
| Technology | 2 | $13B |
|
||
| Mining / Metals | 1 | $23B |
|
||
| Environmental Services | 1 | $16B |
|
||
| Metals / Steel | 1 | $14B |
|
||
| Technology Distribution | 1 | $9B |
|
||
| Homebuilding | 1 | $8B |
|
||
Cash-flow waterfall
monthlySold comps — $/sqft
last 12 mo · ≤1 miLoading sold comps…