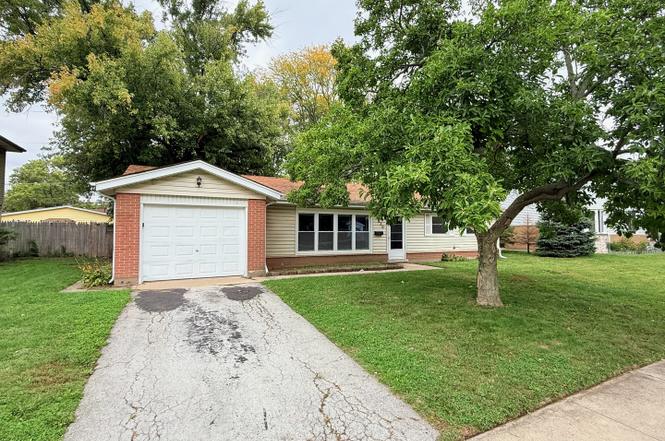
930 Coach Rd · Homewood, IL
Flood risk 1/10 · Minimal
- FEMA flood zone
- X (unshaded)
- Chance of flooding over 30 yrs
- 0.0%
- Est. flood insurance / yr
- $473 – $860
Fire risk 1/10 · Minimal
- Est. fire insurance / yr
- $804 – $1,492
Heat risk 3/10 · Minor
- Hot days now (above 101°F)
- 7 days/yr
- Hot days in 30 yrs
- 15 days/yr
Wind risk 2/10 · Minimal
- Chance of severe wind over 30 yrs
- —
Air-quality risk 2/10 · Minimal
- Unhealthy air days now
- 2 days/yr
- Unhealthy air days in 30 yrs
- 2 days/yr
Risk factors via First Street. Map © Google.
Why this score? — see what drove the B- grade
The composite is a weighted blend of 9 inputs, each scored 0–100. Each bar is that input's sub-score; the figure is the points it added to the 100-point composite (weight × sub-score).
- Cash flow +24.2/30.0
- ARV discount +15.0/15.0
- 1% rule +8.7/10.0
- DSCR +7.8/10.0
- Livability +4.0/5.0
- Rent growth +2.5/5.0
- Condition / age +2.5/5.0
- Schools +2.4/10.0
- Appreciation +0.0/10.0
$218,000
🖨 Deal sheet (PDF) 📄 Offer letter ✓ Due diligence
Listing remarks
BRAND NEW APPLIANCES! This is a fantastic opportunity to get into a sought-after Homewood neighborhood at a great value. You'll be part of an amazing community, and just a short drive from the Metra station and I-294. This location combines the convenience of easy commuting with the quiet of a friendly, established street. The layout features a surprisingly large living room and an extra-spacious 22-foot-long kitchen. The main bedroom includes a private half-bath, a rare find. With a one-car attached garage for storage and sliding doors that open to the patio, this home is the perfect chance to build equity and design your space exactly the way you want it. We loved the interior and are sur
Key facts
- Private half-bath
- 8,165 sq ft lot
- Garage
Tags
Property features AI
Finance
- Other: Built before 1978
- HOA & community: No master association fees required
Exterior
- Parking: Attached garage (owned) — 1 garage space, 1 total parking space
- Utilities: Public water; Public sewer
- Home design: Detached single-family home; One-story
- Construction: Built 61–70 years ago; Vinyl siding and brick exterior
- Exterior features: Lot dimensions approximately 71 x 115; Lot size less than 0.25 acre
Interior
- Kitchen: Kitchen (main level, 22 x 11)
- Bedrooms: 3 bedrooms total; Master bedroom (main level, 13 x 11) with half bath; Bedroom (main level, 13 x 10); Bedroom (main level, 9 x 9)
- Bathrooms: 1 full bathroom; 1 half bathroom
- Heating & cooling: Natural gas forced air heating; Central air conditioning
- Interior features: 6 total rooms; Separate dining room; Family room; Living room (main level, 17 x 16)
- Laundry & utility: Laundry room
Neighborhood map
What this means for you Summary
Snapshot
- This is a 3-bed/1.5-bath single-family listed at $218k.
Deal economics
- At list price, monthly cash flow is $434 ($5k/yr) — positive.
- The deal already cash-flows at list — no discount required.
- Meets the 1% rule at list price ($3k rent vs $218k).
- Recommended offer: $192k (12.0% below list) — sets the bar for market timing.
- Cap rate 8.7% vs local median 6.1% in Homewood — top-decile yield for the area; either an underpriced asset or a hidden risk that comps aren't pricing in. Stress-test before assuming the spread holds.
Location & tenants
- Location reads 81/100 on livability (#81 in IL, #1,314 nationally) — a professional / high-income tenant draw. Strengths: commute A+, employment A+, cost of living A+; Watch: amenities F.
- Homewood Flossmoor Chsd 233 (suburban): math 21% / reading 27% proficiency, ranked #272 of 620 in IL (top 44%) — low school quality limits family demand, transient renter base, plan for 1-2y turnover.
- Zoned schools: Willow School (607 students, 0% FRL); James Hart School (math 22% / reading 37%, grade F, #256 of 665 statewide, top 41%, 711 students, 0% FRL); Homewood-Flossmoor High School (math 21% / reading 27%, grade F, #304 of 693 statewide, top 44%, 2,798 students, 0% FRL).
- Market conditions: 102 active listings in the ZIP; 6 comparable units currently listed for rent nearby; rentals at typical pace (median 24d on market — plan ~3-4 weeks tenant-placement turnaround); 6,272 units permitted in Cook County in 2024 (4,658 in 5+ unit buildings).
Forward outlook
- Local home prices are declining (-3.0%/yr); year-one equity from $2k of loan paydown is wiped out by about $7k of value loss. Plan a longer hold.
Negotiation context
- It's been on market 234 days — a 12% lower offer ($192k) is reasonable based on typical stale-listing flexibility.
- Current owner paid $160k; 36% above their basis — modest negotiation headroom, anchor on the comps not their cost.
Risks & watch-outs
- Watch-outs: property tax is 3.8% of price.
Questions for the listing agent
- It's been on market 234 days. Have you received any prior offers? Is the seller open to a 12% concession, seller financing, or rate buy-down credit?
- Built in 1962 — when were the roof, HVAC, electrical panel, plumbing, and water heater last replaced?
- Property tax is high relative to price — has the assessment been appealed recently, and will the sale trigger a re-assessment?
- Why hasn't it sold? Are there any deal-killer items the seller is aware of (foundation, flood, title, zoning, code violations)?
- Is there a deadline driving the sale (1031 exchange, divorce, estate, relocation)? That informs how much negotiation room exists.
- Schools are D-rated, which usually means shorter tenancies and higher turnover. Who's the typical renter profile here, and what's been the actual vacancy rate?
- What's the average days-on-market for RENTAL listings here right now (not sales)? A rising rental-DOM trend means longer vacancies and softer asking-rent achievability than the comps imply.
- What's the recent tenant-quality profile in this submarket — average credit score on applications, eviction rate, late-payment / NSF rate, and stable-employment percentage? A property-management company in the area should have these aggregated.
- How much new for-sale + rental construction is in the pipeline within 1–3 miles? Heavy new supply typically softens prices + rents 12–24 months out; constrained supply supports both.
Investment metrics
- 1% rule
- 1.37% ✓
- Cap rate
- 8.68%
- Cash-on-cash
- 8.53%
- DSCR
- 1.38
- GRM
- 6.1
CMA / ARV
- ARV (on-the-fly)
- $267,498
- Comps found
- 12
Show comp detail 12 sales within ~0.75 mi
| Address | Dist | Beds/Ba | Sqft | Sold | Price | $/sf | Match |
|---|---|---|---|---|---|---|---|
| 914 Coach Rd | 0.03mi | 3/1.5 | 1,197 (-11%) | 0mo | $275,000 | $230 | 79 |
| 330 N Illinois Ave | 0.26mi | 3/1.5 | 1,309 (-3%) | 5mo | $235,000 | $180 | 78 |
| 1041 Coach Rd | 0.15mi | 4/2.0 (+1) | 1,407 (+4%) | 2mo | $289,000 | $205 | 77 |
| 945 W 187th St | 0.04mi | 4/1.5 (+1) | 1,197 (-11%) | 4mo | $244,000 | $204 | 71 |
| 900 W Strieff Ln | 0.40mi | 3/1.5 | 1,269 (-6%) | 3mo | $210,000 | $165 | 69 |
| 330 W Holly Ct | 0.55mi | 3/1.5 | 1,269 (-6%) | 0mo | $220,000 | $173 | 64 |
| 18430 Aberdeen St | 0.43mi | 3/2.0 | 1,223 (-10%) | 0mo | $242,000 | $198 | 62 |
| 251 N Pleasant Dr | 0.57mi | 3/1.5 | 1,500 (+11%) | 4mo | $280,000 | $187 | 52 |
| 1129 183rd St | 0.61mi | 3/2.0 | 1,216 (-10%) | 5mo | $219,150 | $180 | 49 |
| 807 W Manor Ct W | 0.67mi | 4/1.5 (+1) | 1,232 (-9%) | 1mo | $245,000 | $199 | 48 |
| 220 N Park Dr | 0.55mi | 4/1.0 (+1) | 1,486 (+10%) | 4mo | $150,500 | $101 | 47 |
| 1307 Thomas St | 0.61mi | 4/2.0 (+1) | 1,487 (+10%) | 1mo | $319,000 | $215 | 47 |
Match score weights: distance 35% · size 25% · config 20% · recency 20%. Top-matched comps best support the ARV.
Projected returns pro-forma
-3.0% appreciation · 3.0% rent growth · sell at horizon
- IRR
- -3.2%
- Equity multiple
- 0.88×
- Total profit
- $-7,384
- Equity at exit
- $32,505
- IRR
- 6.6%
- Equity multiple
- 1.50×
- Total profit
- $30,384
- Equity at exit
- $18,849
Cash invested: $61,040 (down + closing). Projections, not guarantees.
Landlord ↔ Tenant lean methodology
- Overall (STATE)
- 43 Moderately Tenant-Leaning
- State Illinois
- 43 Moderately Tenant-Leaning · D+7
- County
- — inherits STATE
- City
- — inherits STATE
ZIP-level market 60430
- Home prices YoY
- -32.1%
- Active inventory
- 102
- Price-to-rent
- 6.1×
Monthly cashflow live
- Estimated rent
- $2,983 high interval (Pro) →
- Mortgage (P&I)
- −$1,143
- Tax from tax record
- −$689 /mo · $8,265/yr
- Insurance
- −$91
- HOA
- −$0
- Vacancy / Maint / Mgmt
- −$626
- Net cashflow
- $434
Break-even live
Sensitivity live
| Price | -10% $557 | -5% $496 | +0% $434 | +5% $372 | +10% $311 |
|---|---|---|---|---|---|
| Rent | -10% $198 | -5% $316 | +0% $434 | +5% $552 | +10% $670 |
| Rate | -1.0pp $544 | -0.5pp $489 | base $434 | +0.5pp $377 | +1.0pp $320 |
UW: 25.0% down · 7.5% · 30yr · 1.5% tax · 5.0% vac · 8.0% maint · 8.0% mgmt
Financing live
Cash to close
- Down payment
- $54,500
- Closing costs
- $6,540
- Reserves months
- —
- Total cash needed
- —
Loan-product check · same deal, 3 products live
Conventional
25% down · 7.5% · 30yr
- Down + closing
- —
- Monthly P&I
- —
- Monthly cashflow
- —
- DSCR
- —
- Eligible?
- —
Personal DTI + credit; lowest rate.
DSCR
20% down · 8.5% · 30yr
- Down + closing
- —
- Monthly P&I
- —
- Monthly cashflow
- —
- DSCR
- —
- Eligible?
- —
No personal income docs; deal must DSCR.
Hard money
10% down · 12.0% · 12mo
- Down + closing
- —
- Monthly P&I
- —
- Monthly cashflow
- —
- DSCR
- —
- Eligible?
- —
Short-term bridge; refi at stabilization.
Rent comps 6 comps
| Address | Beds | Baths | Sqft | Rent | $/sqft | DOM | Units | Dist |
|---|---|---|---|---|---|---|---|---|
| 1332 Jamie Ln Homewood, IL | 4.0 | 2.5 | 1576 | $3,171 | $2.01 | 25d | 1 | 0.49mi |
| 705 W Fitzhenry Ct Glenwood, IL | 3.0 | 2.0 | 1700 | $2,950 | $1.74 | 26d | 1 | 0.86mi |
| 705 W Fitzhenry Ct Glenwood, IL | 3.0 | 2.0 | 1600 | $2,950 | $1.84 | 21d | 1 | 0.86mi |
| 18117 Loomis Ave Homewood, IL | 4.0 | 2.0 | 1500 | $2,800 | $1.87 | 5d | 1 | 0.96mi |
| 1601 183rd St Unit 1237861P Homewood, IL | 3.0 | 1.5 | 1528 | $8,665 | $5.67 | 23d | 1 | 0.99mi |
| 1802 Evergreen Rd Homewood, IL | 4.0 | 2.0 | 1716 | $2,836 | $1.65 | 0d | 1 | 1.20mi |
Listing history 25 events
-
2026-06-21days on market $218,000 Active 234 DOM
-
2026-06-18days on market $218,000 Active 231 DOM
-
2026-06-17days on market $218,000 Active 230 DOM
-
2026-06-16days on market $218,000 Active 229 DOM
-
2026-06-15days on market $218,000 Active 228 DOM
-
2026-06-13days on market $218,000 Active 226 DOM
-
2026-06-09days on market $218,000 Active 222 DOM
-
2026-06-08days on market $218,000 Active 221 DOM
-
2026-06-07days on market $218,000 Active 220 DOM
-
2026-06-04days on market $218,000 Active 217 DOM
-
2026-06-03days on market $218,000 Active 216 DOM
-
2026-06-02days on market $218,000 Active 215 DOM
-
2026-06-01days on market $218,000 Active 214 DOM
-
2026-05-31days on market $218,000 Active 213 DOM
-
2026-05-15price $218,000
-
2026-04-17price $220,000
-
2026-02-27price $222,000
-
2026-02-06price $231,000
-
2026-01-16price $236,000
-
2025-12-19price $243,000
-
2025-11-21price $251,000
-
2025-10-30$258,000 Active
-
2005-08-23soldstatus $160,000
-
1999-08-16soldstatus $97,000
-
1984-09-04soldstatus $55,000
ⓘ Source: listings_history table (triggers on properties + properties_extension) + one-shot
backfill from property_details.listing_events for pre-trigger history.
Tax reassessment forecast IL · Partial reset (capped growth)
- Current annual tax
- $8,265 · $689/mo
- Projected year-2 tax
- $8,265 · $689/mo
- Expected delta
- $0/yr ($0/mo · 0.0%)
ⓘ Screening estimate from a state-policy table — verify with the county assessor before closing.
Climate risk First Street
- Flood 1/10 Low FEMA zone X (unshaded) · 0% chance over 30 yrs
- Wildfire 1/10 Low
- Heat 3/10 Moderate 7 d/yr ≥101°F today · 15 d/yr by 30 yrs out
- Wind 2/10 Low
- Air quality 2/10 Low 2 unhealthy d/yr today · 2 by 30 yrs out
Nearby sold comps map
Loading sold comps map…
Walkable amenities ~0.75 mi
Loading nearby amenities…
Taxation est. · year 1
- Rental income
- $35,800
- − Mortgage interest
- −$12,211
- − Property taxes
- −$8,265
- − Insurance
- −$1,090
- − Repairs & maintenance
- −$2,864
- − Management
- −$2,864
- − Depreciation
- −$6,342
- Taxable income
- $2,163
- Est. tax owed @ 24.0%
- −$519
- After-tax cash flow
- $4,689/yr
For passive investors: Depreciation is non-cash, so a rental often shows a tax loss while cash-flowing — sheltering income. Rental losses are passive: they offset passive income freely, and up to $25,000/yr can offset ordinary (W-2) income if you actively participate and your MAGI is under $100k (phasing out to $0 by $150k); unused losses carry forward. On sale, claimed depreciation is recaptured at up to 25%, and gains may owe capital-gains tax (a 1031 exchange can defer both). Figures are a year-1 estimate at your 24.0% rate — not tax advice; consult a CPA.
Schools (NCES district)
- District
- Homewood Flossmoor Chsd 233
- NCES district ID
- 1719560
- Math proficiency
- 21% ▼ -15.00%
- Reading proficiency
- 27% ▼ -13.00%
- Median HH income
- $83,564
- Composite
- 24.42/100
- National rank
- #7681
- State rank
- #272 of 620 in IL
Livability — Homewood
- Score
- 81/100
- State rank
- #81
- US rank
- #1314
Category grades
Schools grade is shown separately in the Schools card above.
Census & demographics
- Census place
- Homewood, IL
- City population
- 19,993
- Population (ZIP)
- 19,993
Population outlook (Cook County) Hauer SSP2
- Today (2025)
- 5,347,519 people
- By 2030
- 5,357,703 · +0.2%
- By 2040
- 5,324,924 · -0.4%
- By 2050
- 5,230,762 · -2.2%
- By 2075
- 4,785,735 · -10.5%
- By 2100
- 4,188,836 · -21.7%
Race, ethnicity, and origin ACS 2023
- Neighborhood character
- Diverse neighborhood (Simpson 0.62)
- Race & ethnicity
- Black 44% White 42% Hispanic / Latino 9% Two or more races 6% Asian 1%
- Hispanic origin (detail)
- Mexican 7%
- Common ancestry
- Romanian 5% Iranian 2% Italian 2%
- Foreign-born
- 6% · Canada, Dominican Republic
- Languages at home
- 91% English-only · Spanish 5% Russian/Polish/Slavic 1% German/W. Germanic 1%
Political lean MEDSL · Cook
- 2024 margin
- Solid D (+42.0) · D 70.4% · R 28.4% · Other 1.2%
- 2008→2024 swing
- -11.4pp toward R · 2008: 53.4pp · 2024: 42.0pp
- All cycles
- 2024: D+42.0 2020: D+50.3 2016: D+53.0 2012: D+49.4 2008: D+53.4
Not yet ingested
- Civics
- —
Market trends
- HPI YoY
- ▼ -105.00%
- Current HPI
- 222.2923
- Rent YoY
- —
- Metro
- —
- State GDP YoY
- ▲ 1.59%
- F500 in state
- 60
Industry mix (Fortune 500 HQ in IL)
| Industry | F500 HQs | Revenue |
|---|---|---|
| Insurance | 4 | $201B |
|
||
| Consumer Goods | 4 | $87B |
|
||
| Industrial Machinery | 3 | $64B |
|
||
| Healthcare | 2 | $55B |
|
||
| Retail / Pharmacy | 1 | $148B |
|
||
| Agriculture / Food | 1 | $86B |
|
||
Price history
+296.4% since first listed11 events — show timeline
- 2026-05-15 Price Changed $218,000 MRED as Distributed by MLS Grid
- 2026-04-17 Price Changed $220,000 MRED as Distributed by MLS Grid
- 2026-02-27 Price Changed $222,000 MRED as Distributed by MLS Grid
- 2026-02-06 Price Changed $231,000 MRED as Distributed by MLS Grid
- 2026-01-16 Price Changed $236,000 MRED as Distributed by MLS Grid
- 2025-12-19 Price Changed $243,000 MRED as Distributed by MLS Grid
- 2025-11-21 Price Changed $251,000 MRED as Distributed by MLS Grid
- 2025-10-30 Listed $258,000 MRED as Distributed by MLS Grid
- 2005-08-23 Sold (Public Records) $160,000 Public Records
- 1999-08-16 Sold (Public Records) $97,000 Public Records
- 1984-09-04 Sold (Public Records) $55,000 Public Records
Property tax history
+5.5%/yrLatest (2023): $8,265 · +17.5% YoY. Source: county tax records.
Cash-flow waterfall
monthlySold comps — $/sqft
last 12 mo · ≤1 miLoading sold comps…