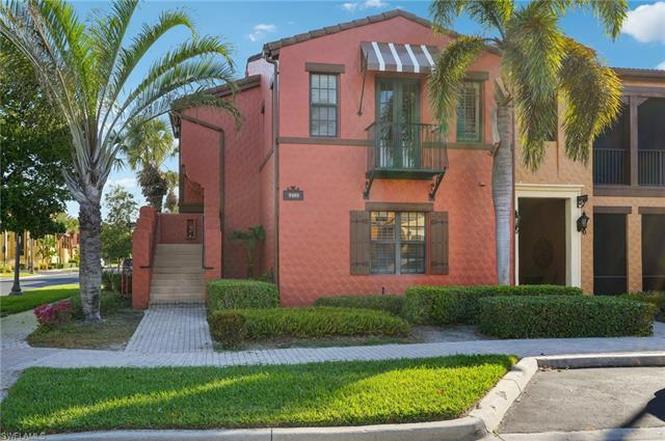
9108 Capistrano St S #7401 · Lely Resort, FL
Flood risk 7/10 · Major
- FEMA flood zone
- AE
- Chance of flooding over 30 yrs
- 0.76%
- Est. flood insurance / yr
- $1,737 – $8,500
Fire risk 4/10 · Minor
- Est. fire insurance / yr
- $947 – $1,759
Heat risk 10/10 · Severe
- Hot days now (above 108°F)
- 7 days/yr
- Hot days in 30 yrs
- 30 days/yr
Wind risk 10/10 · Severe
- Chance of severe wind over 30 yrs
- 99.0%
Air-quality risk 2/10 · Minimal
- Unhealthy air days now
- 2 days/yr
- Unhealthy air days in 30 yrs
- 2 days/yr
Risk factors via First Street. Map © Google.
Why this score? — see what drove the C+ grade
The composite is a weighted blend of 9 inputs, each scored 0–100. Each bar is that input's sub-score; the figure is the points it added to the 100-point composite (weight × sub-score).
- Cash flow +22.8/30.0
- 1% rule +9.2/10.0
- ARV discount +7.5/15.0
- DSCR +7.3/10.0
- Schools +5.0/10.0
- Rent growth +3.9/5.0
- Livability +3.1/5.0
- Condition / age +2.5/5.0
- Appreciation +0.0/10.0
$439,995
🖨 Deal sheet (PDF) 📄 Offer letter ✓ Due diligence
Listing remarks
MOTIVATED Welcome to a beautiful townhouse in the heart of Olé at Lely Resort, one of Naples' most desirable communities. This charming hard to find Santa Clarita 3-bedroom, 2.5-bath split level home offers 1,920 square feet of comfortable living space, perfect for anyone looking to enjoy the Southwest Florida lifestyle. Step inside and feel right at home with the open and airy floor plan. The spacious living and dining areas flow seamlessly, creating an inviting space for relaxing or entertaining. The kitchen is well-equipped with modern appliances, plenty of storage, and a convenient pantry. Off the Kitchen is a wonderful lanai to enjoy your coffee and morning breakfast. The maste
Key facts
- Dual sinks
- Modern appliances
- Wonderful lanai
Tags
Property features AI
Finance
- Other: Complex has 623 units; building contains 5 units with 2 floors
- Financial info: Total annual recurring fees listed; Total one-time fees listed
- HOA & community: Mandatory HOA; Quarterly HOA fee; Master HOA paid annually; Professional management; HOA maintenance covers cable, internet/WiFi, irrigation water, manager, exterior pest control, recreation facilities, sewer, street lights, and water; Community amenities include clubhouse, community pool, spa/hot tub, exercise room, attended fitness center, billiards, library, theater, restaurant, sauna, BBQ/picnic, tennis, pickleball, bocce, basketball, volleyball, sidewalks, guest room and more; Non-gated community (Lely Resort / Olé at Lely Resort)
Exterior
- Parking: Attached 2-car garage
- Security: Impact resistant windows
- Utilities: Central water; Central sewer; Cable available
- Home design: Residential townhouse; End unit; 2 story; Rear exposure facing northwest
- Construction: Concrete block construction; Stucco exterior; Tile roof; Built in 2007; Zero lot line
- Exterior features: Courtyard; Sprinkler system (auto); Open porch / lanai; Balcony
Interior
- Kitchen: Pantry; Electric cooktop; Range; Microwave; Dishwasher; Disposal; Refrigerator
- Bedrooms: 3 bedrooms; First-floor bedroom; Master bedroom upstairs
- Flooring: Carpet; Tile
- Bathrooms: 2 full bathrooms; 1 half bathroom; Master bath with separate tub and shower
- Heating & cooling: Central electric heat; Central electric air conditioning
- Interior features: Cable prewire; Fire sprinkler system; Pantry; Smoke detectors; Turnkey furnished; Split-bedroom floor plan; Two-story layout
- Laundry & utility: Washer and dryer included; Washer/dryer hookup; Auto garage door
Neighborhood map
What this means for you Summary
Snapshot
- This is a 3-bed/2.5-bath condo listed at $440k.
Deal economics
- At list price, monthly cash flow is $340 ($4k/yr) — positive.
- The deal already cash-flows at list — no discount required.
- Meets the 1% rule at list price ($6k rent vs $440k).
- Recommended offer: $387k (12.0% below list) — sets the bar for market timing.
Location & tenants
- Location reads 61/100 on livability (#786 in FL) — a middle-class / working-renter tenant base. Strengths: crime A+, employment A-; Watch: health & safety D, schools F, amenities F.
- Collier (suburban): math 60% / reading 56% proficiency, ranked #16 of 73 in FL (top 22%) — acceptable for families but not a draw, mixed tenant base, ~2y average lease.
- Market conditions: Rents rising fast (+5.6%/yr); 597 active listings in the ZIP; 40 comparable units currently listed for rent nearby; rentals at typical pace (median 24d on market — plan ~3-4 weeks tenant-placement turnaround); solid renter incomes; 3,520 units permitted in Collier County in 2024 (959 in 5+ unit buildings).
- At $6,262/mo this rent would consume 92% of the median local household income ($82k/yr) (locally 954% of renters already pay >50% of income on rent) — very limited rent-growth headroom before tenants either downsize or default.
Forward outlook
- Local home prices are declining (-3.0%/yr); year-one equity from $3k of loan paydown is wiped out by about $13k of value loss. Plan a longer hold.
- Collier County population projected at +30% by 2050 — long-run rental-demand tailwind backs the buy-and-hold thesis.
Negotiation context
- It's been on market 414 days — a 12% lower offer ($387k) is reasonable based on typical stale-listing flexibility.
- Current owner paid $265k; list at $440k implies a 66% gain — meaningful room to come down on a strong offer.
Risks & watch-outs
- Watch-outs: flood insurance adds $427/mo.
- Climate carrying-cost: in FEMA flood zone AE (mandatory federal flood insurance); severe wind risk, 99% chance of damaging wind over 30y; extreme-heat days projected 7→30/yr by 2055 (HVAC capex compounding) — expect insurance premiums to compound above CPI over the hold.
Questions for the listing agent
- It's been on market 414 days. Have you received any prior offers? Is the seller open to a 12% concession, seller financing, or rate buy-down credit?
- What's the actual annual flood-insurance premium (NFIP or private), and is the property in a SFHA with mandatory coverage?
- What does the HOA fee cover, when was the last increase, and are there any pending special assessments or reserve-fund shortfalls?
- Any open or pending special assessments — roof, HVAC, plumbing, elevator, façade? What's the per-unit balance and payoff schedule, and is the seller paying it off at close or rolling it to the buyer?
- Why hasn't it sold? Are there any deal-killer items the seller is aware of (foundation, flood, title, zoning, code violations)?
- Is there a deadline driving the sale (1031 exchange, divorce, estate, relocation)? That informs how much negotiation room exists.
- Schools are F-rated, which usually means shorter tenancies and higher turnover. Who's the typical renter profile here, and what's been the actual vacancy rate?
- What's the average days-on-market for RENTAL listings here right now (not sales)? A rising rental-DOM trend means longer vacancies and softer asking-rent achievability than the comps imply.
- What's the recent tenant-quality profile in this submarket — average credit score on applications, eviction rate, late-payment / NSF rate, and stable-employment percentage? A property-management company in the area should have these aggregated.
- How much new apartment / multifamily construction is in the pipeline within 1–3 miles? Heavy new supply (>2% of stock underway) typically softens rents 12–24 months out; light construction supports rent growth.
Investment metrics
- 1% rule
- 1.42% ✓
- Cap rate
- 8.38%
- Cash-on-cash
- 7.46%
- DSCR
- 1.33
- GRM
- 5.9
CMA / ARV
No comps found within radius.
Projected returns pro-forma
-3.0% appreciation · 5.59% rent growth · sell at horizon
- IRR
- -6.7%
- Equity multiple
- 0.74×
- Total profit
- $-31,872
- Equity at exit
- $65,605
- IRR
- 7.1%
- Equity multiple
- 1.62×
- Total profit
- $76,838
- Equity at exit
- $38,043
Cash invested: $123,199 (down + closing). Projections, not guarantees.
Landlord ↔ Tenant lean methodology
- Overall (STATE)
- 87 Strongly Landlord-Friendly
- State Florida
- 87 Strongly Landlord-Friendly · R+3
- County
- — inherits STATE
- City
- — inherits STATE
ZIP-level market 34113
- Rents YoY
- 5.6%
- Active inventory
- 597
- Price-to-rent
- 5.9×
Monthly cashflow live
- Estimated rent
- $6,262 high interval (Pro) →
- Mortgage (P&I)
- −$2,307
- Tax from tax record
- −$446 /mo · $5,358/yr
- Insurance
- −$183
- Flood insurance flood zone
- −$427 /mo · $5,118/yr
- HOA
- −$1,244
- Vacancy / Maint / Mgmt
- −$1,315
- Net cashflow
- $340
Break-even live
Sensitivity live
| Price | -10% $589 | -5% $464 | +0% $340 | +5% $215 | +10% $90 |
|---|---|---|---|---|---|
| Rent | -10% $-155 | -5% $92 | +0% $340 | +5% $587 | +10% $834 |
| Rate | -1.0pp $561 | -0.5pp $451 | base $340 | +0.5pp $226 | +1.0pp $110 |
UW: 25.0% down · 7.5% · 30yr · 1.5% tax · 5.0% vac · 8.0% maint · 8.0% mgmt
Financing live
Cash to close
- Down payment
- $109,999
- Closing costs
- $13,200
- Reserves months
- —
- Total cash needed
- —
Loan-product check · same deal, 3 products live
Conventional
25% down · 7.5% · 30yr
- Down + closing
- —
- Monthly P&I
- —
- Monthly cashflow
- —
- DSCR
- —
- Eligible?
- —
Personal DTI + credit; lowest rate.
DSCR
20% down · 8.5% · 30yr
- Down + closing
- —
- Monthly P&I
- —
- Monthly cashflow
- —
- DSCR
- —
- Eligible?
- —
No personal income docs; deal must DSCR.
Hard money
10% down · 12.0% · 12mo
- Down + closing
- —
- Monthly P&I
- —
- Monthly cashflow
- —
- DSCR
- —
- Eligible?
- —
Short-term bridge; refi at stabilization.
Rent comps 40 comps
| Address | Beds | Baths | Sqft | Rent | $/sqft | DOM | Units | Dist |
|---|---|---|---|---|---|---|---|---|
| 9111 Capistrano St S #8303 Naples, FL | 2.0 | 2.5 | 1432 | $7,500 | $5.24 | 24d | 1 | 0.06mi |
| 9102 Capistrano St S Unit 72-3 Naples, FL | 2.0 | 2.5 | 1520 | $6,500 | $4.28 | 24d | 1 | 0.06mi |
| 9115 Capistrano St S #8207 Naples, FL | 2.0 | 2.5 | 1494 | $6,000 | $4.02 | 24d | 1 | 0.08mi |
| 9109 Yuba Ln Unit 80 Naples, FL | 3.0 | 2.5 | 1729 | $3,900 | $2.26 | 24d | 1 | 0.09mi |
| 9081 Albion Ln S #6510 Naples, FL | 3.0 | 2.5 | 2004 | $6,280 | $3.13 | 14d | 1 | 0.09mi |
| 9081 Albion Ln S #6505 Naples, FL | 2.0 | 2.0 | 1225 | $7,500 | $6.12 | 24d | 1 | 0.09mi |
| 9102 Chula Vista St #11302 Naples, FL | 2.0 | 2.5 | 1531 | $2,695 | $1.76 | 21d | 1 | 0.14mi |
| 9092 Chula Vista St #11003 Naples, FL | 2.0 | 2.0 | 1404 | $6,850 | $4.88 | 24d | 1 | 0.14mi |
| 9118 Chula Vista St #12002 Naples, FL | 2.0 | 2.5 | 1531 | $4,200 | $2.74 | 24d | 1 | 0.14mi |
| 9072 Rialto St #6302 Naples, FL | 3.0 | 2.0 | 1771 | $8,250 | $4.66 | 21d | 1 | 0.14mi |
| 9088 Chula Vista St Unit 108-3 Naples, FL | 2.0 | 2.0 | 1404 | $5,700 | $4.06 | 24d | 1 | 0.15mi |
| 9071 Albion Ln N #5706 Naples, FL | 2.0 | 2.5 | 1441 | $2,200 | $1.53 | 24d | 1 | 0.15mi |
| 9066 Albion Ln N #5106 Naples, FL | 3.0 | 2.5 | 1715 | $6,500 | $3.79 | 21d | 1 | 0.16mi |
| 9066 Albion Ln N Unit 51-1 Naples, FL | 3.0 | 2.5 | 1989 | $7,000 | $3.52 | 24d | 1 | 0.16mi |
| 9076 Rialto St Unit 62 Naples, FL | 3.0 | 2.5 | 1624 | $7,500 | $4.62 | 24d | 1 | 0.17mi |
| 9073 Rialto St #6002 Naples, FL | 3.0 | 2.0 | 1771 | $7,500 | $4.23 | 24d | 1 | 0.17mi |
| 9082 Capistrano St N Unit 48-5 Naples, FL | 2.0 | 2.0 | 1227 | $6,500 | $5.30 | 24d | 1 | 0.19mi |
| 8965 Malibu Ln #802 Naples, FL | 3.0 | 2.0 | 1771 | $6,595 | $3.72 | 24d | 1 | 0.19mi |
| 9151 Delano St #9702 Naples, FL | 3.0 | 2.5 | 1733 | $2,650 | $1.53 | 14d | 1 | 0.20mi |
| 9155 Delano St Unit 1545913P Naples, FL | 3.0 | 2.0 | 1797 | $3,871 | $2.15 | 14d | 1 | 0.21mi |
| 9159 Delano St #9905 Naples, FL | 3.0 | 2.0 | 1770 | $4,995 | $2.82 | 24d | 1 | 0.23mi |
| 9054 Capistrano St N #4003 Naples, FL | 2.0 | 2.0 | 1385 | $2,495 | $1.80 | 24d | 1 | 0.28mi |
| 9054 Capistrano St N #4002 Naples, FL | 3.0 | 2.0 | 1674 | $6,000 | $3.58 | 24d | 1 | 0.28mi |
| 9161 Chula Vista St Unit 135-2 Naples, FL | 4.0 | 3.0 | 1776 | $7,500 | $4.22 | 24d | 1 | 0.28mi |
| 8519 Chase Preserve Dr Naples, FL | 2.0 | 2.0 | 1827 | $9,000 | $4.93 | 24d | 1 | 0.29mi |
| 9187 Celeste Dr Unit 1073494P Naples, FL | 2.0 | 2.0 | 1399 | $2,979 | $2.13 | 14d | 1 | 0.34mi |
| 8175 Celeste Dr Naples, FL | 2.0 | 2.0 | 1460 | $2,395 | $1.64 | 24d | 1 | 0.36mi |
| 8175 Celeste Dr #1230 Naples, FL | 2.0 | 2.0 | 1476 | $2,775 | $1.88 | 24d | 1 | 0.36mi |
| 8175 Celeste Dr #1229 Naples, FL | 3.0 | 2.0 | 1640 | $2,975 | $1.81 | 24d | 1 | 0.36mi |
| 9025 Alturas St #3102 Naples, FL | 2.0 | 3.0 | 1531 | $3,400 | $2.22 | 24d | 1 | 0.37mi |
| 8135 Celeste Dr #4218 Naples, FL | 2.0 | 2.0 | 1476 | $7,500 | $5.08 | 24d | 1 | 0.38mi |
| 8967 Lely Island Cir Naples, FL | 3.0 | 2.0 | 2056 | $17,000 | $8.27 | 24d | 1 | 0.39mi |
| 8986 Cambria Cir #2204 Naples, FL | 3.0 | 2.0 | 1771 | $7,500 | $4.23 | 24d | 1 | 0.43mi |
| 8986 Cambria Cir Unit 22 Naples, FL | 2.0 | 2.0 | 1404 | $6,000 | $4.27 | 24d | 1 | 0.43mi |
| 8989 Cambria Cir #1807 Naples, FL | 3.0 | 2.5 | 2008 | $7,000 | $3.49 | 14d | 1 | 0.49mi |
| 8125 Celeste Dr #5113 Naples, FL | 3.0 | 2.0 | 1635 | $7,000 | $4.28 | 24d | 1 | 0.50mi |
| 8125 Celeste Dr #5216 Naples, FL | 3.0 | 2.0 | 1640 | $4,500 | $2.74 | 24d | 1 | 0.50mi |
| 8845 Lely Island Cir Naples, FL | 3.0 | 2.0 | 2373 | $12,500 | $5.27 | 24d | 1 | 0.53mi |
| 8992 Cambria Cir Unit 1546062P Naples, FL | 3.0 | 2.0 | 2002 | $3,097 | $1.55 | 14d | 1 | 0.53mi |
| 7052 Live Oak Dr Naples, FL | 2.0 | 2.0 | 1685 | $9,000 | $5.34 | 24d | 1 | 0.55mi |
HOA detail condo
- Monthly dues
- $1,244 · $14,928/yr
- Assessments
- None detected in remarks — confirm with the listing agent.
Listing history 17 events
-
2026-06-18days on market $439,995 Active 414 DOM
-
2026-06-17days on market $439,995 Active 413 DOM
-
2026-06-16days on market $439,995 Active 412 DOM
-
2026-06-15days on market $439,995 Active 411 DOM
-
2026-06-10days on market $439,995 Active 406 DOM
-
2026-06-09days on market $439,995 Active 405 DOM
-
2026-06-08days on market $439,995 Active 404 DOM
-
2026-06-07days on market $439,995 Active 403 DOM
-
2026-06-02days on market $439,995 Active 398 DOM
-
2026-06-01days on market $439,995 Active 397 DOM
-
2026-05-31days on market $439,995 Active 396 DOM
-
2026-05-30days on market $439,995 Active 395 DOM
-
2026-03-28price $439,995
-
2025-12-15price $449,995
-
2025-08-31price $499,000
-
2025-04-30$525,000 Active
-
2013-04-09soldstatus $265,000
ⓘ Source: listings_history table (triggers on properties + properties_extension) + one-shot
backfill from property_details.listing_events for pre-trigger history.
Tax reassessment forecast FL · Resets to sale price
- Current annual tax
- $5,358 · $446/mo
- Projected year-2 tax
- $5,358 · $446/mo
- Expected delta
- $0/yr ($0/mo · 0.0%)
ⓘ Screening estimate from a state-policy table — verify with the county assessor before closing.
Climate risk First Street
- Flood 7/10 Severe FEMA zone AE · 76% chance over 30 yrs
- Wildfire 4/10 Moderate
- Heat 10/10 Extreme 7 d/yr ≥108°F today · 30 d/yr by 30 yrs out
- Wind 10/10 Extreme 99% chance of damaging wind over 30 yrs
- Air quality 2/10 Low 2 unhealthy d/yr today · 2 by 30 yrs out
Nearby sold comps map
Loading sold comps map…
Walkable amenities ~0.75 mi
Loading nearby amenities…
Taxation est. · year 1
- Rental income
- $75,149
- − Mortgage interest
- −$24,647
- − Property taxes
- −$5,358
- − Insurance
- −$7,318
- − Repairs & maintenance
- −$6,012
- − Management
- −$6,012
- − HOA
- −$14,928
- − Depreciation
- −$12,800
- Taxable loss
- −$1,926
- Est. tax savings @ 24.0%
- +$462
- After-tax cash flow
- $4,537/yr
For passive investors: Depreciation is non-cash, so a rental often shows a tax loss while cash-flowing — sheltering income. Rental losses are passive: they offset passive income freely, and up to $25,000/yr can offset ordinary (W-2) income if you actively participate and your MAGI is under $100k (phasing out to $0 by $150k); unused losses carry forward. On sale, claimed depreciation is recaptured at up to 25%, and gains may owe capital-gains tax (a 1031 exchange can defer both). Figures are a year-1 estimate at your 24.0% rate — not tax advice; consult a CPA.
Schools (NCES district)
- District
- Collier
- NCES district ID
- 1200330
- Math proficiency
- 60% ▼ -4.00%
- Reading proficiency
- 56% ▼ -2.00%
- Median HH income
- $58,275
- Composite
- 50.23/100
- National rank
- #1892
- State rank
- #16 of 73 in FL
Livability — Lely Resort
- Score
- 61/100
- State rank
- #786
- US rank
- #17981
Category grades
Schools grade is shown separately in the Schools card above.
Census & demographics
- Census place
- Lely Resort, FL
- County
- Collier County · 396,295 people
- Metro
- Naples-Marco Island, FL
- Population (ZIP)
- 26,056
- Household income
- $81,674
- Rent vs Own
- Severe rent burden
- 954.0
Population outlook (Collier County) Hauer SSP2
- Today (2025)
- 420,858 people
- By 2030
- 450,054 · +6.9%
- By 2040
- 502,232 · +19.3%
- By 2050
- 544,932 · +29.5%
- By 2075
- 627,203 · +49.0%
- By 2100
- 659,015 · +56.6%
Race, ethnicity, and origin ACS 2023
- Neighborhood character
- Diverse neighborhood (Simpson 0.59)
- Race & ethnicity
- White 56% Hispanic / Latino 28% Black 12% Two or more races 11% Asian 2%
- Hispanic origin (detail)
- Mexican 17% Puerto Rican 3% Cuban 2%
- Common ancestry
- Hispanic 10% Romanian 3% Lithuanian 2%
- Foreign-born
- 26% · Canada, Jamaica, Vietnam
- Languages at home
- 63% English-only · Spanish 24% French/Haitian/Cajun 9% Other Indo-European 2%
Political lean MEDSL · Collier
- 2024 margin
- Solid R (+33.1) · D 33.1% · R 66.2%
- 2008→2024 swing
- -10.6pp toward R · 2008: -22.5pp · 2024: -33.1pp
- All cycles
- 2024: R+33.1 2020: R+24.7 2016: R+26.0 2012: R+30.1 2008: R+22.5
Not yet ingested
- Civics
- —
Market trends
- HPI YoY
- ▼ -194.86%
- Current HPI
- 279.4232
- Rent YoY
- ▲ 5.59%
- Metro
- Naples-Marco Island, FL
- State GDP YoY
- ▲ 3.28%
- F500 in state
- 36
Industry mix (Fortune 500 HQ in FL)
| Industry | F500 HQs | Revenue |
|---|---|---|
| Industrial Technology | 2 | $29B |
|
||
| Insurance | 2 | $17B |
|
||
| Retail | 1 | $60B |
|
||
| Technology Distribution | 1 | $58B |
|
||
| Homebuilding | 1 | $35B |
|
||
| Technology Manufacturing | 1 | $35B |
|
||
Price history
+66.0% since first listed5 events — show timeline
- 2026-03-28 Price Changed $439,995 NAPLESMLS
- 2025-12-15 Price Changed $449,995 NAPLESMLS
- 2025-08-31 Price Changed $499,000 NAPLESMLS
- 2025-04-30 Listed $525,000 NAPLESMLS
- 2013-04-09 Sold (Public Records) $265,000 Public Records
Property tax history
+6.2%/yrLatest (2025): $5,358 · +10.3% YoY. Source: county tax records.
Cash-flow waterfall
monthlySold comps — $/sqft
last 12 mo · ≤1 miLoading sold comps…