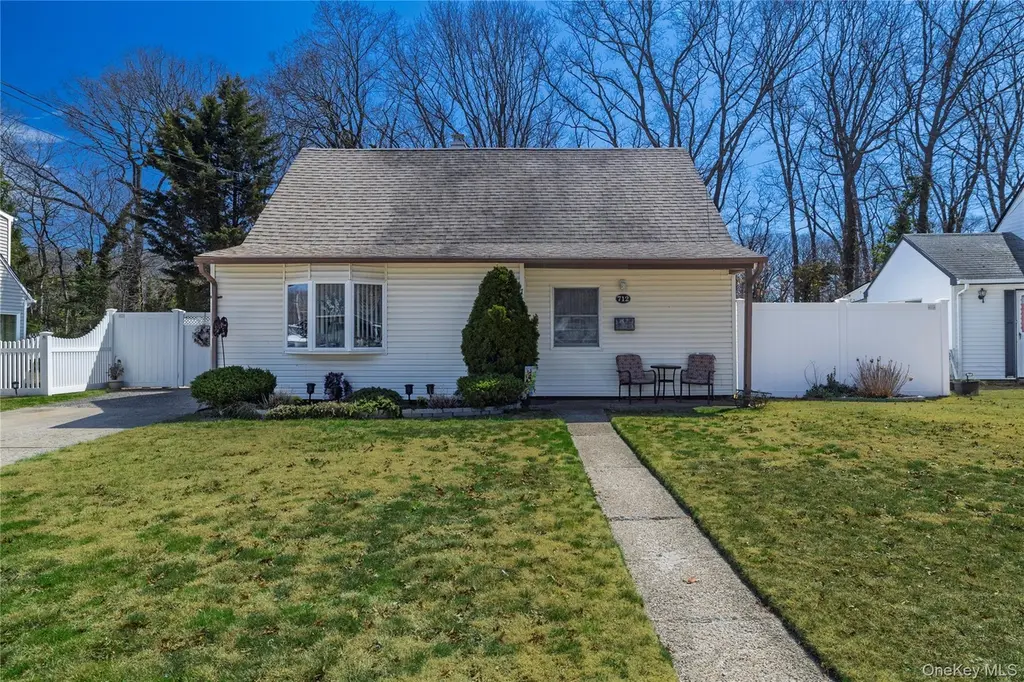
712 Nightingale Rd · West Hempstead, NY
Flood risk 1/10 · Minimal
- FEMA flood zone
- X (unshaded)
- Chance of flooding over 30 yrs
- 0.0%
- Est. flood insurance / yr
- $507 – $1,088
Fire risk 1/10 · Minimal
- Est. fire insurance / yr
- $691 – $1,283
Heat risk 6/10 · Moderate
- Hot days now (above 97°F)
- 7 days/yr
- Hot days in 30 yrs
- 16 days/yr
Wind risk 6/10 · Moderate
- Chance of severe wind over 30 yrs
- 54.0%
Air-quality risk 4/10 · Minor
- Unhealthy air days now
- 5 days/yr
- Unhealthy air days in 30 yrs
- 8 days/yr
Risk factors via First Street. Map © Google.
Why this score? — see what drove the D grade
The composite is a weighted blend of 9 inputs, each scored 0–100. Each bar is that input's sub-score; the figure is the points it added to the 100-point composite (weight × sub-score).
- ARV discount +12.9/15.0
- Cash flow +10.3/30.0
- Schools +5.4/10.0
- Livability +4.3/5.0
- DSCR +3.0/10.0
- 1% rule +2.8/10.0
- Rent growth +2.5/5.0
- Condition / age +2.5/5.0
- Appreciation +0.0/10.0
$640,000
🖨 Deal sheet (PDF) 📄 Offer letter ✓ Due diligence
Listing remarks
This charming well maintained 4 bedroom 2 bath cape in a prime West Hempstead location awaits you! Enter into the spacious living area connected to the eat in kitchen with entry to the patio and yard. The first floor has radiant heat throughout. Two large bedrooms with ample closets and a full bath. The second floor has two large bedrooms and anther full bath. Plenty of room for guests, or a home office. Situated on parklike grounds perfect for entertaining or relaxing. This home is in close proximity to parks, schools, highways, public transportation, and shopping.
Key facts
- Spacious living area
- Eat in kitchen
- Radiant heat
Tags
Neighborhood map
What this means for you Summary
Snapshot
- This is a 4-bed/1.0-bath single-family listed at $640k.
Deal economics
- At list price, monthly cash flow is $-352 ($-4k/yr) — negative.
- To cash-flow at today's rent, offer at most $578k (9.7% below list).
- To meet the 1% rule (rent ≥ 1% of price), the offer needs to be $496k (22.4% below list).
- Recommended offer: $496k (22.4% below list) — sets the bar for 1% rule.
- Cap rate 5.6% vs local median 3.8% in West Hempstead — top-decile yield for the area; either an underpriced asset or a hidden risk that comps aren't pricing in. Stress-test before assuming the spread holds.
Location & tenants
- Location reads 86/100 on livability (#19 in NY, #382 nationally) — a professional / high-income tenant draw. Strengths: amenities A+, commute A+, employment A+; Watch: cost of living F.
- West Hempstead Union Free School District (suburban): math 54% / reading 63% proficiency, ranked #191 of 590 in NY (top 32%) — acceptable for families but not a draw, mixed tenant base, ~2y average lease.
- Zoned schools: George Washington School (math 39% / reading 54%, grade D+, #330 of 729 statewide, top 46%, 336 students, 48% FRL); West Hempstead Secondary School (math 92% / reading 92%, grade A+, #171 of 1,100 statewide, top 18%, 783 students, 50% FRL) — zoned schools average 49% FRL vs 29% district-wide (20 pts higher); higher-poverty schools than district average — tighter screening recommended.
- Market conditions: 101 active listings in the ZIP; 5 comparable units currently listed for rent nearby; rentals leasing fast (median 1d on market — plan ~1-2 weeks tenant-placement turnaround); high-income renter base; 824 units permitted in Nassau County in 2024 (153 in 5+ unit buildings).
- This rent runs 38% of the median local income ($155k/yr) — at the standard rent-burdened threshold; future hikes will face affordability resistance.
Forward outlook
- Local home prices are declining (-3.0%/yr); year-one equity from $4k of loan paydown is wiped out by about $19k of value loss. Plan a longer hold.
- Nassau County population projected at +7% by 2050 — modest demand growth; plan on rents tracking national, not racing it.
Negotiation context
- It's been on market 42 days — a 3% lower offer ($621k) is reasonable based on typical stale-listing flexibility.
- Current owner paid $35k; list at $640k implies a 1729% gain — meaningful room to come down on a strong offer.
Risks & watch-outs
- Watch-outs: built in 1950 — expect roof / HVAC / electrical / plumbing capex.
- Climate carrying-cost: major wind risk, 54% chance of damaging wind over 30y; extreme-heat days projected 7→16/yr by 2055 (HVAC capex compounding) — expect insurance premiums to compound above CPI over the hold.
Questions for the listing agent
- What do current leases actually rent for vs. the listed asking? Can we see a recent rent roll and the last 12 months of T-12 income?
- It's been on market 42 days. Have you received any prior offers? Is the seller open to a 22% concession, seller financing, or rate buy-down credit?
- Built in 1950 — when were the roof, HVAC, electrical panel, plumbing, and water heater last replaced?
- Is there a deadline driving the sale (1031 exchange, divorce, estate, relocation)? That informs how much negotiation room exists.
- Schools are A-rated — typically a magnet for longer-tenancy family renters. What's the average tenant stay here, and is there a school-zone premium baked into asking?
- The area grade is low — what's the realistic commute time and amenity access for the typical tenant pool here? Any planned neighborhood developments (good or bad) we should know about?
- What's the average days-on-market for RENTAL listings here right now (not sales)? A rising rental-DOM trend means longer vacancies and softer asking-rent achievability than the comps imply.
- What's the recent tenant-quality profile in this submarket — average credit score on applications, eviction rate, late-payment / NSF rate, and stable-employment percentage? A property-management company in the area should have these aggregated.
- How much new for-sale + rental construction is in the pipeline within 1–3 miles? Heavy new supply typically softens prices + rents 12–24 months out; constrained supply supports both.
Investment metrics
- 1% rule
- 0.78% ✗
- Cap rate
- 5.63%
- Cash-on-cash
- -2.36%
- DSCR
- 0.90
- GRM
- 10.7
CMA / ARV
- ARV (median comp)
- $727,070
- List price
- $640,000
- Delta
- -11.98%
- Verdict
- UNDERPRICED
- Comps
- 20 within 1.0 mi
Show comp detail 9 sales within ~0.75 mi
| Address | Dist | Beds/Ba | Sqft | Sold | Price | $/sf | Match |
|---|---|---|---|---|---|---|---|
| 675 Jennings Ave | 0.16mi | 4/1.0 | 1,223 (+7%) | 13mo | $615,000 | $503 | 70 |
| 639 Robin Ct | 0.10mi | 4/2.0 | 1,262 (+10%) | 6mo | $650,000 | $515 | 68 |
| 844 Taft St | 0.46mi | 4/2.0 | 1,140 (-0%) | 11mo | $650,000 | $570 | 65 |
| 648 Wadleigh Ave | 0.19mi | 3/1.0 (-1) | 1,185 (+4%) | 24mo | $590,000 | $498 | 60 |
| 747 Janos Ln | 0.28mi | 3/2.0 (-1) | 1,238 (+8%) | 7mo | $745,000 | $602 | 58 |
| 596 Lincoln Ave | 0.26mi | 3/2.0 (-1) | 978 (-14%) | 8mo | $586,000 | $599 | 48 |
| 432 Barbara Ln | 0.62mi | 4/2.0 | 1,176 (+3%) | 19mo | $729,000 | $620 | 46 |
| 596 Maple St | 0.35mi | 3/1.0 (-1) | 1,278 (+12%) | 20mo | $600,000 | $469 | 42 |
| 854 Monroe St | 0.55mi | 4/2.0 | 1,274 (+12%) | 20mo | $660,000 | $518 | 35 |
Match score weights: distance 35% · size 25% · config 20% · recency 20%. Top-matched comps best support the ARV.
Projected returns pro-forma
-3.0% appreciation · 3.0% rent growth · sell at horizon
- IRR
- -20.2%
- Equity multiple
- 0.30×
- Total profit
- $-126,131
- Equity at exit
- $95,426
- IRR
- -13.3%
- Equity multiple
- 0.23×
- Total profit
- $-138,753
- Equity at exit
- $55,336
Cash invested: $179,200 (down + closing). Projections, not guarantees.
Landlord ↔ Tenant lean methodology
- Overall (STATE)
- 15 Strongly Tenant-Friendly
- State New York
- 15 Strongly Tenant-Friendly · D+10
- County
- — inherits STATE
- City
- — inherits STATE
ZIP-level market 11552
- Active inventory
- 101
- Price-to-rent
- 10.7×
Monthly cashflow live
- Estimated rent
- $4,964 high interval (Pro) →
- Mortgage (P&I)
- −$3,356
- Tax from tax record
- −$651 /mo · $7,810/yr
- Insurance
- −$267
- HOA
- −$0
- Vacancy / Maint / Mgmt
- −$1,043
- Net cashflow
- $-352
Break-even live
Sensitivity live
| Price | -10% $10 | -5% $-171 | +0% $-352 | +5% $-533 | +10% $-714 |
|---|---|---|---|---|---|
| Rent | -10% $-744 | -5% $-548 | +0% $-352 | +5% $-156 | +10% $40 |
| Rate | -1.0pp $-30 | -0.5pp $-189 | base $-352 | +0.5pp $-518 | +1.0pp $-686 |
UW: 25.0% down · 7.5% · 30yr · 1.5% tax · 5.0% vac · 8.0% maint · 8.0% mgmt
Financing live
Cash to close
- Down payment
- $160,000
- Closing costs
- $19,200
- Reserves months
- —
- Total cash needed
- —
Loan-product check · same deal, 3 products live
Conventional
25% down · 7.5% · 30yr
- Down + closing
- —
- Monthly P&I
- —
- Monthly cashflow
- —
- DSCR
- —
- Eligible?
- —
Personal DTI + credit; lowest rate.
DSCR
20% down · 8.5% · 30yr
- Down + closing
- —
- Monthly P&I
- —
- Monthly cashflow
- —
- DSCR
- —
- Eligible?
- —
No personal income docs; deal must DSCR.
Hard money
10% down · 12.0% · 12mo
- Down + closing
- —
- Monthly P&I
- —
- Monthly cashflow
- —
- DSCR
- —
- Eligible?
- —
Short-term bridge; refi at stabilization.
Rent comps 5 comps
| Address | Beds | Baths | Sqft | Rent | $/sqft | DOM | Units | Dist |
|---|---|---|---|---|---|---|---|---|
| 582 Washington Ave West Hempstead, NY | 4.0 | 1.0 | 1440 | $4,500 | $3.12 | 15d | 1 | 0.30mi |
| 345 Walton St West Hempstead, NY | 4.0 | 2.5 | 1274 | $4,525 | $3.55 | 0d | 1 | 0.72mi |
| 3 Keuka Rd West Hempstead, NY | 3.0 | 1.0 | 916 | $3,000 | $3.28 | 24d | 1 | 0.82mi |
| 130 Hempstead Ave West Hempstead, NY | 1.0–3.0 | 1.0–2.0 | 1113 | $5,521 | $4.96 | 0d | 6 | 1.29mi |
| 111 Hempstead Tpke West Hempstead, NY | 3.0 | 1.0–2.5 | 1226 | $6,776 | $5.52 | 0d | 88 | 1.40mi |
Listing history 2 events
-
2026-04-04$640,000 Active
-
1978-10-01soldstatus $35,000
ⓘ Source: listings_history table (triggers on properties + properties_extension) + one-shot
backfill from property_details.listing_events for pre-trigger history.
Tax reassessment forecast NY · Partial reset (capped growth)
- Current annual tax
- $7,810 · $651/mo
- Projected year-2 tax
- $9,313 · $776/mo
- Expected delta
- +$1,503/yr (+$125/mo · 19.2%)
ⓘ Screening estimate from a state-policy table — verify with the county assessor before closing.
Climate risk First Street
- Flood 1/10 Low FEMA zone X (unshaded) · 0% chance over 30 yrs
- Wildfire 1/10 Low
- Heat 6/10 Major 7 d/yr ≥97°F today · 16 d/yr by 30 yrs out
- Wind 6/10 Major 54% chance of damaging wind over 30 yrs
- Air quality 4/10 Moderate 5 unhealthy d/yr today · 8 by 30 yrs out
Nearby sold comps map
Loading sold comps map…
Walkable amenities ~0.75 mi
Loading nearby amenities…
Taxation est. · year 1
- Rental income
- $59,574
- − Mortgage interest
- −$35,850
- − Property taxes
- −$7,810
- − Insurance
- −$3,200
- − Repairs & maintenance
- −$4,766
- − Management
- −$4,766
- − Depreciation
- −$18,618
- Taxable loss
- −$15,436
- Est. tax savings @ 24.0%
- +$3,705
- After-tax cash flow
- $-517/yr
For passive investors: Depreciation is non-cash, so a rental often shows a tax loss while cash-flowing — sheltering income. Rental losses are passive: they offset passive income freely, and up to $25,000/yr can offset ordinary (W-2) income if you actively participate and your MAGI is under $100k (phasing out to $0 by $150k); unused losses carry forward. On sale, claimed depreciation is recaptured at up to 25%, and gains may owe capital-gains tax (a 1031 exchange can defer both). Figures are a year-1 estimate at your 24.0% rate — not tax advice; consult a CPA.
Schools (NCES district)
- District
- West Hempstead Union Free School District
- NCES district ID
- 3630660
- Math proficiency
- 54% ▼ -3.00%
- Reading proficiency
- 63% ▲ 7.00%
- Median HH income
- $98,641
- Composite
- 54.45/100
- National rank
- #1354
- State rank
- #191 of 590 in NY
Livability — West Hempstead
- Score
- 86/100
- State rank
- #19
- US rank
- #382
Category grades
Schools grade is shown separately in the Schools card above.
Census & demographics
- Census place
- West Hempstead, NY
- County
- Nassau County · 653,051 people
- City population
- 25,174
- Metro
- New York-Newark-Jersey City, NY-NJ-PA
- Population (ZIP)
- 25,174
- Household income
- $155,154
- Rent vs Own
- Severe rent burden
- 208.0
Population outlook (Nassau County) Hauer SSP2
- Today (2025)
- 1,409,302 people
- By 2030
- 1,431,482 · +1.6%
- By 2040
- 1,471,607 · +4.4%
- By 2050
- 1,502,845 · +6.6%
- By 2075
- 1,575,403 · +11.8%
- By 2100
- 1,554,356 · +10.3%
Race, ethnicity, and origin ACS 2023
- Neighborhood character
- Diverse neighborhood (Simpson 0.68)
- Race & ethnicity
- White 48% Hispanic / Latino 24% Black 18% Two or more races 8% Asian 5%
- Hispanic origin (detail)
- Puerto Rican 4% Dominican 7%
- Common ancestry
- Romanian 6% Hispanic 3% Scotch-Irish 2%
- Foreign-born
- 22% · Canada, Jamaica, China
- Languages at home
- 70% English-only · Spanish 17% Other Indo-European 3% French/Haitian/Cajun 2%
Political lean MEDSL · Nassau
- 2024 margin
- Toss-up / Even · D 47.9% · R 52.1%
- 2008→2024 swing
- -12.6pp toward R · 2008: 8.4pp · 2024: -4.2pp
- All cycles
- 2024: R+4.2 2020: D+9.5 2016: D+5.3 2012: D+6.7 2008: D+8.4
Not yet ingested
- Civics
- —
Market trends
- HPI YoY
- ▼ -803.45%
- Current HPI
- 335.0721
- Rent YoY
- —
- Metro
- New York-Newark-Jersey City, NY-NJ-PA
- State GDP YoY
- ▲ 2.60%
- F500 in state
- 92
Industry mix (Fortune 500 HQ in NY)
| Industry | F500 HQs | Revenue |
|---|---|---|
| Financial Services | 10 | $950B |
|
||
| Consumer Goods | 9 | $162B |
|
||
| Insurance | 4 | $225B |
|
||
| Telecommunications | 2 | $144B |
|
||
| Pharmaceuticals | 2 | $112B |
|
||
| Media / Entertainment | 2 | $69B |
|
||
Price history
+1728.6% since first listed2 events — show timeline
- 2026-04-04 Listed $640,000 OneKey® MLS as Distributed by MLS Grid
- 1978-10-01 Sold (Public Records) $35,000 Public Records
Property tax history
+1.4%/yrLatest (2024): $7,810 · +1.3% YoY. Source: county tax records.
Cash-flow waterfall
monthlySold comps — $/sqft
last 12 mo · ≤1 miLoading sold comps…