324 29th St E · Lakehills, TX
Flood risk 1/10 · Minimal
- FEMA flood zone
- X (unshaded)
- Chance of flooding over 30 yrs
- 0.0%
- Est. flood insurance / yr
- $507 – $1,088
Fire risk 3/10 · Minor
- Est. fire insurance / yr
- $1,222 – $2,270
Heat risk 7/10 · Major
- Hot days now (above 106°F)
- 7 days/yr
- Hot days in 30 yrs
- 22 days/yr
Wind risk 6/10 · Moderate
- Chance of severe wind over 30 yrs
- 58.0%
Air-quality risk 2/10 · Minimal
- Unhealthy air days now
- 0 days/yr
- Unhealthy air days in 30 yrs
- 1 days/yr
Risk factors via First Street. Map © Google.
Why this score? — see what drove the B- grade
The composite is a weighted blend of 9 inputs, each scored 0–100. Each bar is that input's sub-score; the figure is the points it added to the 100-point composite (weight × sub-score).
- Cash flow +30.0/30.0
- DSCR +10.0/10.0
- 1% rule +9.8/10.0
- ARV discount +7.5/15.0
- Schools +3.1/10.0
- Livability +3.1/5.0
- Rent growth +2.5/5.0
- Condition / age +2.5/5.0
- Appreciation +0.0/10.0
$164,900
🖨 Deal sheet (PDF) 📄 Offer letter ✓ Due diligence
Listing remarks
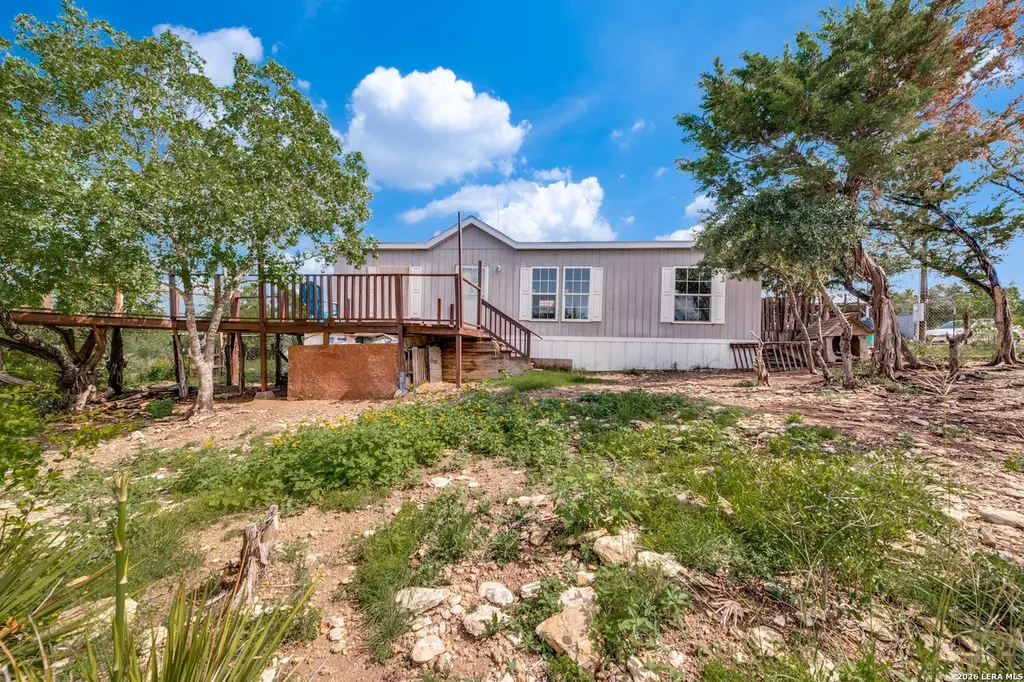
Hill Country freedom on 1.24 acres just minutes from Medina Lake. This fully fenced property offers a rare mix of privacy, functionality, and self-sufficiency with a 2019 (960 sq ft) manufactured home and multiple outbuildings already in place. Everything works! electric - plumbing - septic - HVAC. Plus it's move-in ready, deep cleaned with new luxury plank vinyl flooring. The property is set up for a homestead lifestyle with a pot-belly pig pen, chicken coop, small pole barn and tuff shed, making it ideal for those looking to live off the land or simply enjoy a more independent way of life. Quiet, remote feel without being far from town. Whether you're looking for a weekend escape, rental
Key facts
- Fully fenced
- Pot-belly pig pen
- 1.24 acres
Tags
Property features AI
Finance
- HOA & community: Subdivision: AVALON
Exterior
- Utilities: Electric service by Bandera COOP; Delivered water; Septic system; Garbage service: Trash Gremli
- Home design: Pre-owned home; Built by Clayton Homes; Approximate age: 7 years
- Construction: Composition roof; Other foundation (see remarks)
- Exterior features: Siding exterior; Lot about 1–2 acres
Interior
- Kitchen: Stove/Range; Refrigerator
- Bedrooms: Master bedroom (lower level) — 12 x 12; Bedroom 2 — 11 x 9; Bedroom 3 — 9 x 10
- Flooring: Carpeting; Vinyl flooring
- Bathrooms: Two full bathrooms; Master bath with tub/shower combination — 5 x 8; Additional bathroom (main level) — 5 x 8 (approx)
- Heating & cooling: Central heating; Heat pump heating; Electric heat; Central air conditioning; Heat pump A/C
- Interior features: Ceiling fans; Smoke alarm; Electric water heater; All window coverings remain; One living area
- Laundry & utility: Washer connection; Dryer connection; Stacked washer/dryer
Neighborhood map
What this means for you Summary
Snapshot
- This is a 3-bed/2.0-bath manufactured listed at $165k.
Deal economics
- At list price, monthly cash flow is $808 ($10k/yr) — positive.
- The deal already cash-flows at list — no discount required.
- Meets the 1% rule at list price ($2k rent vs $165k).
- Recommended offer: $162k (1.5% below list) — sets the bar for market timing.
- Cap rate 12.2% vs local median 2.3% in Lakehills — top-decile yield for the area; either an underpriced asset or a hidden risk that comps aren't pricing in. Stress-test before assuming the spread holds.
Location & tenants
- Location reads 62/100 on livability (#963 in TX) — a middle-class / working-renter tenant base. Strengths: cost of living A+, housing A+, crime B+; Watch: amenities F, commute F, health & safety F.
- Bandera ISD (rural): math 30% / reading 41% proficiency, ranked #500 of 826 in TX (top 60%) — families likely to look elsewhere, expect single-tenant / working-renter base with shorter leases.
- Zoned schools: Hill Country El (math 47% / reading 46%, grade D-, #1,080 of 4,322 statewide, top 25%, 483 students, 62% FRL); Bandera H S (math 22% / reading 46%, grade F, #1,002 of 1,632 statewide, top 62%, 713 students, 48% FRL).
- Market conditions: 267 active listings in the ZIP; 2 comparable units currently listed for rent nearby; 6 units permitted in Bandera County in 2024 (0 in 5+ unit buildings).
Forward outlook
- Local home prices are declining (-3.0%/yr); year-one equity from $1k of loan paydown is wiped out by about $5k of value loss. Plan a longer hold.
- At projected returns (-3.0% appreciation + 3.0% rent growth), your $46k cash investment doubles in ~6 years — after that, you're playing with house money.
Negotiation context
- It's been on market 24 days — a 2% lower offer ($162k) is reasonable based on typical stale-listing flexibility.
Risks & watch-outs
- Climate carrying-cost: major wind risk, 58% chance of damaging wind over 30y; extreme-heat days projected 7→22/yr by 2055 (HVAC capex compounding) — expect insurance premiums to compound above CPI over the hold.
Questions for the listing agent
- Is there a deadline driving the sale (1031 exchange, divorce, estate, relocation)? That informs how much negotiation room exists.
- Schools are D-rated, which usually means shorter tenancies and higher turnover. Who's the typical renter profile here, and what's been the actual vacancy rate?
- What's the average days-on-market for RENTAL listings here right now (not sales)? A rising rental-DOM trend means longer vacancies and softer asking-rent achievability than the comps imply.
- What's the recent tenant-quality profile in this submarket — average credit score on applications, eviction rate, late-payment / NSF rate, and stable-employment percentage? A property-management company in the area should have these aggregated.
- How much new for-sale + rental construction is in the pipeline within 1–3 miles? Heavy new supply typically softens prices + rents 12–24 months out; constrained supply supports both.
Investment metrics
- 1% rule
- 1.48% ✓
- Cap rate
- 12.17%
- Cash-on-cash
- 21.00%
- DSCR
- 1.93
- GRM
- 5.6
CMA / ARV
No comps found within radius.
Projected returns pro-forma
-3.0% appreciation · 3.0% rent growth · sell at horizon
- IRR
- 13.4%
- Equity multiple
- 1.54×
- Total profit
- $24,777
- Equity at exit
- $24,587
- IRR
- 22.3%
- Equity multiple
- 2.91×
- Total profit
- $87,960
- Equity at exit
- $14,258
Cash invested: $46,172 (down + closing). Projections, not guarantees.
Landlord ↔ Tenant lean methodology
- Overall (STATE)
- 87 Strongly Landlord-Friendly
- State Texas
- 87 Strongly Landlord-Friendly · R+5
- County
- — inherits STATE
- City
- — inherits STATE
ZIP-level market 78063
- Home prices YoY
- -31.6%
- Active inventory
- 267
- Price-to-rent
- 5.6×
Monthly cashflow live
- Estimated rent
- $2,444 medium interval (Pro) →
- Mortgage (P&I)
- −$865
- Tax from tax record
- −$189 /mo · $2,273/yr
- Insurance
- −$69
- HOA
- −$0
- Vacancy / Maint / Mgmt
- −$513
- Net cashflow
- $808
Break-even live
Sensitivity live
| Price | -10% $901 | -5% $855 | +0% $808 | +5% $761 | +10% $715 |
|---|---|---|---|---|---|
| Rent | -10% $615 | -5% $712 | +0% $808 | +5% $905 | +10% $1,001 |
| Rate | -1.0pp $891 | -0.5pp $850 | base $808 | +0.5pp $765 | +1.0pp $722 |
UW: 25.0% down · 7.5% · 30yr · 1.5% tax · 5.0% vac · 8.0% maint · 8.0% mgmt
Financing live
Cash to close
- Down payment
- $41,225
- Closing costs
- $4,947
- Reserves months
- —
- Total cash needed
- —
Loan-product check · same deal, 3 products live
Conventional
25% down · 7.5% · 30yr
- Down + closing
- —
- Monthly P&I
- —
- Monthly cashflow
- —
- DSCR
- —
- Eligible?
- —
Personal DTI + credit; lowest rate.
DSCR
20% down · 8.5% · 30yr
- Down + closing
- —
- Monthly P&I
- —
- Monthly cashflow
- —
- DSCR
- —
- Eligible?
- —
No personal income docs; deal must DSCR.
Hard money
10% down · 12.0% · 12mo
- Down + closing
- —
- Monthly P&I
- —
- Monthly cashflow
- —
- DSCR
- —
- Eligible?
- —
Short-term bridge; refi at stabilization.
Rent comps 2 comps
| Address | Beds | Baths | Sqft | Rent | $/sqft | DOM | Units | Dist |
|---|---|---|---|---|---|---|---|---|
| 105 Hi View Dr Lakehills, TX | 3.0 | 1.0 | 860 | $3,100 | $3.60 | 1d | 1 | 1.13mi |
| 186 Lakeview Rd Lakehills, TX | 2.0 | 1.0 | 920 | $1,800 | $1.96 | 1d | 1 | 1.19mi |
Listing history 15 events
-
2026-06-18days on market $164,900 Active 24 DOM
-
2026-06-17days on market $164,900 Active 23 DOM
-
2026-06-16days on market $164,900 Active 22 DOM
-
2026-06-15days on market $164,900 Active 21 DOM
-
2026-06-13days on market $164,900 Active 19 DOM
-
2026-06-09days on market $164,900 Active 15 DOM
-
2026-06-07statusdays on market $164,900 Active 13 DOM
-
2026-06-04days on market $164,900 New 10 DOM
-
2026-06-03days on market $164,900 New 9 DOM
-
2026-06-02days on market $164,900 New 8 DOM
-
2026-06-01days on market $164,900 New 7 DOM
-
2026-05-31days on market $164,900 New 6 DOM
-
2026-05-25$164,900 New
-
2019-01-07soldstatus
-
2002-07-19soldstatus
ⓘ Source: listings_history table (triggers on properties + properties_extension) + one-shot
backfill from property_details.listing_events for pre-trigger history.
Tax reassessment forecast TX · Resets to sale price
- Current annual tax
- $2,273 · $189/mo
- Projected year-2 tax
- $3,018 · $251/mo
- Expected delta
- +$744/yr (+$62/mo · 32.7%)
ⓘ Screening estimate from a state-policy table — verify with the county assessor before closing.
Climate risk First Street
- Flood 1/10 Low FEMA zone X (unshaded) · 0% chance over 30 yrs
- Wildfire 3/10 Moderate
- Heat 7/10 Severe 7 d/yr ≥106°F today · 22 d/yr by 30 yrs out
- Wind 6/10 Major 58% chance of damaging wind over 30 yrs
- Air quality 2/10 Low 0 unhealthy d/yr today · 1 by 30 yrs out
Nearby sold comps map
Loading sold comps map…
Walkable amenities ~0.75 mi
Loading nearby amenities…
Taxation est. · year 1
- Rental income
- $29,332
- − Mortgage interest
- −$9,237
- − Property taxes
- −$2,273
- − Insurance
- −$824
- − Repairs & maintenance
- −$2,347
- − Management
- −$2,347
- − Depreciation
- −$4,797
- Taxable income
- $7,507
- Est. tax owed @ 24.0%
- −$1,802
- After-tax cash flow
- $7,896/yr
For passive investors: Depreciation is non-cash, so a rental often shows a tax loss while cash-flowing — sheltering income. Rental losses are passive: they offset passive income freely, and up to $25,000/yr can offset ordinary (W-2) income if you actively participate and your MAGI is under $100k (phasing out to $0 by $150k); unused losses carry forward. On sale, claimed depreciation is recaptured at up to 25%, and gains may owe capital-gains tax (a 1031 exchange can defer both). Figures are a year-1 estimate at your 24.0% rate — not tax advice; consult a CPA.
Schools (NCES district)
- District
- Bandera ISD
- NCES district ID
- 4809360
- Math proficiency
- 30% ▼ -7.00%
- Reading proficiency
- 41% ▼ -3.00%
- Median HH income
- $48,771
- Composite
- 30.61/100
- National rank
- #6194
- State rank
- #500 of 826 in TX
Livability — Lakehills
- Score
- 62/100
- State rank
- #963
- US rank
- #17024
Category grades
Schools grade is shown separately in the Schools card above.
Census & demographics
- Census place
- Lakehills, TX
- City population
- 10,594
- Population (ZIP)
- 10,594
Population outlook (Bandera County) Hauer SSP2
- Today (2025)
- 22,614 people
- By 2030
- 23,102 · +2.2%
- By 2040
- 23,489 · +3.9%
- By 2050
- 23,264 · +2.9%
- By 2075
- 23,607 · +4.4%
- By 2100
- 22,265 · -1.5%
Race, ethnicity, and origin ACS 2023
- Neighborhood character
- Predominantly White (76%)
- Race & ethnicity
- White 76% Hispanic / Latino 18% Two or more races 15%
- Hispanic origin (detail)
- Mexican 15%
- Common ancestry
- Slovak 5% Romanian 3% Serbian 2%
- Foreign-born
- 5% · Canada
- Languages at home
- 88% English-only · Spanish 9% German/W. Germanic 2%
Political lean MEDSL · Bandera
- 2024 margin
- Solid R (+61.9) · D 18.6% · R 80.5%
- 2008→2024 swing
- -11.5pp toward R · 2008: -50.4pp · 2024: -61.9pp
- All cycles
- 2024: R+61.9 2020: R+59.4 2016: R+63.0 2012: R+59.0 2008: R+50.4
Not yet ingested
- Civics
- —
Market trends
- HPI YoY
- ▼ -87.38%
- Current HPI
- 189.1086
- Rent YoY
- —
- Metro
- —
- State GDP YoY
- ▲ 3.95%
- F500 in state
- 110
Industry mix (Fortune 500 HQ in TX)
| Industry | F500 HQs | Revenue |
|---|---|---|
| Energy | 16 | $1,198B |
|
||
| Technology | 5 | $198B |
|
||
| Engineering / Construction | 4 | $72B |
|
||
| Energy Services | 3 | $60B |
|
||
| Utilities | 3 | $41B |
|
||
| Healthcare | 2 | $330B |
|
||
Price history
3 events — show timeline
- 2026-05-25 Listed $164,900 LERA
- 2019-01-07 Sold (Public Records) — Public Records
- 2002-07-19 Sold (Public Records) — Public Records
Property tax history
+21.8%/yrLatest (2025): $2,273 · +17.1% YoY. Source: county tax records.
Cash-flow waterfall
monthlySold comps — $/sqft
last 12 mo · ≤1 miLoading sold comps…