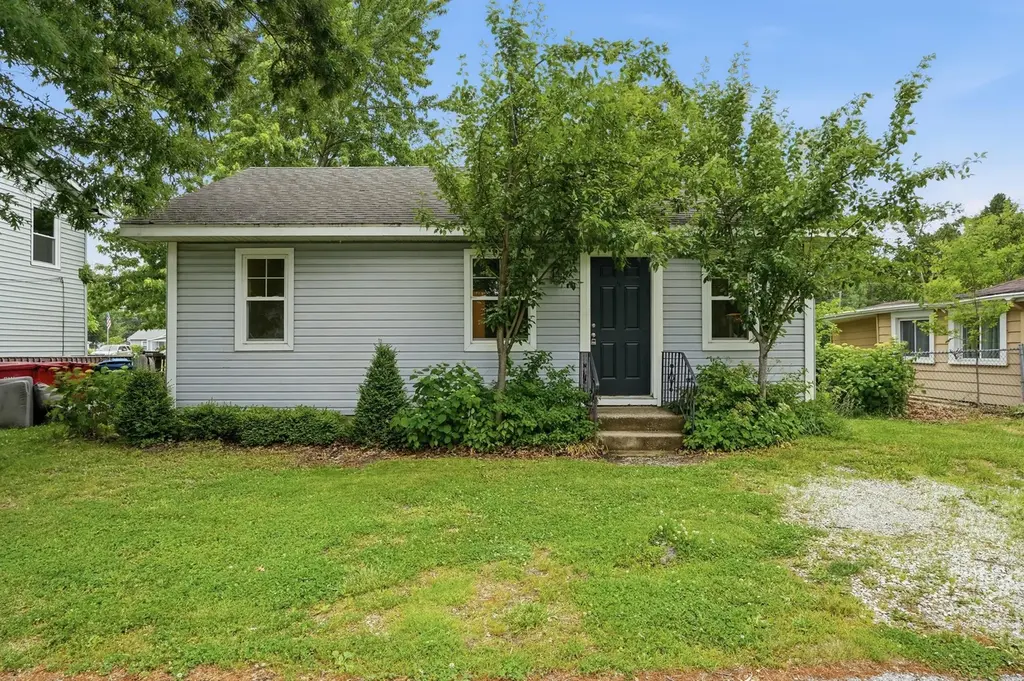
7206 W 129th Ave · Cedar Lake, IN
Flood risk 1/10 · Minimal
- FEMA flood zone
- X (unshaded)
- Chance of flooding over 30 yrs
- 0.0%
- Est. flood insurance / yr
- $507 – $1,088
Fire risk 2/10 · Minimal
- Est. fire insurance / yr
- $717 – $1,331
Heat risk 2/10 · Minimal
- Hot days now (above 100°F)
- 7 days/yr
- Hot days in 30 yrs
- 16 days/yr
Wind risk 2/10 · Minimal
- Chance of severe wind over 30 yrs
- 0.0%
Air-quality risk 2/10 · Minimal
- Unhealthy air days now
- 1 days/yr
- Unhealthy air days in 30 yrs
- 1 days/yr
Risk factors via First Street. Map © Google.
Why this score? — see what drove the B grade
The composite is a weighted blend of 9 inputs, each scored 0–100. Each bar is that input's sub-score; the figure is the points it added to the 100-point composite (weight × sub-score).
- Cash flow +29.3/30.0
- ARV discount +15.0/15.0
- DSCR +10.0/10.0
- 1% rule +6.9/10.0
- Schools +5.0/10.0
- Livability +3.2/5.0
- Rent growth +2.5/5.0
- Condition / age +2.5/5.0
- Appreciation +0.0/10.0
$120,000
🖨 Deal sheet (PDF) 📄 Offer letter ✓ Due diligence
Listing remarks MLS
Great cottage steps to Lake. No buyer restrictions. Sold as is where is.
Key facts
- Lake lifestyle
- Spacious lot
- Cedar lake cottage
Tags
Property features AI
Exterior
- Utilities: Public water; Public sewer
- Home design: Single-story home; Built in 1925
- Exterior features: No notable view
Interior
- Kitchen: Refrigerator; Gas range
- Bedrooms: Primary bedroom; Second bedroom
- Bathrooms: 1 full bathroom
- Heating & cooling: Central air conditioning; Natural gas heating
- Interior features: No additional interior features listed
- Laundry & utility: Washer; Dryer
Neighborhood map
What this means for you Summary
Snapshot
- This is a 2-bed/1.0-bath single-family listed at $120k.
Deal economics
- At list price, monthly cash flow is $422 ($5k/yr) — positive.
- The deal already cash-flows at list — no discount required.
- Meets the 1% rule at list price ($1k rent vs $120k).
- Cap rate 10.5% vs local median 3.5% in Cedar Lake — top-decile yield for the area; either an underpriced asset or a hidden risk that comps aren't pricing in. Stress-test before assuming the spread holds.
Location & tenants
- Location reads 65/100 on livability (#354 in IN) — a middle-class / working-renter tenant base. Strengths: crime A+, cost of living A+, housing A+; Watch: amenities F, commute F, health & safety F.
- Crown Point Community School Corporation (suburban): math 51% / reading 61% proficiency, ranked #23 of 301 in IN (top 8%) — acceptable for families but not a draw, mixed tenant base, ~2y average lease; only 18% free/reduced lunch — higher-income household profile.
- Market conditions: 269 active listings in the ZIP; solid renter incomes; 1,642 units permitted in Lake County in 2024 (14 in 5+ unit buildings).
Forward outlook
- Local home prices are declining (-3.0%/yr); year-one equity from $830 of loan paydown is wiped out by about $4k of value loss. Plan a longer hold.
- Lake County population projected to shrink 7% by 2050 — rents likely to lag national; underwrite the cash flow, not the appreciation.
- At projected returns (-3.0% appreciation + 3.0% rent growth), your $34k cash investment doubles in ~8 years — after that, you're playing with house money.
Negotiation context
- Only 4 days on market — expect competitive offers; lowballing is unlikely to land.
- 4 sale attempts since 25y ago with the ask held roughly flat each time — persistent listings suggest the price (not the market) is what's stuck; bring a comps-based counter.
- Current owner paid $32k; list at $120k implies a 275% gain — meaningful room to come down on a strong offer.
Risks & watch-outs
- Watch-outs: built in 1925 — expect roof / HVAC / electrical / plumbing capex.
Questions for the listing agent
- Built in 1925 — when were the roof, HVAC, electrical panel, plumbing, and water heater last replaced?
- Is there a deadline driving the sale (1031 exchange, divorce, estate, relocation)? That informs how much negotiation room exists.
- What's the average days-on-market for RENTAL listings here right now (not sales)? A rising rental-DOM trend means longer vacancies and softer asking-rent achievability than the comps imply.
- What's the recent tenant-quality profile in this submarket — average credit score on applications, eviction rate, late-payment / NSF rate, and stable-employment percentage? A property-management company in the area should have these aggregated.
- How much new for-sale + rental construction is in the pipeline within 1–3 miles? Heavy new supply typically softens prices + rents 12–24 months out; constrained supply supports both.
Investment metrics
- 1% rule
- 1.19% ✓
- Cap rate
- 10.51%
- Cash-on-cash
- 15.06%
- DSCR
- 1.67
- GRM
- 7.0
CMA / ARV
- ARV (on-the-fly)
- $158,472
- Comps found
- 7
Show comp detail 7 sales within ~0.75 mi
| Address | Dist | Beds/Ba | Sqft | Sold | Price | $/sf | Match |
|---|---|---|---|---|---|---|---|
| 12732 Edison St | 0.21mi | 2/1.0 | 744 (0%) | 13mo | $206,000 | $277 | 80 |
| 7409 W 129th Ave | 0.15mi | 2/1.0 | 738 (-1%) | 15mo | $198,000 | $268 | 79 |
| 7216 W 128th Ln | 0.05mi | 2/1.0 | 751 (+1%) | 22mo | $130,000 | $173 | 78 |
| 7224 W 128th Ln | 0.06mi | 2/1.0 | 705 (-5%) | 16mo | $168,000 | $238 | 75 |
| 7121 W 128th Ln | 0.06mi | 2/1.0 | 697 (-6%) | 16mo | $125,000 | $179 | 74 |
| 6819 W 128th Pl | 0.24mi | 3/1.0 (+1) | 800 (+8%) | 12mo | $170,000 | $213 | 61 |
| 8103 W 127th Pl | 0.59mi | 2/1.0 | 720 (-3%) | 19mo | $125,000 | $174 | 51 |
Match score weights: distance 35% · size 25% · config 20% · recency 20%. Top-matched comps best support the ARV.
Projected returns pro-forma
-3.0% appreciation · 3.0% rent growth · sell at horizon
- IRR
- 5.6%
- Equity multiple
- 1.22×
- Total profit
- $7,353
- Equity at exit
- $17,892
- IRR
- 15.0%
- Equity multiple
- 2.21×
- Total profit
- $40,759
- Equity at exit
- $10,375
Cash invested: $33,600 (down + closing). Projections, not guarantees.
Landlord ↔ Tenant lean methodology
- Overall (STATE)
- 90 Strongly Landlord-Friendly
- State Indiana
- 90 Strongly Landlord-Friendly · R+11
- County
- — inherits STATE
- City
- — inherits STATE
ZIP-level market 46303
- Active inventory
- 269
- Price-to-rent
- 7.0×
Monthly cashflow live
- Estimated rent
- $1,426 medium interval (Pro) →
- Mortgage (P&I)
- −$629
- Tax from tax record
- −$26 /mo · $311/yr
- Insurance
- −$50
- HOA
- −$0
- Vacancy / Maint / Mgmt
- −$300
- Net cashflow
- $422
Break-even live
Sensitivity live
| Price | -10% $490 | -5% $456 | +0% $422 | +5% $388 | +10% $354 |
|---|---|---|---|---|---|
| Rent | -10% $309 | -5% $365 | +0% $422 | +5% $478 | +10% $534 |
| Rate | -1.0pp $482 | -0.5pp $452 | base $422 | +0.5pp $391 | +1.0pp $359 |
UW: 25.0% down · 7.5% · 30yr · 1.5% tax · 5.0% vac · 8.0% maint · 8.0% mgmt
Financing live
Cash to close
- Down payment
- $30,000
- Closing costs
- $3,600
- Reserves months
- —
- Total cash needed
- —
Loan-product check · same deal, 3 products live
Conventional
25% down · 7.5% · 30yr
- Down + closing
- —
- Monthly P&I
- —
- Monthly cashflow
- —
- DSCR
- —
- Eligible?
- —
Personal DTI + credit; lowest rate.
DSCR
20% down · 8.5% · 30yr
- Down + closing
- —
- Monthly P&I
- —
- Monthly cashflow
- —
- DSCR
- —
- Eligible?
- —
No personal income docs; deal must DSCR.
Hard money
10% down · 12.0% · 12mo
- Down + closing
- —
- Monthly P&I
- —
- Monthly cashflow
- —
- DSCR
- —
- Eligible?
- —
Short-term bridge; refi at stabilization.
Listing history 5 events
-
2026-06-17status $120,000 Pending 4 DOM
-
2026-06-16days on market $120,000 Active 4 DOM
-
2026-06-15days on market $120,000 Active 3 DOM
-
2026-06-13remarks 681-char remark
-
2026-06-13$120,000 Active 1 DOM
ⓘ Source: listings_history table (triggers on properties + properties_extension) + one-shot
backfill from property_details.listing_events for pre-trigger history.
Tax reassessment forecast IN · Partial reset (capped growth)
- Current annual tax
- $311 · $26/mo
- Projected year-2 tax
- $666 · $55/mo
- Expected delta
- +$354/yr (+$30/mo · 113.8%)
ⓘ Screening estimate from a state-policy table — verify with the county assessor before closing.
Climate risk First Street
- Flood 1/10 Low FEMA zone X (unshaded) · 0% chance over 30 yrs
- Wildfire 2/10 Low
- Heat 2/10 Low 7 d/yr ≥100°F today · 16 d/yr by 30 yrs out
- Wind 2/10 Low 0% chance of damaging wind over 30 yrs
- Air quality 2/10 Low 1 unhealthy d/yr today · 1 by 30 yrs out
Nearby sold comps map
Loading sold comps map…
Walkable amenities ~0.75 mi
Loading nearby amenities…
Taxation est. · year 1
- Rental income
- $17,117
- − Mortgage interest
- −$6,722
- − Property taxes
- −$311
- − Insurance
- −$600
- − Repairs & maintenance
- −$1,369
- − Management
- −$1,369
- − Depreciation
- −$3,491
- Taxable income
- $3,254
- Est. tax owed @ 24.0%
- −$781
- After-tax cash flow
- $4,278/yr
For passive investors: Depreciation is non-cash, so a rental often shows a tax loss while cash-flowing — sheltering income. Rental losses are passive: they offset passive income freely, and up to $25,000/yr can offset ordinary (W-2) income if you actively participate and your MAGI is under $100k (phasing out to $0 by $150k); unused losses carry forward. On sale, claimed depreciation is recaptured at up to 25%, and gains may owe capital-gains tax (a 1031 exchange can defer both). Figures are a year-1 estimate at your 24.0% rate — not tax advice; consult a CPA.
Schools (NCES district)
- District
- Crown Point Community School Corporation
- NCES district ID
- 1802490
- Math proficiency
- 51% ▼ -9.00%
- Reading proficiency
- 61% ▼ -8.00%
- Median HH income
- $69,148
- Composite
- 49.55/100
- National rank
- #1990
- State rank
- #23 of 301 in IN
Livability — Cedar Lake
- Score
- 65/100
- State rank
- #354
- US rank
- #13482
Category grades
Schools grade is shown separately in the Schools card above.
Census & demographics
- Census place
- Cedar Lake, IN
- County
- Lake County · 422,878 people
- City population
- 17,680
- Metro
- Chicago-Naperville-Elgin, IL-IN-WI
- Population (ZIP)
- 17,680
- Household income
- $84,211
- Rent vs Own
- Severe rent burden
- 84.0
Population outlook (Lake County) Hauer SSP2
- Today (2025)
- 484,026 people
- By 2030
- 478,091 · -1.2%
- By 2040
- 462,974 · -4.3%
- By 2050
- 449,894 · -7.1%
- By 2075
- 436,169 · -9.9%
- By 2100
- 426,607 · -11.9%
Race, ethnicity, and origin ACS 2023
- Neighborhood character
- Predominantly White (88%)
- Race & ethnicity
- White 88% Hispanic / Latino 8% Two or more races 7%
- Hispanic origin (detail)
- Mexican 7%
- Common ancestry
- Romanian 16% Iranian 9% Italian 1%
- Foreign-born
- 2% · China
- Languages at home
- 95% English-only · Other Indo-European 2% Russian/Polish/Slavic 2% Spanish 2%
Political lean MEDSL · Lake
- 2024 margin
- Lean D (+5.6) · D 52.1% · R 46.5% · Other 1.5%
- 2008→2024 swing
- -28.6pp toward R · 2008: 34.3pp · 2024: 5.6pp
- All cycles
- 2024: D+5.6 2020: D+15.1 2016: D+20.6 2012: D+31.0 2008: D+34.3
Not yet ingested
- Civics
- —
Market trends
- HPI YoY
- ▼ -182.94%
- Current HPI
- 267.4434
- Rent YoY
- —
- Metro
- Chicago-Naperville-Elgin, IL-IN-WI
- State GDP YoY
- ▲ 2.90%
- F500 in state
- 18
Industry mix (Fortune 500 HQ in IN)
| Industry | F500 HQs | Revenue |
|---|---|---|
| Industrial Machinery | 2 | $37B |
|
||
| Healthcare | 1 | $177B |
|
||
| Pharmaceuticals | 1 | $45B |
|
||
| Metals / Steel | 1 | $18B |
|
||
| Agriculture | 1 | $17B |
|
||
| Packaging | 1 | $12B |
|
||
Price history
+76.5% since first listed8 events — show timeline
- 2026-06-12 Listed $120,000 NIRA MLS as Distributed by MLS Grid
- 2015-07-06 Sold (MLS) $32,000 NIRA MLS as Distributed by MLS Grid
- 2015-03-05 Listed $34,999 NIRA MLS as Distributed by MLS Grid
- 2015-01-21 Sold (Public Records) $8,502 Public Records
- 2003-06-18 Listing Removed — NIRA MLS as Distributed by MLS Grid
- 2002-09-12 Listed $68,000 NIRA MLS as Distributed by MLS Grid
- 2002-07-01 Listing Removed — NIRA MLS as Distributed by MLS Grid
- 2001-12-22 Listed $68,000 NIRA MLS as Distributed by MLS Grid
Property tax history
+2.4%/yrLatest (2024): $311 · +4.4% YoY. Source: county tax records.
Cash-flow waterfall
monthlySold comps — $/sqft
last 12 mo · ≤1 miLoading sold comps…