 🏷️ Likely Rental
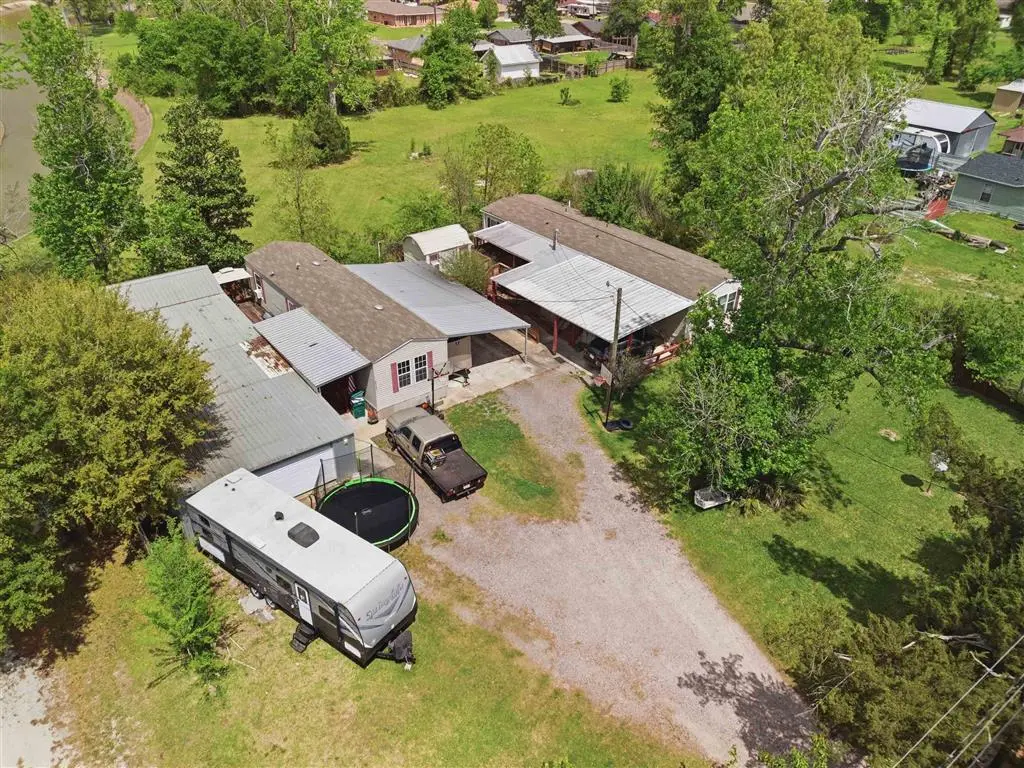
2137 Cedar Ln Ln · Sulphur, LA
Flood risk 7/10 · Major
- FEMA flood zone
- X (shaded)
- Chance of flooding over 30 yrs
- 0.97%
- Est. flood insurance / yr
- $507 – $1,088
Fire risk 3/10 · Minor
- Est. fire insurance / yr
- $1,269 – $2,357
Heat risk 9/10 · Severe
- Hot days now (above 109°F)
- 7 days/yr
- Hot days in 30 yrs
- 23 days/yr
Wind risk 9/10 · Severe
- Chance of severe wind over 30 yrs
- 99.0%
Air-quality risk 2/10 · Minimal
- Unhealthy air days now
- 1 days/yr
- Unhealthy air days in 30 yrs
- 1 days/yr
Risk factors via First Street. Map © Google.
Why this score? — see what drove the B+ grade
The composite is a weighted blend of 9 inputs, each scored 0–100. Each bar is that input's sub-score; the figure is the points it added to the 100-point composite (weight × sub-score).
- Cash flow +30.0/30.0
- ARV discount +15.0/15.0
- 1% rule +10.0/10.0
- DSCR +10.0/10.0
- Rent growth +4.4/5.0
- Livability +3.6/5.0
- Schools +3.1/10.0
- Condition / age +2.5/5.0
- Appreciation +0.0/10.0
$120,000
🖨 Deal sheet 📄 Offer letter ✓ Due diligence
Listing remarks MLS
INCOME PRODUCING PROPERTIES IN MAPLEWOOD Tucked away on a quiet dead-end street, 2137 and 2139 Cedar Lane offer immediate cash flow with two occupied manufactured homes and a versatile workshop, all situated on approximately 0.43 acres with public water and sewer. The 18x64, 2 bedroom, 2 bath home is currently leased for $850/month, while the 14x52, 2 bedroom, 1 bath home produces $900/month and includes access to the workshop. Tenants have expressed interest in remaining, creating a seamless transition for the next owner. With existing income in place and room for future improvements, this property offers flexibility for investors or owner-occupants seeking to generate income while holding for long-term potential. Conveniently located near Sulphur with access toward surrounding areas, this is an opportunity to step into an income-producing property from day one. Buyer to verify flood zone, seller does not have flood insurance. Measurements are more/less.
Key facts
- Versatile workshop
- 0.44 acre lot
- Built 2008
Tags
Neighborhood map
What this means for you Summary
Snapshot
- This is a 2-bed/1.0-bath single-family listed at $120k.
Deal economics
- At list price, monthly cash flow is $667 ($8k/yr) — positive.
- The deal already cash-flows at list — no discount required.
- Meets the 1% rule at list price ($2k rent vs $120k).
- Recommended offer: $113k (6.0% below list) — sets the bar for market timing.
- Cap rate 13.6% vs local median 8.8% in Sulphur — top-decile yield for the area; either an underpriced asset or a hidden risk that comps aren't pricing in. Stress-test before assuming the spread holds.
Location & tenants
- Location reads 71/100 on livability (#48 in LA) — a middle-class / working-renter tenant base. Strengths: cost of living A+, housing A+, schools A; Watch: crime D-, amenities F, commute F.
- Calcasieu Parish (other): math 30% / reading 44% proficiency, ranked #29 of 98 in LA (top 30%) — families likely to look elsewhere, expect single-tenant / working-renter base with shorter leases.
- Market conditions: Rents rising fast (+7.7%/yr); 291 active listings in the ZIP; 5 comparable units currently listed for rent nearby; rentals lingering (median 44d on market — plan ~5-8 weeks vacancy on turnover, expect pricing pressure); 80% of comp listings sitting > 30 days — soft ceiling on asking rent; 1,298 units permitted in Calcasieu Parish in 2024 (526 in 5+ unit buildings).
- This rent runs 35% of the median local income ($65k/yr) — at the standard rent-burdened threshold; future hikes will face affordability resistance.
Forward outlook
- Local home prices are declining (-3.0%/yr); year-one equity from $830 of loan paydown is wiped out by about $4k of value loss. Plan a longer hold.
- Calcasieu County population projected at +11% by 2050 — modest demand growth; plan on rents tracking national, not racing it.
- At projected returns (-3.0% appreciation + 7.7% rent growth), your $34k cash investment doubles in ~5 years — after that, you're playing with house money.
Negotiation context
- It's been on market 80 days — a 6% lower offer ($113k) is reasonable based on typical stale-listing flexibility.
- 2 sale attempts since 7y ago with the ask held roughly flat each time — persistent listings suggest the price (not the market) is what's stuck; bring a comps-based counter.
Risks & watch-outs
- Watch-outs: flood insurance adds $66/mo.
- Climate carrying-cost: major flood risk; severe wind risk, 99% chance of damaging wind over 30y; extreme-heat days projected 7→23/yr by 2055 (HVAC capex compounding) — expect insurance premiums to compound above CPI over the hold.
Questions for the listing agent
- It's been on market 80 days. Have you received any prior offers? Is the seller open to a 6% concession, seller financing, or rate buy-down credit?
- What's the actual annual flood-insurance premium (NFIP or private), and is the property in a SFHA with mandatory coverage?
- Why hasn't it sold? Are there any deal-killer items the seller is aware of (foundation, flood, title, zoning, code violations)?
- Is there a deadline driving the sale (1031 exchange, divorce, estate, relocation)? That informs how much negotiation room exists.
- Schools are A-rated — typically a magnet for longer-tenancy family renters. What's the average tenant stay here, and is there a school-zone premium baked into asking?
- Crime grade is D in this area — have there been break-ins, vandalism, or insurance claims at this property in the last 3 years? What carrier currently insures it and at what premium?
- What's the average days-on-market for RENTAL listings here right now (not sales)? A rising rental-DOM trend means longer vacancies and softer asking-rent achievability than the comps imply.
- What's the recent tenant-quality profile in this submarket — average credit score on applications, eviction rate, late-payment / NSF rate, and stable-employment percentage? A property-management company in the area should have these aggregated.
- How much new for-sale + rental construction is in the pipeline within 1–3 miles? Heavy new supply typically softens prices + rents 12–24 months out; constrained supply supports both.
Investment metrics
- 1% rule
- 1.57% ✓
- Cap rate
- 13.62%
- Cash-on-cash
- 26.18%
- DSCR
- 2.17
- GRM
- 5.3
CMA / ARV
- ARV (on-the-fly)
- $223,720
- Comps found
- 8
Show comp detail 8 sales within ~0.75 mi
| Address | Dist | Beds/Ba | Sqft | Sold | Price | $/sf | Match |
|---|---|---|---|---|---|---|---|
| 2112 Division Rd | 0.19mi | 3/2.0 (+1) | 1,859 (-1%) | 19mo | $169,900 | $91 | 64 |
| 2117 Aubrianna Ln | 0.21mi | 3/2.0 (+1) | 1,820 (-3%) | 14mo | $250,000 | $137 | 64 |
| 2200 Tammy St | 0.14mi | 3/2.0 (+1) | 1,700 (-10%) | 9mo | $191,000 | $112 | 61 |
| 2212 Tammy St | 0.17mi | 3/2.0 (+1) | 1,613 (-14%) | 13mo | $192,000 | $119 | 48 |
| 2514 Roxton St | 0.40mi | 3/2.0 (+1) | 1,770 (-6%) | 19mo | $215,000 | $121 | 47 |
| 1518 Shasta St | 0.39mi | 3/2.0 (+1) | 1,700 (-10%) | 23mo | $185,000 | $109 | 38 |
| 1515 Camelia Ln | 0.74mi | 3/2.0 (+1) | 1,776 (-6%) | 21mo | $224,500 | $126 | 30 |
| 2642 Saint Joseph St | 0.66mi | 3/2.0 (+1) | 1,606 (-15%) | 19mo | $155,000 | $97 | 20 |
Match score weights: distance 35% · size 25% · config 20% · recency 20%. Top-matched comps best support the ARV.
Projected returns pro-forma
-3.0% appreciation · 7.65% rent growth · sell at horizon
- IRR
- 22.1%
- Equity multiple
- 1.96×
- Total profit
- $32,285
- Equity at exit
- $17,892
- IRR
- 33.1%
- Equity multiple
- 4.71×
- Total profit
- $124,653
- Equity at exit
- $10,375
Cash invested: $33,600 (down + closing). Projections, not guarantees.
Landlord ↔ Tenant lean methodology
- Overall (STATE)
- 90 Strongly Landlord-Friendly
- State Louisiana
- 90 Strongly Landlord-Friendly · R+12
- County
- — inherits STATE
- City
- — inherits STATE
ZIP-level market 70663
- Rents YoY
- 7.7%
- Active inventory
- 291
- Price-to-rent
- 5.3×
Monthly cashflow live
- Estimated rent
- $1,887 high interval (Pro) →
- Mortgage (P&I)
- −$629
- Tax from tax record
- −$78 /mo · $942/yr
- Insurance
- −$50
- Flood insurance flood zone
- −$66 /mo · $798/yr
- HOA
- −$0
- Vacancy / Maint / Mgmt
- −$396
- Net cashflow
- $667
Break-even live
UW: 25.0% down · 7.5% · 30yr · 1.5% tax · 5.0% vac · 8.0% maint · 8.0% mgmt
Financing live
Cash to close
- Down payment
- $30,000
- Closing costs
- $3,600
- Reserves months
- —
- Total cash needed
- —
Loan-product check · same deal, 3 products live
Conventional
25% down · 7.5% · 30yr
- Down + closing
- —
- Monthly P&I
- —
- Monthly cashflow
- —
- DSCR
- —
- Eligible?
- —
Personal DTI + credit; lowest rate.
DSCR
20% down · 8.5% · 30yr
- Down + closing
- —
- Monthly P&I
- —
- Monthly cashflow
- —
- DSCR
- —
- Eligible?
- —
No personal income docs; deal must DSCR.
Hard money
10% down · 12.0% · 12mo
- Down + closing
- —
- Monthly P&I
- —
- Monthly cashflow
- —
- DSCR
- —
- Eligible?
- —
Short-term bridge; refi at stabilization.
Rent comps 5 comps
| Address | Beds | Baths | Sqft | Rent | $/sqft | DOM | Units | Dist |
|---|---|---|---|---|---|---|---|---|
| 2310 Timberlane Dr Sulphur, LA | 2.0 | 2.0 | 1350 | $2,450 | $1.81 | 43d | 1 | 0.14mi |
| 1917 Linda Ave Sulphur, LA | 3.0 | 2.0 | 1288 | $1,890 | $1.47 | 43d | 1 | 0.45mi |
| 608 Shady Ln Sulphur, LA | 3.0 | 3.0 | 1903 | $2,200 | $1.16 | 43d | 1 | 0.75mi |
| 1141 Mosswood Dr Sulphur, LA | 2.0–3.0 | 2.0–3.5 | 1332 | $1,295 | $0.97 | 43d | 1 | 1.32mi |
| 309 W Mimosa Dr Sulphur, LA | 3.0 | 2.0 | 1310 | $1,500 | $1.15 | 13d | 1 | 1.41mi |
Listing history 20 events
-
2026-06-19days on market $120,000 Active 80 DOM
-
2026-06-18days on market $120,000 Active 79 DOM
-
2026-06-17days on market $120,000 Active 78 DOM
-
2026-06-16days on market $120,000 Active 77 DOM
-
2026-06-15days on market $120,000 Active 76 DOM
-
2026-06-14days on market $120,000 Active 74 DOM
-
2026-06-13days on market $120,000 Active 73 DOM
-
2026-06-10days on market $120,000 Active 71 DOM
-
2026-06-09days on market $120,000 Active 70 DOM
-
2026-06-08days on market $120,000 Active 69 DOM
-
2026-06-07days on market $120,000 Active 68 DOM
-
2026-06-05days on market $120,000 Active 65 DOM
-
2026-06-02days on market $120,000 Active 63 DOM
-
2026-06-01days on market $120,000 Active 62 DOM
-
2026-05-31days on market $120,000 Active 61 DOM
-
2026-05-30days on market $120,000 Active 60 DOM
-
2026-04-01$120,000 Active 970-char remark
Show marketing remark (970 chars)
INCOME PRODUCING PROPERTIES IN MAPLEWOOD Tucked away on a quiet dead-end street, 2137 and 2139 Cedar Lane offer immediate cash flow with two occupied manufactured homes and a versatile workshop, all situated on approximately 0.43 acres with public water and sewer. The 18x64, 2 bedroom, 2 bath home is currently leased for $850/month, while the 14x52, 2 bedroom, 1 bath home produces $900/month and includes access to the workshop. Tenants have expressed interest in remaining, creating a seamless transition for the next owner. With existing income in place and room for future improvements, this property offers flexibility for investors or owner-occupants seeking to generate income while holding for long-term potential. Conveniently located near Sulphur with access toward surrounding areas, this is an opportunity to step into an income-producing property from day one. Buyer to verify flood zone, seller does not have flood insurance. Measurements are more/less.
-
2023-08-29historical
-
2019-07-26soldstatus 299-char remark
Show marketing remark (299 chars)
Excellent investment property. Very nice 18' x 64' 2 Bed 2 Bath Mobile Home on shaded lot. Large covered deck at entrance of home. Several out buildings including large metal workshop and large climate controlled temporary building. Also includes 14' x 52' 2 Bed 1 Bath Mobile Home on same property.
-
2019-06-20$117,500 299-char remark
Show marketing remark (299 chars)
Excellent investment property. Very nice 18' x 64' 2 Bed 2 Bath Mobile Home on shaded lot. Large covered deck at entrance of home. Several out buildings including large metal workshop and large climate controlled temporary building. Also includes 14' x 52' 2 Bed 1 Bath Mobile Home on same property.
ⓘ Source: listings_history table (triggers on properties + properties_extension) + one-shot
backfill from property_details.listing_events for pre-trigger history.
Tax reassessment forecast LA · Resets to sale price
- Current annual tax
- $942 · $78/mo
- Projected year-2 tax
- $942 · $78/mo
- Expected delta
- $0/yr ($0/mo · 0.0%)
ⓘ Screening estimate from a state-policy table — verify with the county assessor before closing.
Climate risk First Street
- Flood 7/10 Severe FEMA zone X (shaded) · 97% chance over 30 yrs
- Wildfire 3/10 Moderate
- Heat 9/10 Extreme 7 d/yr ≥109°F today · 23 d/yr by 30 yrs out
- Wind 9/10 Extreme 99% chance of damaging wind over 30 yrs
- Air quality 2/10 Low 1 unhealthy d/yr today · 1 by 30 yrs out
Nearby sold comps map
Loading sold comps map…
Walkable amenities ~0.75 mi
Loading nearby amenities…
Taxation est. · year 1
- Rental income
- $22,647
- − Mortgage interest
- −$6,722
- − Property taxes
- −$942
- − Insurance
- −$1,398
- − Repairs & maintenance
- −$1,812
- − Management
- −$1,812
- − Depreciation
- −$3,491
- Taxable income
- $6,471
- Est. tax owed @ 24.0%
- −$1,553
- After-tax cash flow
- $6,447/yr
For passive investors: Depreciation is non-cash, so a rental often shows a tax loss while cash-flowing — sheltering income. Rental losses are passive: they offset passive income freely, and up to $25,000/yr can offset ordinary (W-2) income if you actively participate and your MAGI is under $100k (phasing out to $0 by $150k); unused losses carry forward. On sale, claimed depreciation is recaptured at up to 25%, and gains may owe capital-gains tax (a 1031 exchange can defer both). Figures are a year-1 estimate at your 24.0% rate — not tax advice; consult a CPA.
Schools (NCES district)
- District
- Calcasieu Parish
- NCES district ID
- 2200330
- Math proficiency
- 30% ▼ -39.00%
- Reading proficiency
- 44% ▼ -33.00%
- Median HH income
- $44,700
- Composite
- 31.45/100
- National rank
- #5979
- State rank
- #29 of 98 in LA
Livability — Sulphur
- Score
- 71/100
- State rank
- #48
- US rank
- #7164
Category grades
Schools grade is shown separately in the Schools card above.
Census & demographics
- Census place
- Sulphur, LA
- County
- Calcasieu Parish · 170,889 people
- City population
- 27,799
- Metro
- Lake Charles, LA
- Population (ZIP)
- 27,799
- Household income
- $64,707
- Rent vs Own
- Severe rent burden
- 197.0
Population outlook (Calcasieu County) Hauer SSP2
- Today (2025)
- 212,179 people
- By 2030
- 218,199 · +2.8%
- By 2040
- 228,486 · +7.7%
- By 2050
- 236,208 · +11.3%
- By 2075
- 251,696 · +18.6%
- By 2100
- 247,848 · +16.8%
Race, ethnicity, and origin ACS 2023
- Neighborhood character
- Predominantly White (82%)
- Race & ethnicity
- White 82% Black 8% Hispanic / Latino 5% Two or more races 4%
- Common ancestry
- Lithuanian 13% Slovak 2% Scandinavian 1%
- Foreign-born
- 3% · Canada, Vietnam
- Languages at home
- 94% English-only · Spanish 2% French/Haitian/Cajun 2% Other Indo-European 1%
Political lean MEDSL · Calcasieu
- 2024 margin
- Solid R (+39.6) · D 29.5% · R 69.0% · Other 1.5%
- 2008→2024 swing
- -15.0pp toward R · 2008: -24.6pp · 2024: -39.6pp
- All cycles
- 2024: R+39.6 2020: R+35.2 2016: R+33.3 2012: R+28.7 2008: R+24.6
Not yet ingested
- Civics
- —
Market trends
- HPI YoY
- ▼ -104.29%
- Current HPI
- 100.0895
- Rent YoY
- ▲ 7.65%
- Metro
- Lake Charles, LA
- State GDP YoY
- ▲ 3.29%
- F500 in state
- 10
Industry mix (Fortune 500 HQ in LA)
| Industry | F500 HQs | Revenue |
|---|---|---|
| Telecommunications | 2 | $23B |
|
||
| Utilities | 1 | $12B |
|
||
| Wholesale / Distribution | 1 | $5B |
|
||
| Advertising | 1 | $2B |
|
||
Price history
+2.1% since first listed4 events — show timeline
- 2026-04-01 Listed $120,000 SWLAR
- 2023-08-29 Rental Removed — APPFOLIO
- 2019-07-26 Sold (MLS) — SWLAR
- 2019-06-20 Listed $117,500 SWLAR
Property tax history
+2.3%/yrLatest (2025): $942 · +0.8% YoY. Source: county tax records.
Cash-flow waterfall
monthlySold comps — $/sqft
last 12 mo · ≤1 miLoading sold comps…