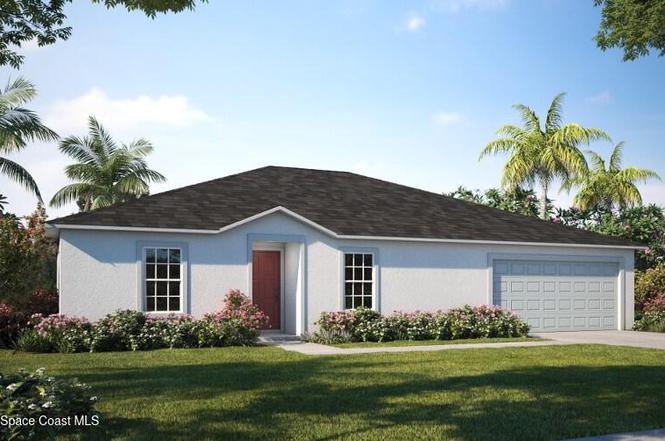
1154 Sapphire St SE · Palm Bay, FL
Flood risk 6/10 · Moderate
- FEMA flood zone
- X (unshaded)
- Chance of flooding over 30 yrs
- 0.68%
- Est. flood insurance / yr
- $507 – $1,088
Fire risk 1/10 · Minimal
- Est. fire insurance / yr
- $947 – $1,759
Heat risk 9/10 · Severe
- Hot days now (above 106°F)
- 7 days/yr
- Hot days in 30 yrs
- 22 days/yr
Wind risk 10/10 · Severe
- Chance of severe wind over 30 yrs
- 99.0%
Air-quality risk 1/10 · Minimal
- Unhealthy air days now
- 0 days/yr
- Unhealthy air days in 30 yrs
- 0 days/yr
Risk factors via First Street. Map © Google.
Why this score? — see what drove the D grade
The composite is a weighted blend of 9 inputs, each scored 0–100. Each bar is that input's sub-score; the figure is the points it added to the 100-point composite (weight × sub-score).
- Appreciation +10.0/10.0
- Cash flow +7.7/30.0
- ARV discount +7.5/15.0
- Schools +4.7/10.0
- Livability +3.6/5.0
- Rent growth +3.4/5.0
- Condition / age +2.5/5.0
- 1% rule +2.3/10.0
- DSCR +1.8/10.0
$309,990
🖨 Deal sheet (PDF) 📄 Offer letter ✓ Due diligence
Listing remarks
Under Construction. Discover Palm Bay, a lively city where suburban convenience meets natural beauty. Nestled along the Indian River and just minutes from the Atlantic Ocean, residents can enjoy boating, fishing, hiking, and explore numerous parks and green spaces, all supporting an active, well-rounded lifestyle under Florida's sunshine. Centrally located, The Iris showcases a thoughtful blend of style, functionality, and welcoming outdoor living spaces. Step through the protected front entry into a thoughtfully designed floorplan, where a flex room flanks the foyer, ready to serve as a dining room, home office, or any space to fit your lifestyle. The primary suite is tucked away in a spli
Key facts
- Split-bedroom layout
- Dual countertops
- Flex room
Tags
Neighborhood map
What this means for you Summary
Snapshot
- This is a 4-bed/2.0-bath land listed at $310k.
Deal economics
- At list price, monthly cash flow is $-363 ($-4k/yr) — negative.
- To cash-flow at today's rent, offer at most $257k (16.9% below list).
- To meet the 1% rule (rent ≥ 1% of price), the offer needs to be $225k (27.3% below list).
- Recommended offer: $225k (27.3% below list) — sets the bar for 1% rule.
Location & tenants
- Location reads 72/100 on livability (#366 in FL) — a middle-class / working-renter tenant base. Strengths: cost of living A+, housing A+; Watch: employment D+, amenities F, health & safety D-.
- Brevard (suburban): math 53% / reading 57% proficiency, ranked #19 of 73 in FL (top 26%) — acceptable for families but not a draw, mixed tenant base, ~2y average lease.
- Zoned schools: Columbia Elementary School (math 52% / reading 47%, grade D, #1,088 of 2,144 statewide, top 53%, 506 students, 68% FRL); Southwest Middle School (math 40% / reading 39%, grade F, #373 of 571 statewide, top 66%, 920 students, 58% FRL); Bayside High School (math 27% / reading 40%, grade F, #400 of 667 statewide, top 61%, 1,854 students, 51% FRL) — zoned schools average 59% FRL vs 43% district-wide (16 pts higher); higher-poverty schools than district average — tighter screening recommended.
- Zoned-school proficiency averages 41% at this address vs 55% district-wide (-14 pts) — the specific schools serving this property underperform the Brevard average; the district grade overstates school quality for this exact location.
- Market conditions: Rents rising (+3.7%/yr); 1111 active listings in the ZIP; 20 comparable units currently listed for rent nearby; rentals at typical pace (median 20d on market — plan ~3-4 weeks tenant-placement turnaround); solid renter incomes; 4,602 units permitted in Brevard County in 2024 (702 in 5+ unit buildings).
- This rent runs 34% of the median local income ($80k/yr) — at the standard rent-burdened threshold; future hikes will face affordability resistance.
Forward outlook
- In year one you build about $33k of equity ($2k loan paydown + $31k appreciation (10.0% local appreciation)).
- Brevard County population projected at +15% by 2050 — modest demand growth; plan on rents tracking national, not racing it.
- By year 2, paydown + projected appreciation supports a ~$53k cash-out refi (75% LTV) — recoverable capital for the next deal without selling this one.
Negotiation context
- It's been on market 136 days — a 12% lower offer ($273k) is reasonable based on typical stale-listing flexibility.
Risks & watch-outs
- Climate carrying-cost: major flood risk; severe wind risk, 99% chance of damaging wind over 30y; extreme-heat days projected 7→22/yr by 2055 (HVAC capex compounding) — expect insurance premiums to compound above CPI over the hold.
Questions for the listing agent
- What do current leases actually rent for vs. the listed asking? Can we see a recent rent roll and the last 12 months of T-12 income?
- It's been on market 136 days. Have you received any prior offers? Is the seller open to a 27% concession, seller financing, or rate buy-down credit?
- Why hasn't it sold? Are there any deal-killer items the seller is aware of (foundation, flood, title, zoning, code violations)?
- Is there a deadline driving the sale (1031 exchange, divorce, estate, relocation)? That informs how much negotiation room exists.
- The area grade is low — what's the realistic commute time and amenity access for the typical tenant pool here? Any planned neighborhood developments (good or bad) we should know about?
- What's the average days-on-market for RENTAL listings here right now (not sales)? A rising rental-DOM trend means longer vacancies and softer asking-rent achievability than the comps imply.
- What's the recent tenant-quality profile in this submarket — average credit score on applications, eviction rate, late-payment / NSF rate, and stable-employment percentage? A property-management company in the area should have these aggregated.
- How much new for-sale + rental construction is in the pipeline within 1–3 miles? Heavy new supply typically softens prices + rents 12–24 months out; constrained supply supports both.
Investment metrics
- 1% rule
- 0.73% ✗
- Cap rate
- 4.89%
- Cash-on-cash
- -5.02%
- DSCR
- 0.78
- GRM
- 11.5
CMA / ARV
No comps found within radius.
Projected returns pro-forma
10.0% appreciation · 3.67% rent growth · sell at horizon
- IRR
- 20.9%
- Equity multiple
- 2.70×
- Total profit
- $147,280
- Equity at exit
- $279,264
- IRR
- 19.1%
- Equity multiple
- 6.24×
- Total profit
- $455,144
- Equity at exit
- $602,242
Cash invested: $86,797 (down + closing). Projections, not guarantees.
Landlord ↔ Tenant lean methodology
- Overall (STATE)
- 87 Strongly Landlord-Friendly
- State Florida
- 87 Strongly Landlord-Friendly · R+3
- County
- — inherits STATE
- City
- — inherits STATE
ZIP-level market 32909
- Home prices YoY
- 6.0%
- Rents YoY
- 3.7%
- Active inventory
- 1111
- Price-to-rent
- 11.5×
Monthly cashflow live
- Estimated rent
- $2,252 high interval (Pro) →
- Mortgage (P&I)
- −$1,626
- Tax est. 1.5%
- −$387 /mo · $4,650/yr
- Insurance
- −$129
- HOA
- −$0
- Vacancy / Maint / Mgmt
- −$473
- Net cashflow
- $-363
Break-even live
Sensitivity live
| Price | -10% $-149 | -5% $-256 | +0% $-363 | +5% $-470 | +10% $-577 |
|---|---|---|---|---|---|
| Rent | -10% $-541 | -5% $-452 | +0% $-363 | +5% $-274 | +10% $-185 |
| Rate | -1.0pp $-207 | -0.5pp $-284 | base $-363 | +0.5pp $-443 | +1.0pp $-525 |
UW: 25.0% down · 7.5% · 30yr · 1.5% tax · 5.0% vac · 8.0% maint · 8.0% mgmt
Financing live
Cash to close
- Down payment
- $77,498
- Closing costs
- $9,300
- Reserves months
- —
- Total cash needed
- —
Loan-product check · same deal, 3 products live
Conventional
25% down · 7.5% · 30yr
- Down + closing
- —
- Monthly P&I
- —
- Monthly cashflow
- —
- DSCR
- —
- Eligible?
- —
Personal DTI + credit; lowest rate.
DSCR
20% down · 8.5% · 30yr
- Down + closing
- —
- Monthly P&I
- —
- Monthly cashflow
- —
- DSCR
- —
- Eligible?
- —
No personal income docs; deal must DSCR.
Hard money
10% down · 12.0% · 12mo
- Down + closing
- —
- Monthly P&I
- —
- Monthly cashflow
- —
- DSCR
- —
- Eligible?
- —
Short-term bridge; refi at stabilization.
Rent comps 20 comps
| Address | Beds | Baths | Sqft | Rent | $/sqft | DOM | Units | Dist |
|---|---|---|---|---|---|---|---|---|
| 1150 Tiger St SE Palm Bay, FL | 3.0 | 2.0 | 1690 | $1,950 | $1.15 | 15d | 1 | 0.19mi |
| 1150 Raoul St SE Palm Bay, FL | 4.0 | 2.0 | 1787 | $2,300 | $1.29 | 24d | 1 | 0.41mi |
| 1517 Wacker Ave SE Palm Bay, FL | 4.0 | 2.0 | 1775 | $2,200 | $1.24 | 24d | 1 | 0.44mi |
| 2910 Emerson Dr SE Palm Bay, FL | 3.0 | 2.0 | 1700 | $1,950 | $1.15 | 15d | 1 | 0.73mi |
| 1530 Paley Cir SE Palm Bay, FL | 4.0 | 2.0 | 1842 | $2,095 | $1.14 | 15d | 1 | 0.80mi |
| 1625 Waneta St SE Palm Bay, FL | 3.0 | 2.0 | 1631 | $2,100 | $1.29 | 19d | 1 | 0.85mi |
| 818 Seven Gables Cir SE Palm Bay, FL | 3.0 | 2.0 | 1490 | $1,795 | $1.20 | 24d | 1 | 0.94mi |
| 822 Seven Gables Cir SE Palm Bay, FL | 3.0 | 2.0 | 1474 | $1,835 | $1.24 | 24d | 1 | 0.95mi |
| 1210 Vandalia Ave SE Palm Bay, FL | 4.0 | 2.0 | 1833 | $2,050 | $1.12 | 15d | 1 | 1.05mi |
| 978 Remington Green Dr SE Palm Bay, FL | 4.0 | 2.0 | 1830 | $2,200 | $1.20 | 24d | 1 | 1.08mi |
| 1290 Sail Ct SE Palm Bay, FL | 3.0 | 2.0 | 1509 | $1,945 | $1.29 | 24d | 1 | 1.19mi |
| 1255 Wadsworth St SE Unit 1255 Palm Bay, FL | 3.0 | 3.0 | 1747 | $2,350 | $1.35 | 19d | 1 | 1.20mi |
| 2250 Chinaberry Cir SE Palm Bay, FL | 3.0 | 2.0 | 1669 | $1,995 | $1.20 | 24d | 1 | 1.23mi |
| 2242 Mantilla Ave SE Palm Bay, FL | 5.0 | 2.0 | 2516 | $2,176 | $0.86 | 21d | 1 | 1.29mi |
| 1454 Graves St SE Palm Bay, FL | 3.0 | 2.0 | 1621 | $2,100 | $1.30 | 15d | 1 | 1.29mi |
| 1643 Talavera St SE Palm Bay, FL | 4.0 | 2.0 | 1833 | $1,861 | $1.02 | 19d | 1 | 1.30mi |
| 1224 Buffing Cir SE Palm Bay, FL | 4.0 | 2.0 | 2233 | $2,395 | $1.07 | 15d | 1 | 1.38mi |
| 1165 Rabbit St SE Palm Bay, FL | 3.0 | 2.0 | 1994 | $1,895 | $0.95 | 19d | 1 | 1.39mi |
| 1677 Lizette St SE Unit A Palm Bay, FL | 3.0 | 2.0 | 2080 | $1,900 | $0.91 | 15d | 1 | 1.47mi |
| 1660 Lizette St SE Unit 1 Palm Bay, FL | 4.0 | 2.0 | 1736 | $2,199 | $1.27 | 24d | 1 | 1.48mi |
Listing history 7 events
-
2026-02-11soldstatus $377,467
-
2026-01-12status Pending
-
2025-12-05price $309,990
-
2025-10-17price $312,990
-
2025-08-29$317,990 Active
-
2025-02-18soldstatus $40,000
-
1993-06-07soldstatus $6,200
ⓘ Source: listings_history table (triggers on properties + properties_extension) + one-shot
backfill from property_details.listing_events for pre-trigger history.
Climate risk First Street
- Flood 6/10 Major FEMA zone X (unshaded) · 68% chance over 30 yrs
- Wildfire 1/10 Low
- Heat 9/10 Extreme 7 d/yr ≥106°F today · 22 d/yr by 30 yrs out
- Wind 10/10 Extreme 99% chance of damaging wind over 30 yrs
- Air quality 1/10 Low 0 unhealthy d/yr today · 0 by 30 yrs out
Nearby sold comps map
Loading sold comps map…
Walkable amenities ~0.75 mi
Loading nearby amenities…
Taxation est. · year 1
- Rental income
- $27,029
- − Mortgage interest
- −$17,364
- − Property taxes
- −$4,650
- − Insurance
- −$1,550
- − Repairs & maintenance
- −$2,162
- − Management
- −$2,162
- − Depreciation
- −$9,018
- Taxable loss
- −$9,878
- Est. tax savings @ 24.0%
- +$2,371
- After-tax cash flow
- $-1,984/yr
For passive investors: Depreciation is non-cash, so a rental often shows a tax loss while cash-flowing — sheltering income. Rental losses are passive: they offset passive income freely, and up to $25,000/yr can offset ordinary (W-2) income if you actively participate and your MAGI is under $100k (phasing out to $0 by $150k); unused losses carry forward. On sale, claimed depreciation is recaptured at up to 25%, and gains may owe capital-gains tax (a 1031 exchange can defer both). Figures are a year-1 estimate at your 24.0% rate — not tax advice; consult a CPA.
Schools (NCES district)
- District
- Brevard
- NCES district ID
- 1200150
- Math proficiency
- 53% ▼ -9.00%
- Reading proficiency
- 57% ▼ -4.00%
- Median HH income
- $49,426
- Composite
- 46.86/100
- National rank
- #2370
- State rank
- #19 of 73 in FL
Livability — Palm Bay
- Score
- 72/100
- State rank
- #366
- US rank
- #6458
Category grades
Schools grade is shown separately in the Schools card above.
Census & demographics
- Census place
- Palm Bay, FL
- County
- Brevard County · 602,871 people
- City population
- 132,211
- Metro
- Palm Bay-Melbourne-Titusville, FL
- Population (ZIP)
- 41,804
- Household income
- $79,977
- Rent vs Own
- Severe rent burden
- 697.0
Population outlook (Brevard County) Hauer SSP2
- Today (2025)
- 623,254 people
- By 2030
- 648,420 · +4.0%
- By 2040
- 690,009 · +10.7%
- By 2050
- 715,669 · +14.8%
- By 2075
- 775,744 · +24.5%
- By 2100
- 776,687 · +24.6%
Race, ethnicity, and origin ACS 2023
- Neighborhood character
- Diverse neighborhood (Simpson 0.70)
- Race & ethnicity
- White 46% Black 21% Hispanic / Latino 20% Two or more races 16% Asian 4%
- Hispanic origin (detail)
- Mexican 2% Puerto Rican 8% Cuban 5%
- Common ancestry
- Hispanic 3% Slovak 2% Lithuanian 2%
- Foreign-born
- 17% · Canada, China, Jamaica
- Languages at home
- 84% English-only · Spanish 9% French/Haitian/Cajun 4% Chinese 1%
Political lean MEDSL · Brevard
- 2024 margin
- Strong R (+20.8) · D 39.1% · R 59.9% · Other 1.0%
- 2008→2024 swing
- -10.4pp toward R · 2008: -10.4pp · 2024: -20.8pp
- All cycles
- 2024: R+20.8 2020: R+16.4 2016: R+19.8 2012: R+12.7 2008: R+10.4
Not yet ingested
- Civics
- —
Market trends
- HPI YoY
- ▲ 18.81%
- Current HPI
- 330.8595
- Rent YoY
- ▲ 3.67%
- Metro
- Palm Bay-Melbourne-Titusville, FL
- State GDP YoY
- ▲ 3.28%
- F500 in state
- 36
Industry mix (Fortune 500 HQ in FL)
| Industry | F500 HQs | Revenue |
|---|---|---|
| Industrial Technology | 2 | $29B |
|
||
| Insurance | 2 | $17B |
|
||
| Retail | 1 | $60B |
|
||
| Technology Distribution | 1 | $58B |
|
||
| Homebuilding | 1 | $35B |
|
||
| Technology Manufacturing | 1 | $35B |
|
||
Price history
+5988.2% since first listed7 events — show timeline
- 2026-02-11 Sold (Public Records) $377,467 Public Records
- 2026-01-12 Pending — SCMLS
- 2025-12-05 Price Changed $309,990 SCMLS
- 2025-10-17 Price Changed $312,990 SCMLS
- 2025-08-29 Listed $317,990 SCMLS
- 2025-02-18 Sold (Public Records) $40,000 Public Records
- 1993-06-07 Sold (Public Records) $6,200 Public Records
Property tax history
+11.3%/yrLatest (2025): $330 · +9.0% YoY. Source: county tax records.
Cash-flow waterfall
monthlySold comps — $/sqft
last 12 mo · ≤1 miLoading sold comps…